Multi ORBv6Multiple period Opening Range indicator with alerts. Up to six user defined periods for trading different futures sessions.
Opening

Multi-ORB v6This indicator will chart multiple user-defined (up to 6) opening range periods. For futures I recommend the 15 min OR for Tokyo and London opens (or the 8:30 5 minute OR on news days ) and the 1, 5, 15, and 60 IB periods. The indicator will highlight up and down breaks as well as issue alerts. Enjoy.

Session Opening Range Breakout (ORBO)This strategy automates a classic Opening Range Breakout (ORBO) approach: it builds a price range for the first minutes after the market opens, then looks for strong breakouts above or below that range to catch early directional moves.
Concept
The idea behind ORBO is simple:
The first minutes after the session open are often highly informative.
Price forms an “opening range” that acts as a mini support/resistance zone.
A clean breakout beyond this zone can lead to high-momentum moves.
This script turns that logic into a fully backtestable strategy in TradingView.
How the strategy works
Opening Range Session
Default session: 09:30–09:50 (exchange time)
During this window, the script tracks:
orHigh → highest high within the session
orLow → lowest low within the session
This forms your Opening Range for the day.
Breakout Logic (after the window ends)
Once the defined session ends:
Long Entry:
If the close crosses above the Opening Range High (orHigh),
→ strategy.entry("OR Long", strategy.long) is triggered.
Short Entry:
If the close crosses below the Opening Range Low (orLow),
→ strategy.entry("OR Short", strategy.short) is triggered.
Only one opening range per day is considered, which keeps the logic clean and easy to interpret.
Daily Reset
At the start of a new trading day, the script resets:
orHigh := na
orLow := na
A fresh Opening Range is then built using the next session’s 09:30–09:50 candles.
This ensures entries are always based on today’s structure, not yesterday’s.
Visuals & Inputs
Inputs:
Opening range session → default: "0930-0950"
Show OR levels → toggle visibility of OR High / Low lines
Fill range body → optional shaded zone between OR High and OR Low
Chart visuals:
A green line marks the Opening Range High.
A red line marks the Opening Range Low.
Optional yellow fill highlights the entire OR zone.
Background shading during the session shows when the range is currently being built.
These visuals make it easy to see:
Where the OR sits relative to current price
How clean / noisy the breakout was
How often price respects or rejects the opening zone
Backtesting & Optimization
Because this is written as a strategy():
You can use TradingView’s Strategy Tester to view:
Win rate
Net profit
Drawdown
Profit factor
Equity curve
Ideas to experiment with:
Change the session window (e.g., 09:15–09:45, 10:00–10:30)
Apply to different:
Markets: indices, FX, crypto, stocks
Timeframes: 1m / 5m / 15m
Add your own:
Stop Loss & Take Profit levels
Time filters (only trade certain days / times)
Volatility filters (e.g., ATR, range size thresholds)
Higher-timeframe trend filter (e.g., only take longs above 200 EMA)

MTF Liquidity Levels Pro (D/W/M) [SmartFoxy]✅ SCRIPT DESCRIPTION (Premium MTF High-Low Levels)
Overview
This indicator automatically plots key High/Low levels across three major timeframes:
Daily (D) , Weekly (W) , and Monthly (M) .
It includes:
• Current period highs/lows (DH/DL, WH/WL, MH/ML);
• Previous period highs/lows (PDH/PDL, PWH/PWL, PMH/PML);
• Open levels (Day Open, Day True Open, Week Open, Month Open);
• Visual elements such as separators, period boxes, labels, and price markers;
• A fully customizable breakout alert system .
The indicator is designed for precise market structure analysis with a focus on liquidity, MTF mechanics, and clean price action.
________________________________________
How It Works
The script tracks historical High/Low levels on each timeframe and displays:
✅ Current High/Low Levels :
Daily;
Weekly;
Monthly.
✅ Previous High/Low levels from the previous day, week, and month:
PDH / PDL;
PWH / PWL;
PMH / PML.
You can select how many previous levels to display (1, 2, 3…).
✅ Open Levels:
Day Open;
Week Open;
Month Open.
Includes optional True Day Open with time offset.
✅ Visual Period Boxes highlighting each session (Day Box, Week Box, Month Box) to help identify intraday and intraperiod structure.
✅ Vertical Separators for the start of each day, week, and month.
✅ Customizable Labels & Price Markers with positions, sizes, and optional price display.
________________________________________
Alerts
A flexible alert module is built in:
✅ Breakout of Any Previous Level (D/W/M) •➤ Triggers when price breaks any previous High/Low:
PDH/PDL;
PWH/PWL;
PMH/PML.
✅ Breakout of Previous Level 1 (D/W/M) •➤ Triggers only for the closest previous levels:
PDH1/PDL1;
PWH1/PWL1;
PMH1/PML1.
✅ Custom Breakout •➤ Choose a specific level:
PDH / PDL;
PWH / PWL;
PMH / PML.
and select which level number (1, 2, 3…) the alert should track.
________________________________________
How to Use
Select which timeframes (D/W/M) to display.
Choose how many previous levels to plot.
Enable Open, Boxes, Separators, or Labels as needed.
Enable True Day Open with offset if required.
Activate Alerts and choose the breakout logic:
• All previous levels;
• Only the nearest level;
• Custom level selection.
Create an alert in TradingView using “Any alert() function call”.
________________________________________
Why This Indicator Is Useful
✅ Instantly reveals key High/Low liquidity zones across multiple timeframes
✅ Helps synchronize market structure across D/W/M levels
✅ Useful for identifying impulses, breakouts, reversals, and liquidity runs
✅ Highlights levels price frequently revisits
✅ Eliminates the need for additional MTF tools
✅ Alerts automate breakout detection for both intraday and swing traders
Suitable for all markets : Forex, Crypto, Indices, Stocks, Futures.

Period Separator + Future Lines (Exchange-Time Synced)Monthly, Weekly, Daily,4hr and hr dividers and future separators (custom as wish, how many lines it should show in future)
Future separators corrected
Multi-Timeframe Open & High/Low MarkersWill mark opening of month week quater year as input via user.
Also give option to mark high low at Specified Time Frame
One can use reference that if CMP is above monthly opening of High Low the script is bullish
and vice versa

Opening Candle Zone with ATR Bands by nkChartsThis indicator highlights the opening range of each trading session and projects dynamic ATR-based zones around it.
Key Features
Plots high and low levels of the opening candle for each new daily session.
Extends these levels across the session, providing clear intraday support and resistance zones.
Adds ATR-based offset bands above and below the opening range for volatility-adjusted levels.
Customizable colors, ATR length, and multiplier for flexible use across markets and timeframes.
Adjustable session history limit to control how many past levels remain on the chart.
How to Use:
The opening range high/low often acts as strong intraday support or resistance.
The ATR bands give an adaptive volatility buffer, useful for breakout or mean-reversion strategies.
Works on any market with clear session opens.
This tool is designed for traders who want to combine session-based price action with volatility insights, helping identify potential breakouts, reversals, or consolidation areas throughout the day.
⚠️ Disclaimer: This indicator is for educational purposes only. It does not provide financial advice or guarantee profits. Always perform your own analysis before making trading decisions.

ORB FVG Strategy with telegram V6.1Summary
Intraday NY-session strategy with Opening-Range bias (09:30–10:00 NY), FVG entries (incl. optional HTF FVGs), momentum filters (LinReg slope & Williams %R), limit entries inside the zone, SL from FVG anchors, and TP via risk-reward. Includes session/trade caps, pending-order handling, auto-cancel at NY time, and optional Telegram webhook alerts.
Feature Overview
Opening Range & Bias: OR high/low built until 10:00 NY, then frozen. Bias from confirmed 5-minute candles (modes: Body Close, Complete Candle, Wick Only).
FVG Scanner: Bull/bear FVGs (choose wick or body gaps), min size, auto-extend, mitigation cleanup (touch or 50%).
HTF FVG (10 min): Optional – displayed after ≥ 2 consecutive FVGs; cleans up on touch/50%.
Entry/SL/TP: Entry at X% fill (+extra %) within the FVG; SL from FVG candle / FVG-1 / FVG-2 (smart) + buffer; TP via risk-reward.
Momentum Filters: LinReg slope (MLL) + Williams %R with threshold/slope filters (individually switchable).
Intrabar Mode (optional): Immediate Open/intrabar entry on touch (calc_on_every_tick=true) or classic bar-close confirmation (toggle).
Trade Management: Max trades/day, pending cap, auto-cancel at defined NY time, pause after first winner (optional).
Telegram: Programmatic alerts via alert() with Telegram-ready JSON payload.
Parameters (compact)
Group Parameter Purpose
Sessions Trading session, Opening range Trading/OR window (internal NY TZ)
Bias Body Close / Complete Candle / Wick Only Bias confirmation relative to OR
Liquidity LQ session, lookback days, cleanup points, show lines Intraday liquidity marks & cleanup
FVG Min size, wick/body, colors, extend, cleanup Detection/visualization & validity
HTF FVG (10 m) Toggle/Display/Colors Conservative HTF filter/POI
Entry Fill %, extra %, max pending, validity (bars), cancel time, intrabar switch Execution timing, order caps, auto-cancel
Stop Loss Source: Candle / -1 / -2 (smart), buffer (points) SL anchor from FVG history + safety offset
Take Profit Risk-Reward (R:R) Target calculation
Momentum LinReg length/min slope, W%R length/min slope, HUD Trend/momentum filters
Trade Mgmt Max trades/day, pause after win Daily cap / risk cooldown
Telegram Enabled, tester, interval, channel id Webhook output & test signals
Debug & Info Debug panel, rejection reasons On-chart status/diagnostics
Alerts / Telegram Webhook (Quick Setup)
Create an alert with Condition: “Any alert() function call”.
Webhook URL: api.telegram.org
Message: leave empty (the strategy provides JSON via alert() – includes chat_id, parse_mode, text).
Ensure your bot can post to the channel and the chat_id is valid.
Repainting & Backtesting
HTF series via lookahead_off on closed higher-TF candles; FVG detection on confirmed bars (barstate.isconfirmed).
Intrabar/Open entries allow earlier fills but typically cause differences between backtest and live (tick granularity/slippage, limit touch on bar OHLC).
For reproducibility, trade without intrabar (bar-close only).
Limitations
No full tick simulation; limit fills rely on bar OHLC.
Liquidity “cleanup” is rule-based (not an orderbook).
Telegram depends on correct webhook configuration.
Tips
Timeframes: M5 (intrabar)
Start with modest R:R (e.g., 1.5–2.0) and tune filters carefully.
Disclaimer
No financial advice. Past results do not guarantee future performance. Use responsibly and follow Public Library rules.
License / Credits
© 2025 Lean Trading (Lennart Pomreinke). License: MPL-2.0.
Changelog
V06.1: Intrabar switch (Open/intrabar vs bar-close), Telegram sanitizer & tester, HTF-FVG cleanup, refined pending/cancel logic, debug panel (status & rejections).

Multi-Session Opening RangesThe Multi-Session Opening Ranges indicator plots the Opening Range (OR) levels for three major trading sessions: Asia, London, and New York. It displays the high (ORH), low (ORL), and midline of each session's opening range, helping traders identify key price levels for potential breakouts, reversals, or support/resistance zones.
This indicator is highly customizable, allowing users to tailor the appearance and behavior of each session independently.
Features
Multi-Session Support: Visualizes Opening Ranges for Asia, London, and New York sessions, with customizable session times and timezones.
Customizable Lines: Adjust the color, style (solid, dashed, dotted), and width of ORH, ORL, and midline for each session.
Offset Control: Set a custom offset (in bars) for lines and labels to position them away from price action for better visibility.
Fill Customization: Choose the fill color for the area between ORH and ORL for each session.
Historical Data Option: Toggle the display of historical OR levels to focus on current session data or analyze past ranges.
Timezone Flexibility: Select from a wide range of timezones to align session times with your trading needs.
Label Customization: Adjust the size of labels (tiny, small, normal, large, huge) for clarity on any chart.
How It Works
The indicator identifies the high and low prices during the user-defined opening range period for each session (default: 5 minutes). It then draws:
ORH (Opening Range High): The highest price during the session's opening range.
ORL (Opening Range Low): The lowest price during the session's opening range.
Midline: The average of ORH and ORL, plotted as a dashed line by default.
Filled Area: A semi-transparent fill between ORH and ORL to highlight the range.
Lines and labels extend until the start of the next session or can be offset by a user-specified number of bars for better chart readability. The indicator supports historical data display for analyzing past session ranges.
Inputs
Display:
Show Historical Data: Enable/disable historical OR levels.
Timezone: Select the timezone for session calculations (e.g., UTC-4, UTC+1, etc.).
Asia/London/New York Sessions:
Show Session: Enable/disable the session.
Session Time: Define the start and end time for the opening range (e.g., "0930-0935:1234567" for 9:30–9:35 AM, all days).
Asia/London/New York Style:
ORH/ORL/Midline Color: Set the color for each line.
ORH/ORL/Midline Style: Choose solid, dashed, or dotted styles.
ORH/ORL/Midline Width: Adjust line thickness (1–5).
OR Fill Color: Customize the fill color for the OR area.
Lines/Labels Offset: Set the offset (in bars, -50 to 50) to shift lines and labels relative to price action.
General Style:
Label Size: Set the size of ORH and ORL labels (tiny, small, normal, large, huge).
Usage
Add the indicator to your chart.
Configure session times to match your trading instrument and timezone.
Customize colors, line styles, widths, and offsets for each session to suit your chart preferences.
Use the ORH, ORL, and midline levels to identify key price zones for trading strategies, such as breakouts or reversals.
Notes
Ensure session times do not overlap to avoid conflicts in visualization.
Large offsets may place lines/labels outside the visible chart area; adjust as needed.
The indicator is optimized for intraday timeframes but works on any timeframe.

STOCK EXCHANGE + SILVER BULLET FRAMESThis script is an updated version of the " NY/LDN/TOK Stock Exchange Opening Hours " script.
Objective
Displays global stock exchange sessions (New York, London, Tokyo) with session frames, highs/lows, and opening lines. Includes ICT Silver Bullet windows (NY, London, Tokyo) with configurable shading. Past sessions are frozen at close, ongoing sessions update dynamically until closure, and upcoming sessions are pre-drawn. Fully customizable with options for weekends, labels, padding, opacity, and individual session toggles.
It is designed to help traders quickly interpret market context, liquidity zones, and session-based price behavior.
Main Features
Past sessions (historical data)
• Session Frames:
• Each box is frozen at the session’s close.
• The left edge aligns with the opening time, while the right edge is fixed at the closing time.
• The top and bottom reflect the highest and lowest prices during the session.
• Session Labels:
• Names (NY, LDN, TOK) displayed above the frame, aligned left, in the same color as the frame.
• Opening Lines:
• Vertical dotted lines mark the start of each session.
Ongoing and upcoming sessions (live market)
• Dynamic Session Frames:
• The right edge is locked at the future close time.
• The top and bottom update in real time as new highs and lows form.
• Labels and Lines:
• The session label is visible above the active frame.
• Opening lines are drawn as soon as the session begins.
Silver Bullet Time Windows (ICT concept)
• Highlights key liquidity windows within sessions:
• New York: 10:00–11:00 and 14:00–15:00
• London: 08:00–09:00
• Tokyo: 09:00–10:00
• Silver Bullet zones are shaded with configurable opacity (default 5%).
Customization and Options
• Enable or disable individual sessions (NY, London, Tokyo).
• Toggle weekend display (frames and Silver Bullets).
• Adjust label size, padding, and text visibility.
• Control frame opacity (default 0%).
• Optimized memory management with automatic pruning of old graphical objects.

CP Strat ORBnew york opening range breakout and retest allows you to enter a trade with a better clarity if the price comes back and retest the range

BB Opening Range
Master session-based trading with precision range analysis and dynamic extensions
📊 Overview
The BB Opening Range Indicator is a comprehensive session analysis tool that captures, visualizes, and extends price ranges for any defined trading session. Whether you're tracking overnight ranges, opening ranges, or custom session periods, this indicator provides institutional-grade visualization with intelligent range extensions and detailed quadrant analysis.
🎯 Key Features
Dynamic Session Tracking
Define custom session times (default: Midnight 00:00-00:30)
Automatic timezone adjustment for precise session detection
Handles sessions that cross midnight seamlessly
Visual session start/end markers with customizable lines
Intelligent Range Extension
Futures Close (17:00) - Extends ranges until 5:00 PM ET
End of Week - Maintains ranges through Friday close
Always - Continuous extension for persistent levels
Session End Only - Basic range without extension
Advanced Quadrant Analysis
Automatically divides ranges into four equal zones (0-25%, 25-50%, 50-75%, 75-100%)
Color-coded quadrants for instant visual reference
Optional quadrant border lines at 25%, 50%, and 75% levels
Customizable colors and opacity for each quadrant
Historical Range Analytics
Tracks multiple historical ranges (configurable 1-50)
Calculates average range size over customizable lookback period (up to 200 days)
Compares current range to historical average
Maintains clean chart with automatic old range cleanup
Professional Visualization
Clean, institutional-style range boxes with customizable borders
Opening price line overlay
Optional info table showing key levels and statistics
Smart label positioning that follows price action
Predictive next session indicator
📈 Use Cases
Opening Range Breakout Trading
Track the first 30-60 minutes of regular trading hours to identify key support/resistance levels for the day.
Overnight Range Analysis
Monitor overnight/globex sessions to gauge pre-market sentiment and identify potential gaps.
Custom Session Ranges
Define any time period relevant to your strategy - London open, New York open, Asian session, or custom intervals.
Multi-Timeframe Analysis
View how price respects historical session ranges across different timeframes for confluence.
⚙️ Settings Guide
Session Settings
Session Name: Label your session for easy identification
Session Time: Define start and end times (24-hour format)
Extend Until: Choose how long ranges remain visible
Lookback Days: Period for calculating average range size
Max Ranges: Number of historical ranges to display
Display Options
Show Quadrants: Toggle quadrant visualization
Show Info Table: Display statistics table
Table Position: Choose table location on chart
Session Lines: Show/hide session start and next session markers
Open Price Line: Display opening price within range
Label Settings
High/Low Labels: Show range extremes
Quadrant Labels: Display 25%, 50%, 75% levels
Open Price Label: Mark session opening price
Current Range Only: Limit labels to most recent range
Visual Styling
Border Settings: Customize box and quadrant borders
Line Widths: Adjust border and quadrant line thickness
Color Scheme: Full control over all visual elements
Price Range Retrace statisticks [HERMAN]📈 Price Range Retrace Stats
This indicator is designed to help traders quantify how often price retraces to a selected equilibrium level (e.g., 50%) after sweeping the high/low of a defined time-based range.
It is especially useful for modeling sessions such as the London Opening Range (e.g., 02:00–03:00 NY time), checking if price sweeps that range in a subsequent window (e.g., 03:00–04:00), and returns to its 50% level.
✅ What does it do?
Lets you define multiple time ranges (e.g. London, NY Open, custom ranges).
Draws the range box for the selected session time.
Calculates and plots the retracement level (default 50%).
Checks if price sweeps the high/low of the range before retracing.
Tracks success rate, average distance, sample size and displays these stats in a table.
⚙️ Key Features:
Fully customizable time windows (range box time and retracement check time).
-Configurable retracement % (default 50% equilibrium).
-Optional sweep condition (only count retracements if price sweeps the high/low first).
-Clean, theme-adaptive stats table with success rates and averages.
-Supports two independent levels (e.g. London and NY sessions).
📊 Why use it?
This tool turns session-based setups into statistical models:
Backtest session strategies over many days.
Quantify edge with % success over time.
Validate trading ideas with data.
Use probabilities instead of gut feeling.
Example insight you can track:
“Between 3–4 AM NY time, price swept the high/low of the 2–3 AM London Opening Range and returned to its 50% equilibrium level in 64% of 234 sessions.”
📌 Ideal for:
ICT concepts (Opening Range, Sweep, Equilibrium Return).
Algo developers wanting probabilities.
Anyone who wants data-driven confirmation for session range mean-reversion.
Instructions:
1️⃣ Enable the desired Price Range (1 or 2).
2️⃣ Set your Range Time (e.g. 02:00–03:00).
3️⃣ Set your Retracement Check Time (e.g. 03:00–04:00).
4️⃣ Choose retracement % (e.g. 50%).
5️⃣ Watch the box and retrace line plot on chart.
6️⃣ Review the success statistics in the table.

Katalyst's Opening Range BreakoutKatalyst's Opening Range Breakout + No Trade Zone
📜 Overview:
This indicator allows traders to visualize the high and low of the opening range for a user-selected timeframe (e.g., 30s, 1m, 5m, 15m). It features fully customizable lines, labels, and an optional **No Trade Zone** fill to help you identify breakout levels with ease.
---
🎯 Key Features:
1. **Customizable Opening Range**:
- Select your preferred opening range duration: **30 seconds, 1 minute, 2 minutes, 5 minutes, 10 minutes, or 15 minutes**.
- The indicator calculates and plots the **high** and **low** of the selected opening range.
2. **Dynamic Line Styling**:
- Choose the **line color**, **transparency**, and **style**: **Solid, Dashed, or Dotted**.
- Lines extend to the right of the chart for clarity.
3. **No Trade Zone** *(Optional / Disabled by default)*:
- When enabled, fills the area between the high and low lines with a customizable **color and transparency**.
- Helps visually identify consolidation areas where trading might be avoided.
4. **Labels for Precision**:
- Clearly displays the **Opening Range High** and **Low** values.
- Labels are color-coded and positioned dynamically for easy interpretation.
5. **Clean and Efficient Updates**:
- The indicator deletes old lines, labels, and fills before creating new ones, ensuring a clutter-free chart.
---
⚙️ How to Use:
1. **Select Your Timeframe**:
- From the settings, choose your desired opening range duration: 30s, 1m, 2m, 5m, 10m, or 15m.
2. **Customize the Visuals**:
- Adjust line color, style, and transparency.
- Enable the **No Trade Zone** for a transparent background fill between the high and low lines.
3. **Interpret the Breakout**:
- Watch for price movements above or below the **opening range** to identify potential breakout opportunities.
---
🛠 Settings:
Opening Range Duration: Select the timeframe for the opening range (30s, 1m, 2m, 5m, 10m, 15m).
Line Color: Set the color of the range lines.
Line Transparency: Adjust the transparency of the lines (0 = solid, 100 = invisible).
Line Style: Choose line style: Solid, Dashed, or Dotted.
Label Colors: Customize the label colors for the high and low values.
Enable No Trade Zone: Fill the area between high and low lines with a transparent color.
No Trade Zone Color: Set the fill color for the no trade zone.
No Trade Zone Transparency: Adjust the transparency of the no trade zone fill.
---
📈 Ideal For
Day traders and scalpers looking to trade **breakouts**.
Traders who want to identify areas of consolidation visually.
Anyone who relies on the **opening range** for their trading strategy.
---
🔍 Example Usage:
Set the opening range to **5 minutes** and enable the **No Trade Zone** with a light red fill.
Watch for price to break above or below the high/low lines to signal potential trade opportunities.
---
✨ Why Use This Indicator?
This script simplifies your breakout strategy by providing a clear, visually appealing representation of the opening range. The flexible customization options and the optional **No Trade Zone** make it a powerful tool for identifying high-probability trades.
---
Let me know if you need any additional tweaks or clarifications for this description. It's all set to help traders understand and use your powerful script! 🚀📈

The Forexation: Super Trend SignalsOverview:
The Forexation: Super Trend Signals (STS) indicator was crafted to enhance visualization of market trends by integrating multiple technical analysis tools and adding logic to them so they color bullish, bearish, counter trends, and cautious trends. By combining standard and higher-timeframe Supertrends with dynamic EMAs and VWAP, STS offers a multi-dimensional view of market dynamics. This synergy allows traders to:
Assess Trend Strength and Alignment
Identify Momentum Shifts and Reversals
Gauge Market Sentiment through Volume-Weighted Pricing
Filter Out Market Noise for Clearer Signals
Key Features and Synergy:
1. Dual Supertrend Analysis:
Standard Supertrend:
Utilizes the Average True Range (ATR) and a multiplier factor to detect immediate market trends.
Customizable ATR Length and Factor to adjust sensitivity to market volatility.
Used as a guide to help follow the trend and identify where if price breaks through we can be reversing trend or entering a counter/cautious trend.
Higher Time Frame (HTF) Supertrend:
Integrates Supertrend data from a higher timeframe for a broader market perspective.
Smoothing applied via an EMA to reduce lag and false signals.
**Synergistic Effect:
Trend Alignment: By analyzing both standard and HTF Supertrends, STS identifies when short-term trends align with long-term trends, increasing the reliability of trend signals.
Dynamic Adjustments: Traders can adjust parameters to fine-tune the balance between responsiveness and stability.
2. Customized EMAs with Contextual Color-Coding:
Fast and Slow EMAs:
Customizable periods to match different trading strategies and timeframes.
EMAs are used to identify momentum shifts and potential reversals through crossovers.
Dynamic Color-Coding:
EMA lines change color based on their relationship with each other, the Supertrends, and VWAP.
Visual Interpretation:
Bullish Alignment: Fast EMA above Slow EMA, both above Supertrend and VWAP, signals strong upward momentum.
Bearish Alignment: Fast EMA below Slow EMA, both below Supertrend and VWAP, signals strong downward momentum.
Caution Zones: Misalignment or crossovers indicate potential reversals or consolidation.
**Synergistic Effect:
Momentum Confirmation: EMA crossovers are validated against Supertrend directions, reducing false signals.
Support and Resistance Zones: The area between EMAs acts as dynamic support/resistance, visualized through an optional fill.
3. VWAP Integration for Volume-Weighted Insights:
VWAP Analysis:
Calculates the average price weighted by volume, providing insights into institutional trading levels and market sentiment.
**Synergistic Effect:
Trend Validation: Confirms trend strength by analyzing whether price and EMAs are above or below VWAP.
Counter-Trend Detection: Identifies potential pullbacks or reversals when price interacts with VWAP against the prevailing trend of the standard and higher time frame SuperTrend.
4. Composite Signal Generation:
Color-Coded Market Conditions:
Bullish Signals (Green): Strong upward trends with alignment across standard + HTF Supertrend, EMAs, and price above VWAP.
Bearish Signals (Red): Strong downward trends with inverse alignment.
Caution State (Orange): Potential market reversals or uncertainty when indicators are misaligned. (Example: price above VWAP but under HTF SuperTrend)
Counter-Trend Conditions (Yellow): Signals possible pullbacks or consolidations when price or EMAs cross VWAP. (Example: Price is above VWAP & HTF SuperTrend but the EMAs and Standard SuperTrend are in a down trend)
**Synergistic Effect:
Enhanced Signal Accuracy: By requiring multiple confirmations across different indicators and timeframes, STS filters out noise and increases the probability of trends in the market.
Timely Alerts: Alerts are generated when critical conditions are met, keeping traders informed of significant market movements.
Underlying Concepts and Calculations:
Supertrend Algorithm:
Calculation:
Supertrend is calculated using ATR to set a dynamic trailing stop that follows price movements.
The indicator switches between bullish and bearish modes when price crosses the Supertrend line.
Customization:
ATR Length and Factor can be adjusted to make the Supertrend more or less sensitive to price changes.
In STS: Both standard and HTF Supertrends are used, with the HTF providing longer-term trend context.
Exponential Moving Averages (EMAs):
Calculation:
EMAs apply more weight to recent prices, making them more responsive than Simple Moving Averages (SMAs).
Crossovers between Fast and Slow EMAs signal potential momentum shifts.
Customization:
Periods for Fast and Slow EMAs are user-defined to suit different trading styles.
In STS: EMA behavior is analyzed in conjunction with Supertrend and VWAP to validate signals.
Volume Weighted Average Price (VWAP):
Calculation:
VWAP accumulates total dollars traded (price times volume) divided by total volume over a specific period.
Reflects the average price at which the instrument has traded throughout the day based on both price and volume.
**In STS:
VWAP serves as a dynamic support/resistance level.
Interaction with VWAP can indicate shifts in market sentiment, especially when combined with other indicators.
Justifying the Value of STS:
Holistic Market Analysis:
STS doesn't just merge indicators; it creates a cohesive system where each component validates and enhances the others.
This integrated approach offers a more reliable analysis than using individual indicators in isolation.
Customizable and Adaptive:
Traders have control over key parameters, allowing STS to be tailored to different markets and trading styles.
The ability to adjust sensitivity helps in adapting to varying market conditions.
Enhanced Decision-Making:
By providing clear visual cues and alerts, STS aids in quick interpretation of complex market data.
The indicator helps in identifying high-probability trend opportunities and managing risk effectively with trailing SuperTrend guidance.
Unique Signal Filtering:
The combination of multiple confirmations reduces the likelihood of false trend signals.
The use of higher timeframe data and volume-weighted analysis adds depth to trend assessment.
How to Use STS Effectively:
1. Configuring Settings:
Supertrend Settings:
Adjust ATR Length and Factor to set the desired sensitivity.
Select the Higher Time Frame for the HTF Supertrend to align with your trading horizon.
Set the Smoothing Period for the EMA applied to the HTF Supertrend.
EMA Settings:
Define periods for Fast and Slow EMAs based on your strategy.
Ensure the Fast EMA period is shorter than the Slow EMA for effective crossovers.
Color and Display Settings:
Customize colors for different market conditions to enhance visual clarity.
Choose whether to display the HTF Supertrend, EMA lines, EMA fill, and VWAP.
2. Interpreting Signals:
Bullish Scenario:
Supertrends indicate an uptrend.
Fast EMA crosses above Slow EMA, both trending upwards.
Price and EMAs are above VWAP.
Action: Consider long positions, using the standard Supertrend as a trailing stop.
Bearish Scenario:
Supertrends indicate a downtrend.
Fast EMA crosses below Slow EMA, both trending downwards.
Price and EMAs are below VWAP.
Action: Consider short positions. using the standard Supertrend as a trailing stop
Caution and Counter-Trend Signals:
Misalignment between indicators or color changes to orange/yellow.
Action: Exercise caution, tighten stops, or wait for clearer signals.
4. Setting Up Alerts:
Access the Alerts menu.
Configure alerts for:
Supertrend Direction Changes
EMA Crossovers
Price Crossing VWAP
Set alert actions and ensure they trigger on confirmed data by selecting "Once Per Bar Close."
Example Trading Strategies:
Trend Following:
Use STS to identify strong trends where all indicators are aligned.
Enter positions in the direction of the trend.
Use Supertrend lines as dynamic stop-loss levels.
Pullback Entries:
Wait for price to pull back to the EMA fill area or VWAP in a prevailing trend.
Look for bounce signals off these levels when supported by Supertrend direction.
Counter-Trend Opportunities:
Identify potential reversals when caution or counter-trend signals appear.
Confirm with additional analysis or indicators before taking positions against the main trend.
Disclaimer:
This indicator is intended to aid in technical analysis and should be used as part of a comprehensive trading strategy. It does not guarantee profits and carries the risk of loss. Trading financial instruments involves significant risk; please consult with a qualified financial advisor before making any investment decisions. Past performance is not indicative of future results.
Final Notes:
The Forexation: Super Trend Signals (STS) indicator represents a thoughtfully engineered tool that brings together multiple technical elements to provide a more nuanced understanding of market behavior. By leveraging the strengths of Supertrend, EMAs, and VWAP in unison, STS aims to enhance trading precision and confidence in the trends the market creates but also guide risk management levels for managing a trade and stop loss areas.
We are committed to continuous improvement and value user feedback. Please share your experiences and suggestions to help us refine the indicator further.
Happy Trading!
Hourly Separator + Opening LineThis indicator shows the vertical and horizontal opening lines for the hourly timeframe.
Also has options to choose a different opening time:
- 1 Hour
- 30 Min
- 15 Min
- 10 Min
- 5 Min
B A N K $ - Opening Lines / Daily Separators This is a simple indicator that aids the trader in being able to visualise each trading day of the week;
Key Features
Weekly Open Line
Daily Open Line
Option for Background Lines
Weekly & Daily Open Lines
Information ℹ️
These are vertical lines that are anchored to the hour of the Weekly Open and the hour of each Daily Candle Open. The settings are customisable, allowing to you edit the Width, Style & Colour. You can also select Monday as the Weekly Open if Monday is a no-trade day for you.
Settings ⚙️
1h Toggle - by default Daily Open Lines are only visible under the 1h, you can select to also make them visible on the 1h.
Background Lines - you can replace the chart lines with background lines, this can improve performance and allow you to load more lines on the chart when going back in price.
Show Days of Week - this prints the current day on the chart.

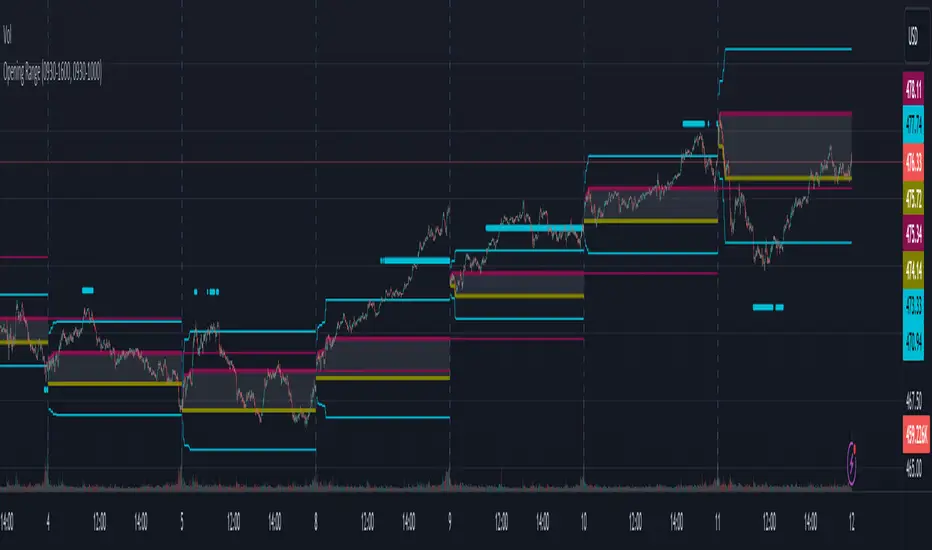
Opening RangeThe opening range or first 30 minutes of trading during the day sets the tone and becomes an important reference through the rest of the day. Price will react as it reaches the high and low of the opening range.
Backtesting has shown that the strategies based on the opening range have merit and provide an edge in trading. By not being aware of these points of reference you put yourself at risk.
In addition to the opening range, the distance from the high or low of the opening range plus the width of the opening range forms another important reference point.
Opening Range Rules.
Price must break out of the opening range in order to have a trending day. As long as price is inside the opening range, expect the trade to be choppy.
Once price leaves the opening range the market can begin to trend. However, before it trends most times it will retest the boundary of the opening range. This is a critical point, and a better than average entry for a position to join the trend. However, if price closes back inside the opening range watch out. Re-entry to the opening range has a high probability of going to the middle of the opening range, and a better than average probability of crossing the entire opening range.
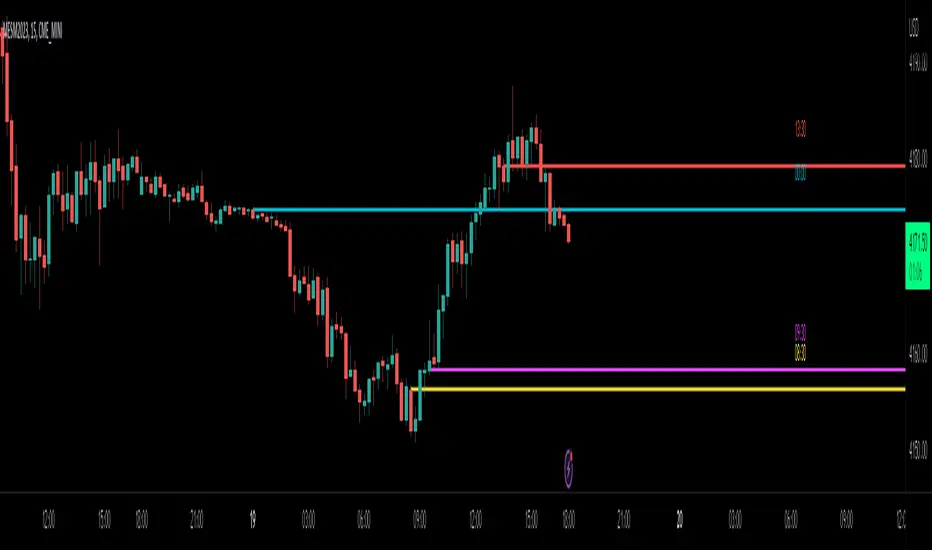
In the above chart we can see price broke below the opening range then returned to retest the opening range before beginning a downward trend that delivered 175 pts on NQ.
Upon re-entering the opening range price tried to break down again but ultimately traveled up until it hit the 50% mark of the opening range.
Once a trend has begun the first target is the green line which is 1 width of the opening range outside of the opening range.
Once price broke out of the opening range to the upside, it came back to retest the opening range high, before beginning an uptrend that delivered 120 pts on NQ.
The Opening Range / First Bar By Market Mindset - Zero To EndlesThe script shows the opening range of the instrument based on different resolutions and timeframes.
Inputs :
1. Resolution
It decides the calculation frequency of the script.
In Auto resolution, Standard values have been used.
2. Timeframe
It decides the timeframe for the OHLC values.
By default, it will use the chart timeframe and so chart OHLC values.
3. Lookback
It decides the no. of ranges shown on the chart.
Middle Line can be hidden from the settings.
The script can be used for any instrument and on any timeframe.
If price is above the opening range or the middle line, a trader should look for long opportunities.
If price is below the opening range or the middle line, a trader should look for short opportunities.
A sideways or choppy move is exoected if Middle line is crossed again and again.
For trading, wait for atleast 1st bar to close. and let the opening range build up first.
Happy Trading

ICT Opening Lines [MK]Plots horizontal lines for the following opening times:
00:00 open
08:30 open
09:30 open
13:30 open
Opening lines can be used to monitor for power of 3/judas swings as per ICT teachings. The script allows the user to set a maximum timeframe for displaying the lines to keep HTF charts clean. Also an option is available to hide the lines after the market closes. If the hide option is used, the lines will be removed at 23:00.
Removing the lines after market closes ensures that the charts are clean when the market opens.
Labels can be displayed, colors and line styles can be customised.
NDOG & Dynamic Event Horizon° (Experimental)The ICT concept of New Day Opening Gaps (NDOG) is simply an imbalance that may manifest at Daily Opening time. This gap in price is formed by the Close at 5PM EST and the open at 6PM EST.
According to ICT's studies, this gap in price holds a lot of significance when it comes to price action, acting as a magnet or a point of reference during the day (and following days/weeks).
This script applies the supporting concepts of New Week Opening Gaps (Event Horizon and OTE areas) to NDOGs, mimicking my NWOG & Dynamic Event Horizon° indicator. Equally to the latter, this script dynamically selects the most relevant NDOG Dealing Range and plots their EH and OTE levels automatically.
// Please refer to the NWOG indicator post linked above for more information about these concepts
Available Alerts:
– Cross Below Event Horizon
– Cross Above Event Horizon
– New NDOG Range Established
Important Remarks:
– This is purely an experiment, and has not been taught by ICT publicly in any way. Treat this material accordingly.
– Note that although these work on all timeframes, the lower in resolution one goes, the less gaps will be available due to data availability.
– This indicator works on charts that have the NDOG already present in chart (i.e. no crypto assets, unless one looks at CME crypto futures such as BTC1! and ETH1! ).
– The dollar index's NDOGs have a slightly different timestamp, however this has been taken care of and will allow to be plotted ONLY for the TVC:DXY ticker.
TrandingView struggles to display the indicator correctly for the default view, check out its accurate appearance here:

Zazzamira 50-25-25 Trend System Alerts OnlyPublishing my trading system script. It consist of several conditions to happen in order to open a trade. Work best on ES/MES 5 minute timeframe.
I like to use it with this settings:
- UTC -6 (don't tick Exchange Timezone)
and rest as default
To enter a trade, the following conditions must be met: Entry 1: the opening range (8:30AM - 9:15AM UTC-6) must be defined and the price must close above or below the opening range on the 5-minute timeframe. This entry condition defines the trade direction (above = long / below = short). Once the opening range is defined, the Trend-Based Fib Extension is applied from the range high to the range low (and vice versa). Fib levels are required for Exit conditions. Entry 2: the 8 - 27 - 67 - 97 EMAs must be defined. If the EMAs value order is 8 > 27 > 67 > 97, long-only trades are allowed. If the EMAs value order is 8 < 27 < 67 < 97, short-only trades are allowed. This entry condition filters fake breakouts of Entry 1. Entry 3: no trades are allowed after 12:59 UTC-6 (2PM EST). Entry 4: if Entry 1, Entry 2, and Entry 3 conditions are valid and the price hasn't reached the 23.6% Fib line, an entry order can be set at the range high/long with 4 contracts. To exit a trade, the following conditions must be met: Exit 1 (Stop loss): set a trailing stop based on 2.1x ATR (14) from entry. Exit 2: take 50% profits at the 23.6% Fib and leave trailing stop untouched. Exit 3: if Exit 2 triggers, take 50% (25% of total entry) off at 61.8% Fib, leaving Exit 2 trailing stop values valid. Exit 4: exit the full position at the FIB 100% value. Exit 5: all trades must be closed at 3pm UTC-6 (4PM EST). So basically Take Profit are 50%-25%-25% of position.
Code has been written by © Hiubris_Indicators who has been an amazing coder and gave me the possibility to make this script public so a really big shoutout to him.
This indicator only works for alerts, please check version without alerts to backtest or tweaks. This indicator is meant to be used to automate the system via webhooks

Day Trading Booster by DGTTiming when day trading can be everything
In Stock markets typically more volatility (or price activity) occurs at market opening and closings
When it comes to Forex (foreign exchange market), the world’s most traded market, unlike other financial markets, there is no centralized marketplace, currencies trade over the counter in whatever market is open at that time, where time becomes of more importance and key to get better trading opportunities. There are four major forex trading sessions, which are Sydney , Tokyo , London and New York sessions
Forex market is traded 24 hours a day, 5 days a week across by banks, institutions and individual traders worldwide, but that doesn’t mean it’s always active the entire day. It may be very difficult time trying to make money when the market doesn’t move at all. The busiest times with highest trading volume occurs during the overlap of the London and New York trading sessions, because U.S. dollar (USD) and the Euro (EUR) are the two most popular currencies traded. Typically most of the trading activity for a specific currency pair will occur when the trading sessions of the individual currencies overlap. For example, Australian Dollar (AUD) and Japanese Yen (JPY) will experience a higher trading volume when both Sydney and Tokyo sessions are open
There is one influence that impacts Forex matkets and should not be forgotten : the release of the significant news and reports. When a major announcement is made regarding economic data, currency can lose or gain value within a matter of seconds
Cryptocurrency markets on the other hand remain open 24/7, even during public holidays
Until 2021, the Asian impact was so significant in Cryptocurrency markets but recent reasearch reports shows that those patterns have changed and the correlation with the U.S. trading hours is becoming a clear evolving trend.
Unlike any other market Crypto doesn’t rest on weekends, there’s a drop-off in participation and yet algorithmic trading bots and market makers (or liquidity providers) can create a high volume of activity. Never trust the weekend’ is a good thing to remind yourself
One more factor that needs to be taken into accout is Blockchain transaction fees, which are responsive to network congestion and can change dramatically from one hour to the next
In general, Cryptocurrency markets are highly volatile, which means that the price of a coin can change dramatically over a short time period in either direction
The Bottom Line
The more traders trading, the higher the trading volume, and the more active the market. The more active the market, the higher the liquidity (availability of counterparties at any given time to exit or enter a trade), hence the tighter the spreads (the difference between ask and bid price) and the less slippage (the difference between the expected fill price and the actual fill price) - in a nutshell, yield to many good trading opportunities and better order execution (a process of filling the requested buy or sell order)
The best time to trade is when the market is the most active and therefore has the largest trading volume, trading all day long will not only deplete a trader's reserves quickly, but it can burn out even the most persistent trader. Knowing when the markets are more active will give traders peace of mind, that opportunities are not slipping away when they take their eyes off the markets or need to get a few hours of sleep
What does the Day Trading Booster do?
Day Trading Booster is designed ;
- to assist in determining market peak times, the times where better trading opportunities may arise
- to assist in determining the probable trading opportunities
- to help traders create their own strategies. An example strategy of when to trade or not is presented below
For Forex markets specifically includes
- Opening channel of Asian session, Europien session or both
- Opening price, opening range (5m or 15m) and day (session) range of the major trading center sessions, including Frankfurt
- A tabular view of the major forex markets oppening/closing hours, with a countdown timer
- A graphical presentation of typically traded volume and various forext markets oppening/clossing events (not only the major markets but many other around the world)
For All type of markets Day Trading Booster plots
- Day (Session) Open, 5m, 15m or 1h Opening Range
- Day (Session) Referance Levels, based on Average True Range (ATR) or Previous Day (Session) Range (PH - PL)
- Week and Month Open
Day Trading Booster also includes some of the day trader's preffered indicaotrs, such as ;
- VWAP - A custom interpretaion of VWAP is presented here with Auto, Interactive and Manual anchoring options.
- Pivot High/Low detection - Another custom interpretation of Pivot Points High Low indicator.
- A Moving Average with option to choose among SMA, EMA, WMA and HMA
An example strategy - Channel Bearkout Strategy
When day trading a trader usually monitors/analyzes lower timeframe charts and from time to time may loose insight of what really happens on the market from higher time porspective. Do not to forget to look at the larger time frame (than the one chosen to trade with) which gives the bigger picture of market price movements and thus helps to clearly define the trend
Disclaimer : Trading success is all about following your trading strategy and the indicators should fit within your trading strategy, and not to be traded upon solely
The script is for informational and educational purposes only. Use of the script does not constitutes professional and/or financial advice. You alone the sole responsibility of evaluating the script output and risks associated with the use of the script. In exchange for using the script, you agree not to hold dgtrd TradingView user liable for any possible claim for damages arising from any decision you make based on use of the script
