cd_VWAP_mtg_CxCd_VWAP_mtg_Cx
Overview
The most important condition for being successful and profitable in the market is to consistently follow the same rules without compromise, while the price constantly moves in countless different ways.
Regardless of the concept or trading school, those who have rules win.
In this indicator, we will define and use three main sections to set and apply our rules.
The indicator uses the VWAP (Volume Weighted Average Price) — price weighted by volume.
Two VWAPs can be displayed either by manually entering date and time, or by selecting from the menu.
From the menu, you can select the following reference levels:
• HTF Open: Opening candle of the higher timeframe
• ATH / ATL: All-Time High / All-Time Low candles
• PMH / PML, PWH / PWL, PDH / PDL, PH4H / PH4L: Previous Month, Week, Day, or H4 Highs/Lows
• MH / ML, WH / WL, DH / DL, H4H / H4L: Current Month, Week, Day, or H4 Highs/Lows
Additionally, it includes:
• Mitigation / Order Block zones (local buyer-seller balance) across two timeframes.
• Buy/Sell Side Liquidity levels (BSL / SSL) from the aligned higher timeframe (target levels).
________________________________________
Components and Usage
1 – VWAP
Calculated using the classical method:
• High + Volume for the upper value
• Close + Volume for the middle value
• Low + Volume for the lower value
The VWAP is displayed as a colored band, where the coloring represents the bias.
Let’s call this band FVB (Fair Value Band) for ease of explanation.
The FVB represents the final line of defense, the buyer/seller boundary, and in technical terms, it can be viewed as premium/discount zones or support/resistance levels.
Within this critical area, the strong side continues its move, while the weaker side is forced to retreat.
But does the side that breaks beyond the band always keep going?
We all know that’s not always the case — in different pairs and timeframes, price often violates both the upper and lower edges multiple times.
To achieve more consistent analysis, we’ll define a new set of rules.
________________________________________
2 – Mitigation / Order Blocks
In trading literature, there are dozens of different definitions and uses of mitigation or order blocks.
Here, we will interpret the candlesticks to create our own definition, and we’ll use the zones defined by candles that fit this pattern.
For simplicity, let’s abbreviate mitigation as “mtg.”
For a candle to be selected as an mtg, it must clearly show strength from one side (buyers or sellers) — which can also be observed visually on the chart.
________________________________________
Bullish mtg criteria:
1. The first candle must be bullish (close > open) → buyers are strong.
2. The next candle makes a new high (buyers push higher) but fails to close above and pulls back to close inside the previous range → sellers react.
It also must not break the previous low → buyers defend.
3. In the following candle(s), as long as the first candle’s low is protected and the second candle’s high is broken, it indicates buyer strength → a bullish mtg is confirmed.
When price returns to this zone later (gets mitigated), the expectation is that the zone holds and price pushes upward again.
If the low is violated, the mtg becomes invalid.
In technical terms:
If the previous candle’s high is broken but no close occurs above it, the expectation is a reversal move that will retest its low.
Question:
What if the low is protected and in the next candle(s) a new high forms?
Answer: → Bullish mtg.
Bearish mtg (opposite)
3 – Buy/Sell Side Liquidity Levels
With the help of the aligned higher timeframe (swing points), we will define our market structure framework and set our liquidity targets accordingly.
Let’s put the pieces together.
If we continue explaining from a trade-focused perspective, our first priority should be our bias — our projection or expectation of the market’s potential movement.
We will determine this bias using the FVB.
Since we know the band often gets violated on both sides, we want the price action to convince us of its strength.
To do that, we’ll use the first candle that closes beyond the band.
The distance from that candle’s high to low will be our threshold range
Bullish level = high + (candle length × coefficient)
Bearish level = low - (candle length × coefficient)
When the price closes beyond this threshold, it demonstrates strength, and our bias will now align in that direction.
How long will this bias remain valid?
→ Until a closing candle appears on the opposite side of the band.
If a close occurs on the opposite side, then a new bias will only be confirmed once the new threshold level is broken.
During the period in between, we have no bias.
Let’s continue on the chart:
Now that our bias has been established, where and how do we look for trade opportunities?
There are two possible entry approaches:
• Aggressive entry: Enter immediately with the breakout.
• Conservative entry: Wait for a pullback and enter once a suitable structure forms.
(The choice depends on the user’s preference.)
At this stage, the user can apply their own entry model. Let’s give an example:
Let’s assume we’re looking for setups using HTF sweep + LTF CISD confirmation.
Once our bias turns bearish, we look for an HTF sweep forming on or near an FVB or mtg block, and then confirm the entry with a CISD signal.
In summary:
• FVB defines the bias, the entry zone, and the target zone.
• Mtg blocks represent entry zones.
• BSL / SSL levels suggest target zones.
Overlapping FVB and mtg blocks are expected to be more effective.
The indicator also provides an option for a second FVB.
A band attached to a lower timeframe can be used as confirmation.
• Main band: Bias + FVB
• Extra band: Entry trigger confirmed by a close beyond it.
Mtg blocks can provide trade entry opportunities, especially when the price is moving strongly in one direction (flow).
Consecutive or complementary mtg blocks indicate that the price is decisive in one direction, while sometimes also showing areas where we should wait before entering.
Mtg blocks that contain an FVG (Fair Value Gap) within their body are expected to be more effective.
Settings:
The default values are set to 1-3-5m, optimized for scalping trades.
VWAP settings:
Main VWAP (FVB):
• Can be set by selecting a start time, manually entering date and time, or choosing a predefined level.
Extra VWAP (FVB):
• Set from the menu. If not needed, select “none.”
• Visibility, color, and fill settings for VWAP are located here.
• Threshold levels visibility and color options are also in this section.
• The multiplier is used for calculating the threshold level.
Important:
• If the Extra VWAP is selected but not displayed, you need to increase the chart timeframe.
o Example: If the chart is on 3m and you select WH from the extra options, it will not display correctly.
• Upper limits for VWAP:
o 1m and 3m charts: daily High/Low
o 5m chart: weekly High/Low
________________________________________
Mtg Settings:
• Visibility and color settings for blocks are configured here.
• To display on a second timeframe, the box must be checked and the timeframe specified.
• Optional display modes: “only active blocks,” “only last violated mtg,” or “all.”
• For confirmation and removal criteria, choosing high/low or close determines the source used for mtg block formation and deletion conditions.
BSL/SSL Settings:
• Visibility, color, font size, and line style can be configured in this section.
When “Auto” is selected, the aligned timeframe is determined automatically by the indicator, while in manual mode, the user defines the timeframe.
Final Words:
Simply opening trades every time the price touches the VWAP or mtg blocks will not make you a profitable trader. Searching for setups with similar structures while maintaining proper risk management will yield better results in the long run.
I would be happy to hear your feedback and suggestions.
Happy trading!
Indicators and strategies

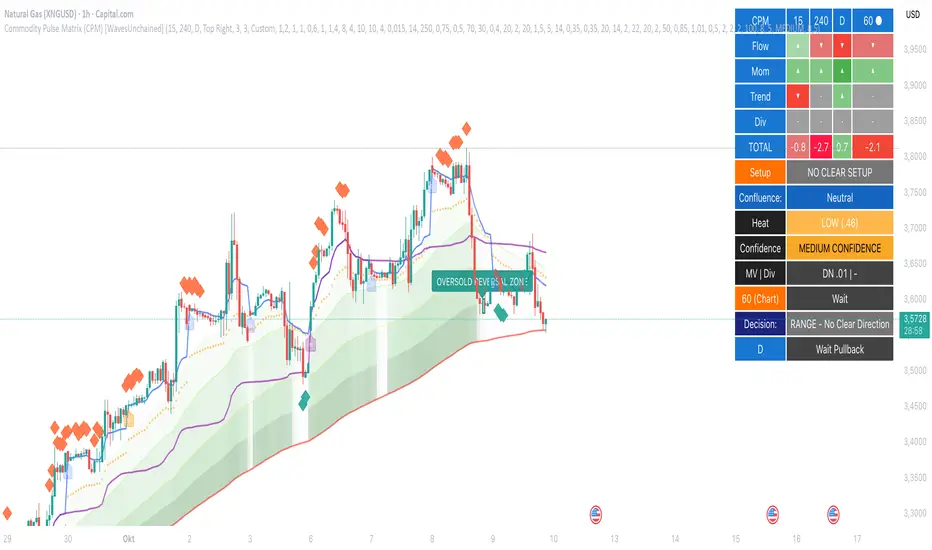
Commodity Pulse Matrix (CPM) [WavesUnchained]Commodity Pulse Matrix (CPM) is a professional multi-timeframe analysis suite built for commodity trading. It compresses dozens of signals into one color-coded matrix to show directional bias and quality across three user-set timeframes, plus optional chart TF. Non-repainting design: HTF values use confirmed bars; rendering is optimized.
Categories:
Flow = MFI, OBV, volume trend, smart-money bias. Momentum = RSI (dynamic zones), MACD histo, CCI, WaveCycle Momentum (adaptive, ATR-normalized). Trend = EMA stack (20/50/100/200), ADX+DI, VWAP positioning. Volatility = ATR%, Williams Vix Fix spikes, squeeze (Bollinger inside Keltner). Structure = price vs key EMAs, pivot S/R alignment. Divergence = regular/hidden on RSI via RDZ, optional MACD, cluster strength; zone-gated and bar-confirmed.
Oscillators:
WCM detects momentum swings with dead-zone filtering and dynamic OB/OS. RDZ finds divergences only in RSI 70/30 zones with optional volume/MFI gate. WVF highlights volatility-shock exhaustion (bottom/top mode) and can feed the exhaustion filter.
Exhaustion module:
Strict 5-point check (RSI extreme, ATR range expansion, volume spike, wick ratio, compressed body) with Watch → Confirmed logic and optional reversal-zone boxes from pivots. Squeeze detector flags contraction and first expansion.
Matrix and visuals:
Compact or detailed grid; 4-layer heat gradient; ▲/▼/• symbols; action badges (Setup/Neutral); optional VWAP cross markers (session, anchored high/low, clusters). Overlay options: EMA gradient fill, AVWAP (session/week/month), S/R lines, divergence diamonds (teal/amber), exhaustion triangles, squeeze dots. Performance friendly (updates on last bar).
Scoring:
Each category scores −3…+3, weighted by importance (default: Flow 1.2, Momentum 1.0, Trend 1.0, Volatility 0.6, Structure 1.0, Divergence 1.4). Confluence bands: ≥ +8 strong bull, ≥ +4 moderate bull, ≤ −4 moderate bear, ≤ −8 strong bear; otherwise neutral. Heat score (0–1) blends magnitude, TF alignment, divergence strength, and volume confirmation.
Configuration:
Presets Intraday/Swing/Carry or full Custom. Adjustable weights, thresholds, oscillator params (WCM, RDZ, WVF), HTF-confirmed mode, matrix layout, alert conditions. Works on commodities, FX, indices; 1m to Monthly.
How to use:
Wait for TF alignment and high confluence; use reversal zones and divergence/exhaustion for timing. Trend follow: all TFs green, pullback to EMA20, stop below EMA50. Divergence: diamond appears, matrix flips, enter with confirmation. Squeeze: contraction then expansion in matrix direction.
Notes:
Pine v6. Non-repainting by design. Optimized security calls and UI throttling. Alert-ready. Backtest before live trading; manage risk; news context matters.
Disclaimer:
Educational only. Not financial advice. Past performance is not indicative of future results.
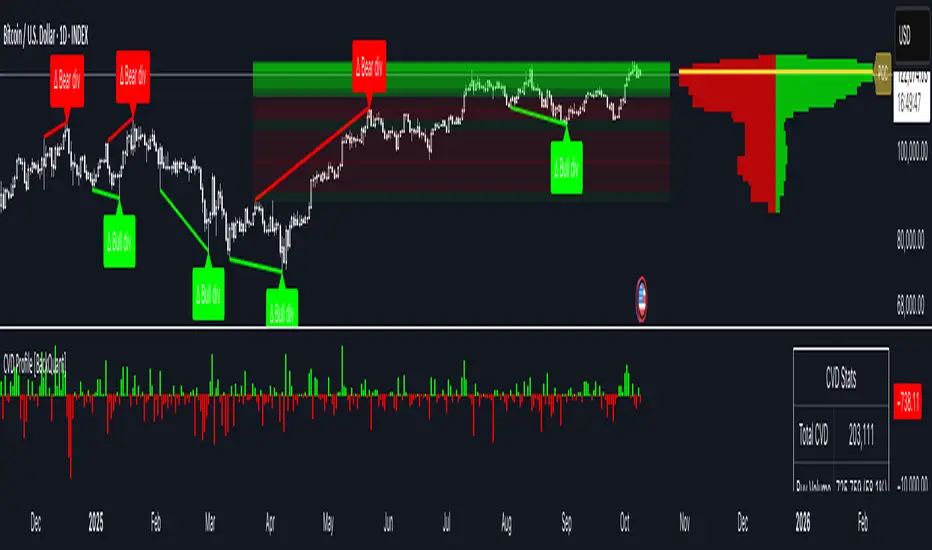
Cumulative Volume Delta Profile and Heatmap [BackQuant]Cumulative Volume Delta Profile and Heatmap
A multi-view CVD workstation that measures buying vs selling pressure, renders a price-aligned CVD profile with Point of Control, paints an optional heatmap of delta intensity, and detects classical CVD divergences using pivot logic. Built for reading who is in control, where participation clustered, and when effort is failing to produce result.
What is CVD
Cumulative Volume Delta accumulates the difference between aggressive buys and aggressive sells over time. When CVD rises, buyers are lifting the offer more than sellers are hitting the bid. When CVD falls, the opposite is true. Plotting CVD alongside price helps you judge whether price moves are supported by real participation or are running on fumes.
Core Features
Visual Analysis Components
CVD Columns - Plot of cumulative delta, colored by side, for quick read of participation bias.
CVD Profile - Price-aligned histogram of CVD accumulation using user-set bins. Shows where net initiative clustered.
Split Buy and Sell CVD - Optional two-sided profile that separates positive and negative CVD into distinct wings.
POC - Point of Control - The price level with the highest absolute CVD accumulation, labeled and line-marked.
Heatmap - Semi-transparent blocks behind price that encode CVD intensity across the last N bars.
Divergence Engine - Pivot-based detection of Bearish and Bullish CVD divergences with optional lines and labels.
Stats Panel - Top level metrics: Total CVD, Buy and Sell totals with percentages, Delta Ratio, and current POC price.
How it works
Delta source and sampling
You select an Anchor Timeframe that defines the higher time aggregation for reading the trend of CVD.
The script pulls lower timeframe volume delta and aggregates it to the anchor window. You can let it auto-select the lower timeframe or force a custom one.
CVD is then accumulated bar by bar to form a running total. This plot shows the direction and persistence of initiative.
Profile construction
The recent price range is split into Profile Granularity bins.
As price traverses a bin, the current delta contribution is added to that bin.
If Split Buy and Sell CVD is enabled, positive CVD goes to the right wing and negative CVD to the left wing.
Widths are scaled by each side’s maximum so you can compare distribution shape at a glance.
The Point of Control is the bin with the highest absolute CVD. This marks where initiative concentrated the most.
Heatmap
For each bin, the script computes intensity as absolute CVD relative to the maximum bin value.
Color is derived from the side in control in that bin and shaded by intensity.
Heatmap Length sets how far back the panels extend, highlighting recurring participation zones.
Divergence model
You define pivot sensitivity with Pivot Left and Right .
Bearish divergence triggers when price confirms a higher high while CVD fails to make a higher high within a configurable Delta Tolerance .
Bullish divergence triggers when price confirms a lower low while CVD fails to make a lower low.
On trigger, optional link lines and labels are drawn at the pivots for immediate context.
Key Settings
Delta Source
Anchor Timeframe - Higher TF for the CVD narrative.
Custom Lower TF and Lower Timeframe - Force the sampling TF if desired.
Pivot Logic
Pivot Left and Right - Bars to each side for swing confirmation.
Delta Tolerance - Small allowance to avoid near-miss false positives.
CVD Profile
Show CVD Profile - Toggle profile rendering.
Split Buy and Sell CVD - Two-sided profile for clearer side attribution.
Show Heatmap - Project intensity panels behind price.
Show POC and POC Color - Mark the dominant CVD node.
Profile Granularity - Number of bins across the visible price range.
Profile Offset and Profile Width - Position and scale the profile.
Profile Position - Right, Left, or Current bar alignment.
Visuals
Bullish Div Color and Bearish Div Color - Colors for divergence artifacts.
Show Divergence Lines and Labels - Visualize pivots and annotations.
Plot CVD - Column plot of total CVD.
Show Statistics and Position - Toggle and place the summary table.
Reading the display
CVD columns
Rising CVD confirms buyers are in control. Falling CVD confirms sellers.
Flat or choppy CVD during wide price moves hints at passive or exhausted participation.
CVD profile wings
Thick right wing near a price zone implies heavy buy initiative accumulated there.
Thick left wing implies heavy sell initiative.
POC marks the strongest initiative node. Expect reactions on first touch and rotations around this level when the tape is balanced.
Heatmap
Brighter blocks indicate stronger historical net initiative at that price.
Stacked bright bands form CVD high volume nodes. These often behave like magnets or shelves for future trade.
Divergences
Bearish - Price prints a higher high while CVD fails to do so. Effort is not producing result. Potential fade or pause.
Bullish - Price prints a lower low while CVD fails to do so. Capitulation lacks initiative. Potential bounce or reversal.
Stats panel
Total CVD - Net initiative over the window.
Buy and Sell volume with percentages - Side composition.
Delta Ratio - Buy over Sell. Values above 1 favor buyers, below 1 favor sellers.
POC Price - Current control node for plan and risk.
Workflows
Trend following
Choose an Anchor Timeframe that matches your holding period.
Trade in the direction of CVD slope while price holds above a bullish POC or below a bearish POC.
Use pullbacks to CVD nodes on your profile as entry locations.
Trend weakens when price makes new highs but CVD stalls, or new lows while CVD recovers.
Mean reversion
Look for divergences at or near prior CVD nodes, especially the POC.
Fade tests into thick wings when the side that dominated there now fails to push CVD further.
Target rotations back toward the POC or the opposite wing edge.
Liquidity and execution map
Treat strong wings and heatmap bands as probable passive interest zones.
Expect pauses, partial fills, or flips at these shelves.
Stops make sense beyond the far edge of the active wing supporting your idea.
Alerts included
CVD Bearish Divergence and CVD Bullish Divergence.
Price Cross Above POC and Price Cross Below POC.
Extreme Buy Imbalance and Extreme Sell Imbalance from Delta Ratio.
CVD Turn Bullish and CVD Turn Bearish when net CVD crosses zero.
Price Near POC proximity alert.
Best practices
Use a higher Anchor Timeframe to stabilize the CVD story and a sensible Profile Granularity so wings are readable without clutter.
Keep Split mode on when you want to separate initiative attribution. Turn it off when you prefer a single net profile.
Tune Pivot Left and Right by instrument to avoid overfitting. Larger values find swing divergences. Smaller values find micro fades.
If volume is thin or synthetic for the symbol, CVD will be less reliable. The script will warn if volume is zero.
Trading applications
Context - Confirm or question breakouts with CVD slope.
Location - Build entries at CVD nodes and POC.
Timing - Use divergence and POC crosses for triggers.
Risk - Place stops beyond the opposite wing or outside the POC shelf.
Important notes and limits
This is a price and volume based study. It does not access off-book or venue-level order flow.
CVD profiles are built from the data available on your chart and the chosen lower timeframe sampling.
Like all volume tools, readings can distort during roll periods, holidays, or feed anomalies. Validate on your instrument.
Technical notes
Delta is aggregated from a lower timeframe into an Anchor Timeframe narrative.
Profile bins update in real time. Splitting by side scales each wing independently so both are readable in the same panel.
Divergences are confirmed using standard pivot definitions with user-set tolerances.
All profile drawing uses fixed X offsets so panels and POC do not swim when you scroll.
Quick start
Anchor Timeframe = Daily for intraday context.
Split Buy and Sell CVD = On.
Profile Granularity = 100 to 200, Profile Position = Right, Width to taste.
Pivot Left and Right around 8 to 12 to start, then adapt.
Turn on Heatmap for a fast map of interest bands.
Bottom line
CVD tells you who is doing the lifting. The profile shows where they did it. Divergences tell you when effort stops paying. Put them together and you get a clear read on control, location, and timing for both trend and mean reversion.
Advanced Chandelier Exit with S/R [Alpha Extract]Advanced Chandelier Exit with S/R is a precision-crafted trailing stop and market structure detection system that fuses advanced Chandelier Exit logic with intelligent, multi-timeframe support and resistance tracking. This indicator delivers adaptive trend detection, volatility-aware exit positioning, and real-time structural mapping in a clean, responsive format. By combining directional filtering, pivot zone detection, and customizable styling, Advanced Chandelier Exit with S/R is designed to give traders reliable context, strong risk management, and visually intuitive confirmation signals across all timeframes and asset classes.
🔶 Adaptive Trailing Stop Architecture
At the core of Advanced Chandelier Exit with S/R is a refined Chandelier Exit mechanism that dynamically calculates trailing stops based on recent highs and lows, ATR volatility, and trend sensitivity. The system features directional memory, anchoring the stop to maintain position until a confirmed trend break occurs. This method prevents premature flips and keeps the trade aligned with sustained momentum.
longStop := close > longStop ? math.max(longStop, longStop ) : longStop
shortStop := close < shortStop ? math.min(shortStop, shortStop ) : shortStop
🔶 Volatility-Weighted Filtering
To reduce noise and improve reaction quality, Advanced Chandelier Exit with S/R includes an optional volatility normalization filter. This system adjusts ATR output based on how elevated it is relative to its own average, effectively down-weighting erratic price moves while maintaining responsiveness in directional phases.
volatilityFilter = enableVolatilityFilter ? ta.sma(baseATR, length) / baseATR : 1.0
atr = mult * baseATR * sensitivity * volatilityFilter
🔶 Trend Strength-Aware State Transitions
Trend flips in Advanced Chandelier Exit with S/R are not based solely on price crossing the stop level. Instead, the system includes a momentum-derived trend strength filter that validates the legitimacy of directional shifts. This guards against weak reversals and gives stronger confidence in breakout moves.
priceChange = math.abs(close - close )
avgPriceChange = ta.sma(priceChange, length)
trendStrength = math.min(priceChange / avgPriceChange * 100, 200)
🔶 Multi-Timeframe Support & Resistance Zones
Advanced Chandelier Exit with S/R embeds a sophisticated pivot-based structure mapping engine that automatically identifies significant price reaction levels and tracks their validity over time. It filters redundant zones, removes invalidated levels, and renders real-time support and resistance overlays based on market structure.
if isUniqueLevel(ph, resistanceLevels)
array.unshift(resistanceLevels, ph)
if isUniqueLevel(pl, supportLevels)
array.unshift(supportLevels, pl)
🔶 Dynamic Visual Encoding
The indicator uses strength-scaled fills, customizable colors, and line styling to convey directional bias with clarity. Color opacity intensifies as trend strength increases, offering intuitive context at a glance. Dynamic background fills mark trend states, while S/R zones are rendered with user-defined transparency for clean integration.
🔶 Signal Detection and Alerts
Directional signals are generated upon confirmed flips between long and short regimes, validated by stop crosses and strength filters. Additionally, the indicator provides S/R breakout alerts, identifying when price breaks through a key structural level.
🔶 Performance and Customization Optimizations
Advanced Chandelier Exit with S/R is built with modularity and efficiency in mind. It supports full customization of stop logic, volatility sensitivity, structural lookback, S/R zone filtering, and visual display. The use of array-based data structures for S/R levels ensures consistent performance even across high-activity assets and longer lookback periods.
Advanced Chandelier Exit with S/R represents the next evolution in trailing stop and structure-aware trading tools. By blending the proven logic of the Chandelier Exit system with intelligent trend strength filters and robust S/R detection, it becomes more than just a stop indicator—it becomes a complete trade management companion. Traders benefit from fewer false flips, clearer directional bias, and precise structural overlays that reinforce both breakout and reversal strategies. Whether used for swing entries, intraday positioning, or zone-based re-entries, Advanced Chandelier Exit with S/R empowers traders with responsive, intelligent logic that adapts to market conditions without compromise.

Aladin Pair Trading System v1Aladin Pair Trading System v1
What is This Indicator?
The Aladin Pair Trading System is a sophisticated tool designed to help traders identify profitable opportunities by comparing two related stocks that historically move together. Think of it as finding when one twin is running ahead or lagging behind the other - these moments often present trading opportunities as they tend to return to moving together.
Who Should Use This?
Beginners: Learn about statistical arbitrage and pair trading
Intermediate Traders: Execute mean-reversion strategies with confidence
Advanced Traders: Fine-tune parameters for optimal pair relationships
Portfolio Managers: Implement market-neutral strategies
💡 What is Pair Trading?
Imagine two ice cream shops next to each other. They usually have similar customer traffic because they're in the same area. If one day Shop A is packed while Shop B is empty, you might expect this imbalance to correct itself soon.
Pair trading works the same way:
You find two stocks that normally move together (like TCS and Infosys)
When one stock moves too far from the other, you trade expecting them to realign
You buy the lagging stock and sell the leading stock
When they come back together, you profit from both sides
Key Features
1. Z-Score Analysis
What it is: A statistical measure showing how far the price relationship has deviated from normal
What it means:
Z-Score near 0 = Normal relationship
Z-Score at +2 = Stock A is expensive relative to Stock B (Sell A, Buy B)
Z-Score at -2 = Stock A is cheap relative to Stock B (Buy A, Sell B)
2. Multiple Timeframe Analysis
Long-term Z-Score (300 bars): Shows the big picture trend
Short-term Z-Score (100 bars): Shows recent movements
Signal Z-Score (20 bars): Generates quick trading signals
3. Statistical Validation
The indicator checks if the pair is suitable for trading:
Correlation (must be > 0.7): Confirms the stocks move together
1.0 = Perfect positive correlation
0.7 = Strong correlation
Below 0.7 = Warning: pair may not be reliable
ADF P-Value (should be < 0.05): Tests if the relationship is stable
Low value = Good for pair trading
High value = Relationship may be random
Cointegration: Confirms long-term equilibrium relationship
YES = Pair tends to revert to mean
NO = Pair may drift apart permanently
Visual Elements Explained
Chart Zones (Color-Coded Areas)
Yellow Zone (-1.5 to +1.5)
Normal Zone: Relationship is stable
Action: Wait for better opportunities
Blue Zone (±1.5 to ±2.0)
Entry Zone: Deviation is significant
Action: Prepare for potential trades
Green/Red Zone (±2.0 to ±3.0)
Opportunity Zone: Strong deviation
Action: High-probability trade setups
Beyond ±3.0
Risk Limit: Extreme deviation
Action: Either maximum opportunity or structural break
Signal Arrows
Green Arrow Up (Buy A + Sell B):
Stock A is undervalued relative to B
Buy Stock A, Short Stock B
Red Arrow Down (Sell A + Buy B):
Stock A is overvalued relative to B
Sell Stock A, Buy Stock B
Settings Guide
Symbol Inputs
Pair Symbol (Symbol B): Choose the second stock to compare
Default: NSE:INFY (Infosys)
Example pairs: TCS/INFY, HDFCBANK/ICICIBANK, RELIANCE/ONGC
Z-Score Parameters
Long Z-Score Period (300): Historical context
Short Z-Score Period (100): Recent trend
Signal Period (20): Trading signals
Z-Score Threshold (2.0): Entry trigger level
Higher = Fewer but stronger signals
Lower = More frequent signals
Statistical Parameters
Correlation Period (240): How many bars to check correlation
Hurst Exponent Period (50): Measures mean-reversion tendency
Probability Lookback (100): Historical probability calculations
Trading Parameters
Entry Threshold (0.0): Minimum Z-score for entry
Risk Threshold (1.5): Warning level
Risk Limit (3.0): Maximum deviation to trade
How to Use (Step-by-Step)
Step 1: Choose Your Pair
Add the indicator to your chart (this becomes Stock A)
In settings, select Stock B (the comparison stock)
Choose stocks from the same sector for best results
Step 2: Verify Pair Quality
Check the Statistics Table (top-right corner):
✅ Correlation > 0.70 (Green = Good)
✅ ADF P-value < 0.05 (Green = Good)
✅ Cointegrated = YES (Green = Good)
If all three are green, the pair is suitable for trading!
Step 3: Wait for Signals
BUY SIGNAL (Green Arrow Up)
Z-Score crosses above -2.0
Action: Buy Stock A, Sell Stock B
Exit: When Z-Score returns to 0
SELL SIGNAL (Red Arrow Down)
Z-Score crosses below +2.0
Action: Sell Stock A, Buy Stock B
Exit: When Z-Score returns to 0
Step 4: Risk Management
Yellow Zone: Monitor only
Blue Zone: Prepare for entry
Green/Red Zone: Active trading zone
Beyond ±3.0: Maximum risk - use caution
⚠️ Important Warnings
Not All Pairs Work: Always check the statistics table first
Market Conditions Matter: Correlation can break during market stress
Use Stop Losses: Set stops at Z-Score ±3.5 or beyond
Position Sizing: Trade both legs with appropriate hedge ratios
Transaction Costs: Factor in brokerage and slippage for both stocks
Example Trade
Scenario: TCS vs INFOSYS
Correlation: 0.85 ✅
Z-Score: -2.3 (TCS is cheap vs INFY)
Action to be taken:
Buy 1lot of TCS Future
Sell 1lot of INFOSYS Future
Expected Outcome:
As Z-Score moves toward 0, TCS outperforms INFOSYS
Close both positions when Z-Score crosses 0
Profit from the convergence
Best Practices
Test Before Trading: Use paper trading first
Sector Focus: Choose pairs from the same industry
Monitor Statistics: Check correlation daily
Avoid News Events: Don't trade pairs during earnings/major news
Size Appropriately: Start small, scale with experience
Be Patient: Wait for high-quality setups (±2.0 or beyond)
What Makes This Indicator Unique?
Multi-timeframe Z-Score analysis: Three different perspectives
Statistical validation: Built-in correlation and cointegration tests
Visual risk zones: Easy-to-understand color-coded areas
Real-time statistics: Live pair quality monitoring
Beginner-friendly: Clear signals with educational zones
Technical Background
The indicator uses:
Engle-Granger Cointegration Test: Validates pair relationship
ADF (Augmented Dickey-Fuller) Test: Tests stationarity
Pearson Correlation: Measures linear relationship
Z-Score Normalization: Standardizes deviations
Log Returns: Handles price differences properly
Support & Community
For questions, suggestions, or to share your pair trading experiences:
Comment below the indicator
Share your successful pair combinations
Report any issues for quick fixes
Disclaimer
This indicator is for educational and informational purposes only. It does not constitute financial advice. Pair trading involves risk, including the risk of loss.
Always:
Do your own research
Understand the risks
Trade with money you can afford to lose
Consider consulting a financial advisor
📌 Quick Reference Card
Z-ScoreInterpretationAction-3.0 to -2.0A very cheap vs BStrong Buy A, Sell B-2.0 to -1.5A cheap vs BBuy A, Sell B-1.5 to +1.5Normal rangeHold/Wait+1.5 to +2.0A expensive vs BSell A, Buy B+2.0 to +3.0A very expensive vs BStrong Sell A, Buy B
Good Pair Statistics:
Correlation: > 0.70
ADF P-value: < 0.05
Cointegration: YES
Version: 1.0
Last Updated: 10th October 2025
Compatible: TradingView Pine Script v6
Happy Trading!

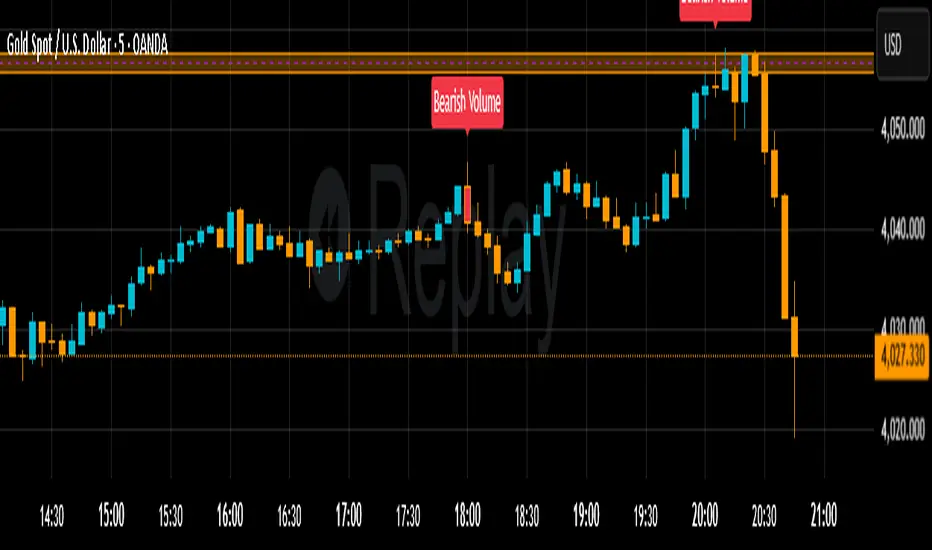
Volume Reversal Candle✅ This script is clean and fully functional — it highlights volume-based reversal zones using both color and labels directly on the main chart.
This indicator detect potential reversal points where price forms a local high/low together with a volume spike.
Reversal Zone:
Bullish = candle closes green, is at local lowest low.
Bearish = candle closes red, is at local highest high.
🔔 Alerts
You can set TradingView alerts using:
📈 Bullish Volume Reversal
📉 Bearish Volume Reversal
They’ll trigger when such reversals occur on bar close.
💡 Visuals on Chart
Candle color: Green (bullish) / Red (bearish) when reversal detected.
Text labels: “Bullish Volume” or “Bearish Volume.”
Marker arrows: ▲ for bulls below bar, ▼ for bears above bar.
Everything appears on the main chart, not in a separate pane.
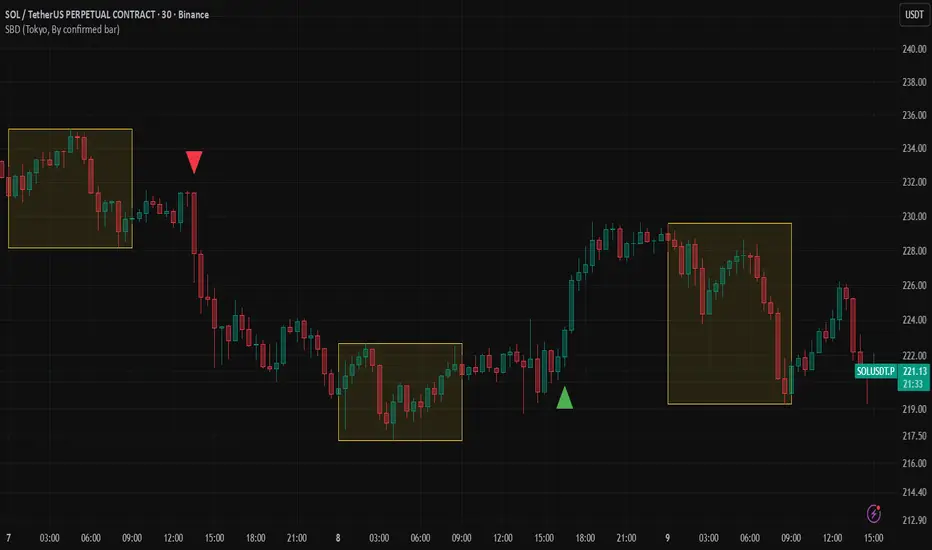
Session Breakout Detector (SBD)Overview:
The Session Breakout Detector (SBD) is a TradingView indicator designed to identify and visualize breakouts from major trading sessions. It tracks a selected session (Tokyo, London, or New York) and detects price movements beyond the session's high or low, assisting traders in spotting potential breakout opportunities.
Key Features:
- Session Selection: Choose between Tokyo, London, or New York sessions.
- Breakout Detection Modes:
- Confirmed Bar: Detects breakouts when a candle closes beyond the session's range.
- Intrabar: Detects breakouts as soon as the price exceeds the session's high or low within a
candle.
- Visual Indicators:
- Displays session high, low, and range with a colored box for clear visualization.
- Marks breakouts with green (bullish) or red (bearish) triangles.
- Optional 50-Period SMA: Adds a 50-period Simple Moving Average to the chart for trend
analysis.
- Alerts: Configurable alerts for bullish and bearish breakouts.
Usage Instructions:
1. Select Session: Choose the desired trading session (Tokyo, London, or New York) from the
input settings.
2. Choose Breakout Detection Mode: Select between 'By confirmed bar' or 'By intrabars' based
on your trading preference.
3. Enable SMA (Optional): Toggle the 'Use SMA?' option to display the 50-period Simple Moving
Average.
4. Set Alerts: Configure alerts for breakout signals as per your trading strategy.
⚠️Note: This indicator is intended for informational purposes only and should not be construed as financial advice. Users are encouraged to conduct their own research and consider their individual risk tolerance before making trading decisions.
FVG Zones with Signals█ OVERVIEW
"FVG Zones with Signals" is a technical analysis tool that identifies Fair Value Gaps (FVG) on the chart and draws customizable zones in the form of boxes. It is ideal for traders using price action and market structure strategies, helping to identify potential imbalance zones and trading opportunities based on breakout and exit signals. With flexible size filter settings, box styles, and signal options, the indicator ensures clarity and precision on the chart.
█ CONCEPTS
The indicator is designed to identify potential entry points for trades based on FVG breakouts or retests. For chart clarity, a size filter for FVGs is included, based on a multiplier of the average candle size over a specified period.
Why are FVGs important? FVG zones represent areas of market imbalance, often attracting price back to "fill" the gap. Larger gaps (with a higher size multiplier) have a greater chance of being retested, as they indicate deeper imbalances—leaving more unexecuted orders in those zones, which attracts liquidity. Market makers and institutions often return to these levels to "refresh" liquidity before further moves. However, not every large FVG is retested quickly—in strong trends, smaller imbalances may be ignored, and the location (e.g., near swing highs/lows) is critical for retest probability.
█ FEATURES
- FVG Detection: Identifies bullish and bearish FVGs based on size filters (Candle Size Period and FVG Size Multiplier), with automatic initialization of historical gaps up to 500 candles back.
- Customizable Boxes: Draws FVG boxes with adjustable border colors, background gradients, border styles (solid, dashed, dotted), border widths, and transparency for both the background and the 50% FVG midline.
- Breakout and Exit Signals: Generates "Break" signals (green upward triangle for breakouts above bearish FVG, red downward triangle for breakouts below bullish FVG) and "Exit" signals (circles for exiting the zone), with options to select signal types (Break, Exit, or Both). A break signal causes the box to disappear, leaving a triangle as a trace of the breakout, which may serve as a signal to open a position. Exit signals (circles) may also indicate entry opportunities but require additional confirmation, such as alignment with the main trend.
- Midline: Automatically draws a dashed line at the 50% FVG level with adjustable transparency, aiding in assessing price reactions within the zone.
- Box Limitation: Automatically removes old or inactive FVGs after 500 candles to avoid chart clutter.
- Alerts: Built-in alerts for all signal types, including price and FVG type descriptions.
█ HOW TO USE
Add to Chart: Apply the indicator to your TradingView chart via the Pine Editor or Indicators menu.
Configure Settings:
- FVG Settings: Adjust Candle Size Period (default 20) and FVG Size Multiplier (default 1) to filter out small gaps—higher values generate fewer but more significant FVGs.
- Box Settings: Configure colors and styles for bullish (green) and bearish (red) boxes, including background transparency (default 80) and midline transparency.
- Signal Settings: Select signal types (Break, Exit, or Both) in Signal Type. Breakout signals appear after a candle closes outside the zone, while exit signals appear when exiting an FVG without a full breakout.
- Styling: Customize signal colors (green for buy/up, red for sell/down) and shape sizes.
Interpreting Signals:
- Break Up Signal: A green triangle below the bar indicates a breakout above a bearish FVG, suggesting potential continuation of an uptrend.
- Break Down Signal: A red triangle above the bar indicates a breakout below a bullish FVG, suggesting potential continuation of a downtrend.
- Exit Up/Down Signal: A green/red circle indicates an exit from an FVG without a full breakout, which may signal the end of a correction or preparation for a reversal.
- FVG Zones: If the price returns to an FVG and fills the gap, it may indicate equilibrium; an unfilled gap often leads to a retest.
- Use signals in conjunction with other technical analysis tools for confirmation, such as RSI (to identify overbought/oversold conditions) or MACD (to confirm momentum). Analyze FVGs from higher timeframes—these zones act as stronger imbalance levels and carry greater structural significance.
Exit signals (retests without breakouts) tend to be most effective when traded in line with the current trend.
█ APPLICATIONS
- Price Action Trading: Use FVG zones as dynamic support and resistance levels. In an uptrend, look for buying opportunities in bullish FVGs, where price often tests the gap before continuing. Combining with RSI, MACD, or Fibonacci levels enhances the significance of zones.
- Breakout Strategies: Trade based on breakout signals from FVGs. A buy signal after breaking a bearish FVG may indicate a strong upward impulse, especially when supported by a rising MACD or RSI exiting oversold conditions.
Larger FVG gaps (higher multiplier) have a greater chance of retest, as they indicate deeper imbalances.
█ NOTES
- Test the indicator across different timeframes and markets (stocks, forex, crypto) to optimize size filters for your trading style.
- The indicator initializes historical FVGs up to 500 candles back, which may slow loading on longer charts.
- For best results, use on high-liquidity markets where FVGs are more frequently retested.
- In consolidation zones, the indicator may generate more false signals, so additional confirmation is recommended.

Price Trendlines + Break Signals█ OVERVIEW
The "Price Trendlines + Break Signals" indicator is a technical analysis tool that automatically draws trendlines based on price pivot points and detects breakout signals. Designed for traders seeking precise market signals, the indicator identifies key pivot points, draws trendlines (resistance and support), and generates breakout signals with background highlighting. It offers flexible settings and alerts for breakout signals.
█ CONCEPTS
The indicator was created to provide traders with an alternative source of signals based on trendlines. Breakouts and bounces from trendlines can signal a trend change or the end of a correction. Combining these signals with other technical analysis tools can form the basis for building diverse trading strategies.
█ FEATURES
-Pivot Point Calculation: The indicator identifies pivot points (pivot high and pivot low) based on the closing price, with configurable left and right bars for pivot detection. Setting a higher number of bars results in fewer but more significant trendlines, with a delay corresponding to the specified length. Lower values generate more trendlines, but they are less significant. Crossovers are signaled only after the trendline is drawn, so sometimes no signals appear on crossed trendlines—this indicates the price passed through the line before it was detected.
- Trendlines: Draws trendlines connecting price pivot points—upper lines for downtrends (resistance) and lower lines for uptrends (support). Lines can be extended by a specified number of bars (default: 50).
- Tolerance Margin: Trendlines are widened by a tolerance margin, calculated using the average candle body size over a specified period and its multiplier. Reducing the multiplier to zero leaves only the trendline without a margin. Breaking this zone is a condition for generating signals.
- Breakout Signals: Generates signals when the price breaks through a trendline (bullish for upper lines, bearish for lower lines), with background highlighting for signal confirmation.
Alerts: Built-in alerts for:
- Upper trendline breakout (bullish signal).
- Lower trendline breakout (bearish signal).
Customization: Allows adjustment of pivot parameters, trendline extension length, tolerance margin, line colors, fills, and signal background transparency.
█ HOW TO USE
Adding the Indicator: Add the indicator to your TradingView chart via the Pine Editor or Indicators menu.
Configuring Settings:
- Left Bars for Pivot: Number of bars back for detecting pivots (default: 10).
- Right Bars for Pivot: Number of bars forward to confirm pivots (default: 10).
- Extend past 2nd pivot: Number of bars to extend the trendline after the second pivot (default: 50, 0 = no extension).
- Average Body Periods: Period for calculating the average candle body size used for the tolerance margin (default: 100).
- Tolerance Multiplier: Multiplier for the tolerance margin based on the average candle body size (default: 1.0).
Colors and Style:
- Upper trendline (resistance): default red.
- Lower trendline (support): default green.
- Line fills: colors with transparency (default 70).
- Signal background: green for bullish signals, red for bearish signals (default transparency 85).
Interpreting Signals:
- Trendlines: Upper lines (red) indicate a downtrend, lower lines (green) indicate an uptrend. Signals appear after a trendline breakout with the tolerance margin. Each trendline generates only one breakout signal, though it may still act as resistance or support for the price.
- Breakout Signals: Green background indicates an upper trendline breakout (bullish), red background indicates a lower trendline breakout (bearish).
- Alerts: Set up alerts in TradingView for trendline breakout signals.
Combining with Other Tools: Use with support/resistance levels, Fibonacci levels, RSI, pivot points, or FVG (Fair Value Gap) for signal confirmation.
█ APPLICATIONS
The "Price Trendlines + Break Signals" indicator is designed to identify trends and potential reversal points, supporting both trend-following and contrarian strategies:
- Trend Confirmation: Trendlines indicate the direction of the price trend, and bounces from them may signal the end of a correction.
- Reversal Strategies: Breakout signals can be used as cues to enter positions in anticipation of a trend change or correction.
- Noise Filtering: The tolerance margin reduces false signals, enhancing reliability.
█ NOTES
- Trendline crossovers are signaled only after the trendline is drawn, so sometimes no signals appear on crossed trendlines—this indicates the price passed through the line before it was detected.
- Each trendline generates only one breakout signal, though it may still act as a level of support or resistance for the price.
- Setting a higher number of bars for pivots results in fewer but more significant trendlines, with a delay corresponding to the specified length. Lower values generate more trendlines, but they are less significant.
- Adjust settings (e.g., number of bars for pivots, tolerance multiplier) to suit your trading style and timeframe.
- Combine with other technical analysis tools, such as RSI, pivot points, or FVG, to enhance signal accuracy.
- For high-volatility markets, consider increasing the tolerance margin to reduce false signals.

Smart Money Toolkit - PD Engine Bias Map [KedArc Quant]📄 Description
Smart Money Toolkit is an advanced multi-layer Smart Money Concepts framework that automatically detects structure shifts, premium-discount zones, and institutional order flow.
It’s built around the PD Engine, which calculates the midpoint of the most recent market swing and dynamically determines BUY or SELL bias based on where current price trades relative to that equilibrium. This toolkit visualizes structure, order blocks, and bias context in one clean map — giving traders an institutional-grade lens without signal clutter.
💡 Why It’s Unique
* Not a mashup of open-source scripts.
Every module — CHoCH/BOS logic, order-block zone detection, PD bias engine, and structure mapping — is written from scratch to ensure clean, consistent behavior in Pine Script v6.
* Bias engine with true equilibrium logic: The 50% PD (Premium-Discount) zone adapts in real time to the latest swing, giving a live institutional price map.
* Visual precision: Minimalist premium/discount shading, structured labeling (HH, HL, LH, LL, CHoCH), and context tables for clarity.
* Performance-optimized: Handles multiple visual layers (FVG, OB, CHoCH, BOS) efficiently without repainting.
🎯 Entry and Exit Logic (Discretionary Framework)
This toolkit is not a signal generator; it’s a contextual trading framework that guides your decisions.
BUY Bias (Discount Zone)
* Price trades below PD Mid → Market is in *discount*.
* Wait for a bullish CHoCH or rejection from demand OB/FVG before entering long.
* Target 1 = PD Mid; Target 2 = next opposing OB/FVG.
SELL Bias (Premium Zone)
* Price trades above PD Mid → Market is in *premium*.
* Wait for a bearish CHoCH or rejection from supply OB/FVG before shorting.
* Target 1 = PD Mid; Target 2 = next opposing OB/FVG.
This sequence enforces the institutional concept:
> Bias → Structure Shift → Confirmation → Execution
⚙️ Input Configuration
Setting Description
Swing Sensitivity Controls how far back to look for HH/LL pivots.
OB/FVG Detection Enable or disable visual order block or fair-value-gap zones.
PD Engine Toggles PD midpoint line, zone shading, and bias table.
Multi-TF Bias Sync Optionally reads higher-time-frame bias to confirm entries.
Color Themes Switch between Light / Dark / Institutional color sets.
All inputs are modular — you can show only the components you use (e.g., disable BOS/CHoCH labels or hide OB zones for a clean view).
🧮 Formula / Logic Summary
Concept Formula
PD Mid (Equilibrium) `(Recent Swing High + Recent Swing Low) / 2`
BUY Bias `close < PD Mid`
SELL Bias `close > PD Mid`
CHoCH / BOS Detected via pivot-based structure reversal: HH→LL or LL→HH
Order Block Last bullish/bearish candle before displacement.
Fair Value Gap (FVG) Gap between prior candle’s high/low and next candle’s range.
These formulas align with Smart Money Concepts taught in institutional trading frameworks.
🤝 How It Helps Traders
* Institutional Context: Instantly visualize premium vs. discount regions — see where smart money is likely accumulating or distributing.
* Bias Confidence: Removes guesswork — you know whether you should be a buyer or seller based on structure + PD bias.
* Cleaner Decision-Making: Combines all SMC elements (BOS, CHoCH, OB, FVG, PD) in one cohesive visual map.
* Timeframe Agnostic: Works seamlessly on any timeframe or instrument (Forex, Indices, Crypto, Equities).
📚 Glossary
PD Mid (Equilibrium) The midpoint between recent swing high and low — the market’s fair
value.
Premium Zone Price above PD Mid — sellers gain control.
Discount Zone Price below PD Mid — buyers gain control.
CHoCH (Change of Character) First structural signal of possible reversal.
BOS (Break of Structure) Continuation signal confirming trend direction.
OB (Order Block) Institutional candle marking accumulation/distribution.
FVG (Fair Value Gap) Imbalance zone where price moved too quickly — often
rebalanced.
❓ FAQ
Q: Is this a signal generator?
A: No — it’s a contextual framework for professional price-action trading.
Q: Does it repaint?
A: No. All structure points and bias logic are confirmed on bar close.
Q: Can it be used on any market or timeframe?
A: Yes. It’s structure-based, not instrument-specific.
Q: How often does bias change?
A: Only when a new swing high/low forms and PD recalculates — keeping the bias stable.
Q: Can I backtest it?
A: You can build an entry rule (e.g., CHoCH + OB + PD alignment) on top of it for strategy testing.
⚠️ Disclaimer
This script is provided for educational purposes only.
Past performance does not guarantee future results.
Trading involves risk, and users should exercise caution and use proper risk management when applying this strategy.

MTF Market Bias+ (Smart Multi-Timeframe Trend Dashboard)The MTF Market Bias+ indicator provides a clear, data-driven view of market direction across multiple timeframes — from scalper to swing trader level.
It automatically calculates the bullish / bearish / neutral bias for each selected timeframe using various configurable methods such as EMA slope, price vs EMA, or EMA50 vs EMA200.
This tool gives you an instant overview of market alignment and helps you identify when lower and higher timeframes are in sync — the most powerful condition for high-probability trades.
🔍 Core Features
✅ Multi-Timeframe Bias Dashboard: Visual table showing bullish/bearish sentiment across your chosen timeframes (from 3m to 1W).
⚙️ Customizable Methods: Choose between
EMA Slope (default) → detects trend direction by EMA momentum
Price vs EMA → shows short-term strength or weakness
EMA50 vs EMA200 → classic golden cross vs death cross structure
🎨 Configurable Colors, Size & Layout: Adjust background, text, and label sizes for any chart style.
📊 Summary Row: Displays the majority trend (bullish, bearish, or neutral) with real-time score.
🧩 Adaptive Background Mode (optional): Automatically colors your chart background according to overall bias.
💡 Method Info Panel: Clearly shows which method and parameters are active (e.g. “EMA Slope | EMA=50”).
📈 How to Use
Add the indicator to your chart.
Select the timeframes you want to monitor (e.g. 3m, 5m, 15m, 1h, 4h, D, W).
Watch for alignment between lower and higher timeframes:
When all turn green → strong bullish alignment → consider longs.
When all turn red → strong bearish alignment → consider shorts.
Mixed colors indicate consolidation or correction phases.
Combine it with your favorite Fair Value Gap, CHOCH/BOS, or Liquidity Sweep strategy to significantly improve trade timing and confidence.
🧩 Author’s Note
This indicator is designed for traders who want fast, visual confirmation of multi-timeframe structure without cluttering their charts.
It’s simple, lightweight, and highly adaptable — whether you’re scalping on 3-minute charts or swing trading daily candles.

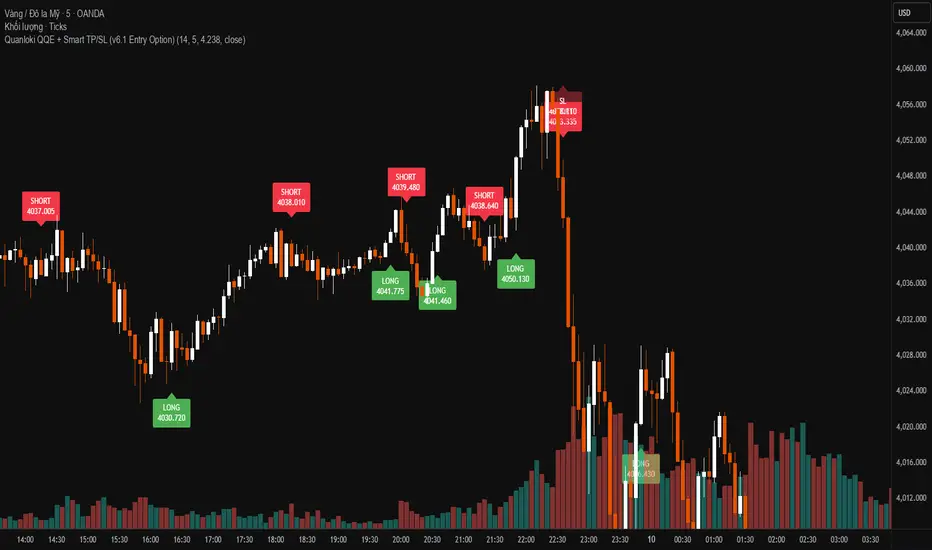
Quanloki QQE + Smart TP/SL (v6.1 Entry Option)Version v6.1 has more complete functions. You can choose open next to enter prices faster. For any information about orders or indicators, you can contact tele @Quanloki for instructions and refunds.
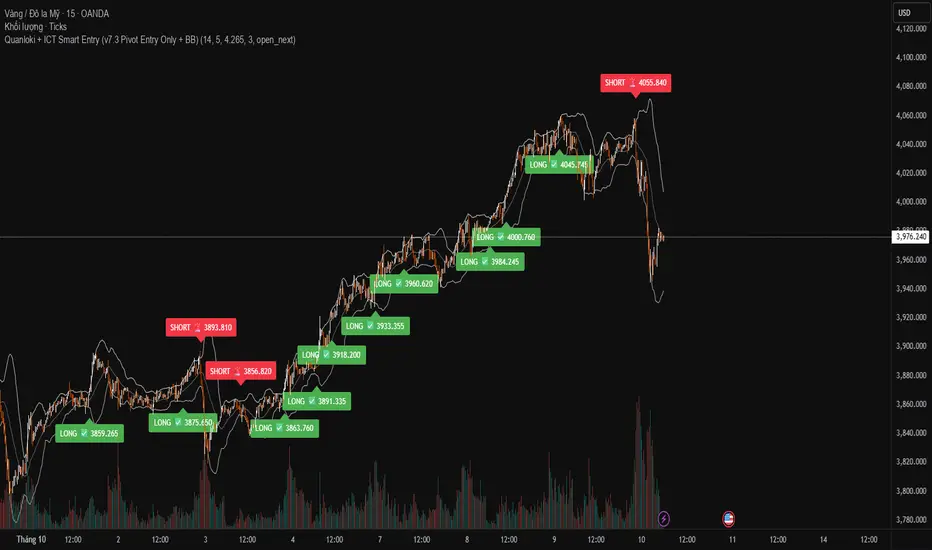
Quanloki + ICT Smart Entry (v7.3 Pivot Entry Only + BB)If you need a signal group or team, please contact @quanloki or tele to get support and refund for the VIP group.
TradeScope: MA Reversion • RVOL • Trendlines • GAPs • TableTradeScope is an all-in-one technical analysis suite that brings together price action, momentum, volume dynamics, and trend structure into one cohesive and fully customizable indicator.
An advanced, modular trading suite that combines moving averages, reversion signals, RSI/CCI momentum, relative volume, gap detection, trendline analysis, and dynamic tables — all within one powerful dashboard.
Perfect for swing traders, intraday traders, and analysts who want to read price strength, volume context, and market structure in real time.
⚙️ Core Components & Inputs
🧮 Moving Average Settings
Moving Average Type & Length:
Choose between SMA or EMA and set your preferred period for smoother or more reactive trend tracking.
Multi-MA Plotting:
Up to 8 customizable moving averages (each with independent type, color, and length).
Includes a “window filter” to show only the last X bars, reducing chart clutter.
MA Reversion Engine:
Detects when price has extended too far from its moving average.
Reversion Lookback: Number of bars analyzed to determine historical extremes.
Reversion Threshold: Sensitivity multiplier—lower = more frequent signals, higher = stricter triggers.
🔄 Trend Settings
Short-Term & Long-Term Trend Lookbacks:
Uses linear regression to detect the slope and direction of the short- and long-term trend.
Results are displayed in the live table with color-coded bias:
🟩 Bullish | 🟥 Bearish
📈 Momentum Indicators
RSI (Relative Strength Index):
Adjustable period; displays the current RSI value, overbought (>70) / oversold (<30) zones, and trending direction.
CCI (Commodity Channel Index):
Customizable length with color-coded bias:
🟩 Oversold (< -100), 🟥 Overbought (> 100).
Tooltip shows whether the CCI is trending up or down.
📊 Volume Analysis
Relative Volume (RVOL):
Estimates end-of-day projected volume using intraday progress and compares it against the 20-day average.
Displays whether today’s volume is expected to exceed yesterday’s, and highlights color by strength.
Volume Trend (Short & Long Lookbacks):
Visual cues for whether current volume is above or below short-term and long-term averages.
Estimated Full-Day Volume & Multiplier:
Converts raw volume into “X” multiples (e.g., 2.3X average) for quick interpretation.
🕳️ Gap Detection
Automatically identifies and plots bullish and bearish price gaps within a defined lookback period.
Gap Lookback: Defines how far back to search for gaps.
Gap Line Width / Visibility: Controls the thickness and display of gap lines on chart.
Displays the closest open gap in the live table, including its distance from current price (%).
🔍 ATR & Volatility
14-day ATR (% of price):
Automatically converts the Average True Range into a percent, providing quick volatility context:
🟩 Low (<3%) | 🟨 Moderate (3–5%) | 🟥 High (>5%)
💬 Candlestick Pattern Recognition
Auto-detects popular reversal and continuation patterns such as:
Bullish/Bearish Engulfing
Hammer / Hanging Man
Shooting Star / Inverted Hammer
Doji / Harami / Kicking / Marubozu / Morning Star
Each pattern is shown with contextual color coding in the table.
🧱 Pivot Points & Support/Resistance
Optional Pivot High / Pivot Low Labels
Adjustable left/right bar lengths for pivot detection
Theme-aware text and label color options
Automatically drawn diagonal trendlines for both support and resistance
Adjustable line style, color, and thickness
Detects and tracks touches for reliability
Includes breakout alerts (with optional volume confirmation)
🚨 Alerts
MA Cross Alerts:
Triggers when price crosses the fast or slow moving average within a tolerance band (default ±0.3%).
Diagonal Breakout Alerts:
Detects and alerts when price breaks diagonal trendlines.
Volume-Confirmed Alerts:
Filters breakouts where volume exceeds 1.5× the 20-bar average.
🧾 Live Market Table
A fully dynamic table displayed on-chart, customizable via input toggles:
Choose which rows to show (e.g., RSI, ATR, RVOL, Gaps, CCI, Trend, MA info, Diff, Low→Close%).
Choose table position (top-right, bottom-left, etc.) and text size.
Theme selection: Light or Dark
Conditional background colors for instant visual interpretation:
🟩 Bullish or Oversold
🟥 Bearish or Overbought
🟨 Neutral / Moderate
🎯 Practical Uses
✅ Identify confluence setups combining MA reversion, volume expansion, and RSI/CCI extremes.
✅ Track trend bias and gap proximity directly in your dashboard.
✅ Monitor relative volume behavior for intraday strength confirmation.
✅ Automate MA cross or breakout alerts to stay ahead of key price action.
🧠 Ideal For
Swing traders seeking confluence-based setups
Intraday traders monitoring multi-factor bias
Analysts looking for compact market health dashboards
💡 Summary
TradeScope is designed as a single-pane-of-glass market view — combining momentum, trend, volume, structure, and reversion into one clear visual system.
Fully customizable. Fully dynamic.
Use it to see what others miss — clarity, confluence, and confidence in every trade.

MNQ TopStep 50K | Ultra Quality v3.0MNQ TopStep 50K | Ultra Quality v3.0 - Publish Summary
📊 Overview
A professional-grade trading indicator designed specifically for MNQ futures traders using TopStep funded accounts. Combines 7 technical confirmations with 5 advanced safety filters to deliver high-quality trade signals while managing drawdown risk.
🎯 Key Features
Core Signal System
7-Point Confirmation: VWAP, EMA crossovers, 15-min HTF trend, MACD, RSI, ADX, and Volume
Signal Grading: Each signal is rated A+ through D based on 7 quality factors
Quality Threshold: Adjustable minimum grade requirement (A+, A, B, C, D)
Advanced Safety Filters (Customizable)
Mean Reversion Filter - Prevents chasing extended moves beyond VWAP bands
ATR Spike Filter - Avoids trading during extreme volatility events
EMA Spacing Filter - Ensures proper trend separation (optional)
Momentum Filter - Requires consecutive directional bars (optional)
Multi-Timeframe Confirmation - Aligns with 15-min trend (optional)
TopStep Risk Management
Real-time drawdown tracking
Position sizing calculator based on remaining cushion
Daily loss limit monitoring
Consecutive loss protection
Max trades per day limiter
Visual Components
VWAP with 1σ, 2σ, 3σ bands
EMA 9/21 with cloud fill
15-min EMA 50 for HTF trend
Comprehensive metrics dashboard
Risk management panel
Filter status panel
Detailed trade labels with entry, stops, and targets
⚙️ Default Settings (Balanced for Regular Signals)
Technical Indicators
Fast EMA: 9 | Slow EMA: 21 | HTF EMA: 50 (15-min)
MACD: 10/22/9
RSI: 14 period | Thresholds: 52 (buy) / 48 (sell)
ADX: 14 period | Minimum: 20
ATR: 14 period | Stop: 2x | TP1: 2x | TP2: 3x
Volume: 1.2x average required
Session Settings
Default: 9:30 AM - 11:30 AM ET (adjustable)
Avoids first 15 minutes after market open
Customizable trading hours
Safety Filters (Default Configuration)
✅ Mean Reversion: Enabled (2.5σ max from VWAP)
✅ ATR Spike: Enabled (2.0x threshold)
❌ EMA Spacing: Disabled (can enable for quality)
❌ Momentum: Disabled (can enable for quality)
❌ MTF Confirmation: Disabled (can enable for quality)
Risk Controls
Minimum Signal Quality: C (adjustable to A+ for fewer/better signals)
Min Bars Between Signals: 10
Max Trades Per Day: 5
Stop After Consecutive Losses: 2
📈 Expected Performance
With Default Settings:
Signals per week: 10-15 trades
Estimated win rate: 55-60%
Risk-Reward: 1:2 (TP1) and 1:3 (TP2)
With Aggressive Settings (Min Quality = D, All Filters Off):
Signals per week: 20-25 trades
Estimated win rate: 50-55%
With Conservative Settings (Min Quality = A, All Filters On):
Signals per week: 3-5 trades
Estimated win rate: 65-70%
🚀 How to Use
Basic Setup:
Add indicator to MNQ 5-minute chart
Adjust TopStep account settings in inputs
Set your risk per trade percentage (default: 0.5%)
Configure trading session hours
Set minimum signal quality (Start with C for balanced results)
Signal Interpretation:
Green Triangle (BUY): Long signal - all confirmations aligned
Red Triangle (SELL): Short signal - all confirmations aligned
Label Details: Shows entry, stop loss, take profit levels, position size, and signal grade
Signal Grade: A+ = Elite (6-7 points) | A = Strong (5) | B = Good (4) | C = Fair (3)
Dashboard Monitoring:
Top Right: Technical metrics and market conditions
Top Left: Filter status (which filters are passing/blocking)
Bottom Right: TopStep risk metrics and position sizing
⚡ Customization Tips
For More Signals:
Lower "Minimum Signal Quality" to D
Decrease ADX threshold to 18-20
Lower RSI thresholds to 50/50
Reduce Volume multiplier to 1.1x
Disable additional filters
For Higher Quality (Fewer Signals):
Raise "Minimum Signal Quality" to A or A+
Increase ADX threshold to 25-30
Enable all 5 advanced filters
Tighten VWAP distance to 2.0σ
Increase momentum requirement to 3-4 bars
For TopStep Compliance:
Adjust "Max Total Drawdown" and "Daily Loss Limit" to match your account
Update "Already Used Drawdown" daily
Monitor the Risk Panel for cushion remaining
Use recommended contract sizing
🛡️ Risk Disclaimer
IMPORTANT: This indicator is for educational and informational purposes only.
Past performance does not guarantee future results
All trading involves substantial risk of loss
Use proper risk management and position sizing
Test thoroughly in paper trading before live use
The indicator does not guarantee profitable trades
Adjust settings based on your risk tolerance and trading style
Always comply with your broker's and TopStep's rules

Oscillator CandlesticksI've always wondered why we don't use candlesticks for oscillators...then I stopped wondering and made an oscillator with candlesticks.
The following oscillators are available as a proof of concept:
* Consumer Channel Index (CCI)
* Rate of Change (ROC)
* Relative Strength Index (RSI)
* Trend Strength Index (TSI)
You can add a moving average to the ohlc4 value of the oscillator and choose the type of the moving average and whether it should be influenced by volume.

MULTI-CONDITION RSI SIGNAL GENERATOR═══════════════════════════════════════════════
MULTI-CONDITION RSI SIGNAL GENERATOR
═══════════════════════════════════════════════
OVERVIEW:
This indicator generates trading signals based on Relative Strength Index (RSI) movements with multiple confirmation layers designed to filter false signals and identify high-probability reversal opportunities.
═══════════════════════════════════════════════
WHAT MAKES THIS ORIGINAL:
═══════════════════════════════════════════════
Unlike basic RSI indicators that simply plot overbought/oversold crossovers, this system combines FOUR distinct confirmation mechanisms:
1. PERSISTENCE FILTERING - Requires RSI to remain in extreme zones for a minimum duration
2. LOOKBACK VALIDATION - Verifies recent extreme zone visits before signaling
3. DIVERGENCE DETECTION - Identifies price/RSI divergence for stronger signals
4. MOMENTUM CONFIRMATION - Provides trend-continuation entries via midline crosses
This multi-layered approach significantly reduces whipsaw trades that plague simple RSI crossover systems.
═══════════════════════════════════════════════
HOW IT WORKS (TECHNICAL METHODOLOGY):
═══════════════════════════════════════════════
STEP 1: RSI CALCULATION
- Standard RSI calculation using user-defined period (default: 14)
- Monitors two extreme zones: Overbought (default: 70) and Oversold (default: 30)
STEP 2: PERSISTENCE FILTERING
The script counts how many bars RSI has spent in extreme zones within the lookback period:
- For overbought signals: Counts bars where RSI > 70
- For oversold signals: Counts bars where RSI < 30
- Signal only triggers if count >= Minimum Duration (default: 4 bars)
This filters out brief spikes that immediately reverse, focusing on sustained extreme conditions that are more likely to lead to genuine reversals.
STEP 3: LOOKBACK VALIDATION
- Checks if RSI reached extreme zones within the Lookback Bars period (default: 20)
- Uses ta.highest() and ta.lowest() functions to verify recent extremes
- Ensures we're trading reversals from meaningful extremes, not random crossovers
STEP 4: BASIC SIGNAL GENERATION
- BUY SIGNAL: RSI crosses above the oversold level (30) after meeting persistence and lookback conditions
- SELL SIGNAL: RSI crosses below the overbought level (70) after meeting persistence and lookback conditions
STEP 5: DIVERGENCE DETECTION
The script identifies two types of divergence over the Divergence Lookback period (default: 5 bars):
A) BULLISH DIVERGENCE (indicates potential upward reversal):
- Price makes a lower low (current low < previous low)
- RSI makes a higher low (current RSI low > previous RSI low)
- Suggests weakening downward momentum
B) BEARISH DIVERGENCE (indicates potential downward reversal):
- Price makes a higher high (current high > previous high)
- RSI makes a lower high (current RSI high < previous RSI high)
- Suggests weakening upward momentum
STEP 6: STRONG SIGNAL CONFIRMATION
- STRONG BUY: Basic buy signal + bullish divergence present
- STRONG SELL: Basic sell signal + bearish divergence present
- These represent the highest-probability setups
STEP 7: MOMENTUM SIGNALS (OPTIONAL)
- MOMENTUM BUY: RSI crosses above 50 after being oversold (trend continuation)
- MOMENTUM SELL: RSI crosses below 50 after being overbought (trend continuation)
- Smaller signals for traders who want trend-following entries
═══════════════════════════════════════════════
SIGNAL TYPES AND VISUAL INDICATORS:
═══════════════════════════════════════════════
📈 GREEN TRIANGLE (below bar) - Standard Buy Signal
RSI crossed above oversold level with confirmation filters
📉 RED TRIANGLE (above bar) - Standard Sell Signal
RSI crossed below overbought level with confirmation filters
🔵 BLUE TRIANGLE (below bar) - Strong Buy Signal
Buy signal + bullish divergence (HIGHEST PRIORITY)
🟣 PURPLE TRIANGLE (above bar) - Strong Sell Signal
Sell signal + bearish divergence (HIGHEST PRIORITY)
🟢 GREEN CIRCLE (small) - Momentum Buy
RSI crosses above 50 after oversold conditions
🔴 RED CIRCLE (small) - Momentum Sell
RSI crosses below 50 after overbought conditions
BACKGROUND SHADING:
- Light red background: RSI currently overbought
- Light green background: RSI currently oversold
═══════════════════════════════════════════════
PARAMETER SETTINGS:
═══════════════════════════════════════════════
1. OVERBOUGHT LEVEL (default: 70, range: 50-90)
- Higher values = fewer but stronger overbought signals
- Lower values = more sensitive to overbought conditions
- Recommended: 70 for standard markets, 80 for crypto/volatile assets
2. OVERSOLD LEVEL (default: 30, range: 10-50)
- Lower values = fewer but stronger oversold signals
- Higher values = more sensitive to oversold conditions
- Recommended: 30 for standard markets, 20 for crypto/volatile assets
3. RSI PERIOD (default: 14, range: 2-50)
- Standard RSI calculation period
- Lower = more sensitive/faster signals
- Higher = smoother/slower signals
- Recommended: 14 (industry standard)
4. MINIMUM DURATION (default: 4, range: 1-20)
- Required bars in extreme zone before signal
- Higher values = fewer signals but better quality
- Lower values = more signals but more false positives
- Recommended: 3-5 for day trading, 5-10 for swing trading
5. LOOKBACK BARS (default: 20, range: 5-100)
- How far back to check for extreme zone visits
- Should match your typical trading timeframe
- Recommended: 20 for intraday, 50 for daily charts
6. DIVERGENCE LOOKBACK (default: 5, range: 2-20)
- Period for comparing price/RSI highs and lows
- Lower values = more frequent divergence signals
- Higher values = more significant divergences
- Recommended: 5-10 depending on timeframe
═══════════════════════════════════════════════
HOW TO USE THIS INDICATOR:
═══════════════════════════════════════════════
RECOMMENDED TRADING APPROACH:
1. PRIMARY ENTRIES: Focus on Strong Buy/Sell signals (blue/purple triangles)
- These have the highest win rate due to divergence confirmation
- Wait for price action confirmation (support/resistance, candlestick patterns)
2. SECONDARY ENTRIES: Regular Buy/Sell signals (green/red triangles)
- Use these when Strong signals are infrequent
- Require additional confirmation from other indicators or chart patterns
3. TREND CONTINUATION: Momentum signals (small circles)
- Best used when overall trend is clear
- Not recommended for reversal trading
4. FILTER TRADES: Use background shading as context
- Be cautious entering longs when background is red (overbought)
- Be cautious entering shorts when background is green (oversold)
RISK MANAGEMENT GUIDELINES:
- Never risk more than 2-5% of capital per trade
- Use stop losses below recent swing lows (buys) or above swing highs (sells)
- Target at least 1.5:1 reward-to-risk ratio
- Consider position sizing based on signal strength
TIMEFRAME RECOMMENDATIONS:
- 15min - 1hour: Day trading with adjusted parameters (lower minimum duration)
- 4hour - Daily: Swing trading with default parameters
- Weekly: Position trading with increased lookback periods
COMPLEMENTARY TOOLS:
This indicator works best when combined with:
- Support and resistance levels
- Trend indicators (moving averages, trend lines)
- Volume analysis
- Price action patterns (engulfing candles, pin bars)
═══════════════════════════════════════════════
LIMITATIONS AND CONSIDERATIONS:
═══════════════════════════════════════════════
- This is NOT a standalone trading system - requires additional analysis
- RSI-based strategies perform best in ranging/choppy markets
- May generate fewer signals in strong trending markets
- Divergence signals can be early - wait for price confirmation
- Not recommended for highly illiquid assets
- Backtest on your specific market before live trading
- No indicator is 100% accurate - always use proper risk management
═══════════════════════════════════════════════
TECHNICAL NOTES:
═══════════════════════════════════════════════
- Code is original and does not reuse external libraries
- Uses Pine Script v5 native functions only
- Alert conditions included for all signal types
- No repainting - signals appear and remain fixed
- Efficient calculation methods minimize processing load
═══════════════════════════════════════════════
ALERT SETUP:
═══════════════════════════════════════════════
Four alert conditions are available:
1. "Buy Alert" - Triggers on standard buy signals
2. "Sell Alert" - Triggers on standard sell signals
3. "Strong Buy Alert" - Triggers on divergence-confirmed buy signals
4. "Strong Sell Alert" - Triggers on divergence-confirmed sell signals
To set up alerts: Right-click chart → Add Alert → Select desired condition
═══════════════════════════════════════════════
This indicator is provided for educational and informational purposes. Always practice proper risk management and never trade with money you cannot afford to lose.

Magracia Entry-Exit 5 Min Time frame//------------------------------------------------------------------------------------------------------
// 🧭 Indicator Description
//------------------------------------------------------------------------------------------------------
// 📘 Overview:
// This indicator is a modified version of the LuxAlgo pattern logic designed to detect
// high-probability **RBD (Rally–Base–Drop)** and **DBR (Drop–Base–Rally)** reversal structures
// directly on the current candle. It automatically identifies potential BUY and SELL zones,
// plots corresponding trade signals, and dynamically calculates **Take Profit (TP)** and **Stop Loss (SL)** levels.
//
// The goal of this tool is to give clear, visually guided trade entries and exits that
// follow price structure and momentum changes without repainting historical data.
//
//------------------------------------------------------------------------------------------------------
// 🧩 How It Works:
// • **RBD (Rally–Base–Drop)** → Indicates a bearish reversal (SELL signal)
// • **DBR (Drop–Base–Rally)** → Indicates a bullish reversal (BUY signal)
// • Optional **RBR / DBD** continuation patterns can be toggled on for trend continuation setups.
// • When a signal is detected, the script automatically places:
// ▫ A BUY or SELL marker at the candle
// ▫ Dynamic TP (green dotted line) and SL (red dotted line) levels
// ▫ An EXIT marker when either TP or SL is reached
//
//------------------------------------------------------------------------------------------------------
// ⚙️ Inputs:
// • Enable or disable individual pattern types (RBD, RBR, DBD, DBR)
// • Toggle continuation patterns (RBR/DBD)
// • Customize Take Profit and Stop Loss percentages
// • Adjust rally/drop bar colors for easier pattern visualization
//
//------------------------------------------------------------------------------------------------------
// 🧠 Usage Tips:
// • Works best on volatile pairs and short–term timeframes (1m to 15m)
// • Can be combined with volume or trend filters for stronger confirmation
// • When used on higher timeframes (e.g., 4H+), increase TP/SL percentage range
//
//------------------------------------------------------------------------------------------------------
// ⚠️ Notes:
// • Signals are plotted **in real-time on the current candle** (not delayed).
// • This indicator is for visual and educational use only and does not guarantee profitability.
// • For optimal results, combine it with proper risk management and confirmation indicators.
//
//------------------------------------------------------------------------------------------------------
// © Gideon (CC BY-NC-SA 4.0 Licensed)
//------------------------------------------------------------------------------------------------------

Santhosh VWAP + 3 EMA + Buy Sell AlertI have combined VWAP and EMA , along with this generated buy and sell alert based on ATR . Best for Scalping
21day Structure + 1xATR Extension LineThis is a 21-day structure script that is used by Alex Desjardins (Prime Trading) along with a 1xATR line to make sure entries aren't bought extended from this structure.
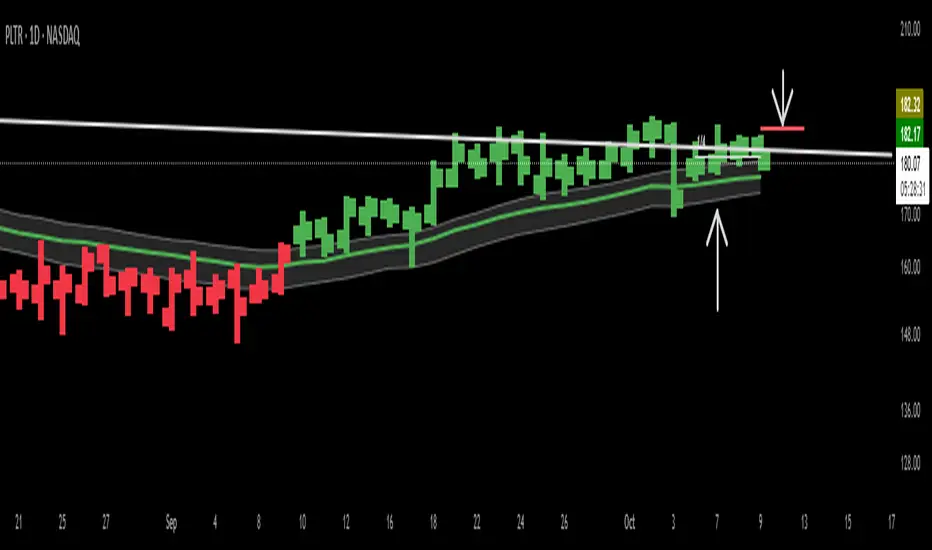
Devil Marks - Multi TimeframeA handy completely new script that shows Devil Marks for several time frames on the current time frame.
Devil Marks are where candles have no wick at one end of the candlestick. These levels are seen as areas that price needs to go back to at some point to re-balance the imbalance. These levels can add confluence to a trade idea.
A table is included that shows the closest devil mark for each time frame.
Devil Marks should show until that level is mitigated by price trading at that level.
Fractals & SweepThe Fractals & Sweep indicator is designed to identify key market structure points (fractals) and detect potential liquidity sweeps around those areas. It visually highlights both Bill Williams fractals and regular fractals, and alerts the user when the market sweeps liquidity above or below the most recent fractal levels.
Fractal Recognition:
Detects both bullish (low) and bearish (high) fractals on the price chart.
Users can choose between:
Bill Williams fractal logic (default), or
Regular fractal logic (when the “Filter Bill Williams Fractals” option is enabled).
Fractals are plotted directly on the chart as red downward triangles for highs and green upward triangles for lows.
Fractal Tracking:
The indicator stores the most recent high and low fractal levels to serve as reference points for potential sweep detection.
Sweep Detection:
A bearish sweep is triggered when the price wicks above the last fractal high but closes below it — suggesting a liquidity grab above resistance.
A bullish sweep is triggered when the price wicks below the last fractal low but closes above it — suggesting a liquidity grab below support.
When a sweep occurs, the indicator draws a horizontal line from the previous fractal point to the current bar.
Alert System:
Custom alerts notify the trader when a bearish sweep or bullish sweep occurs, allowing for timely reactions to potential reversals or liquidity traps.
