Indicators and strategies

Xbirch_Turtle_ Crypto_CalcМодернизированная стратегия Черепах.
Вход/выход по каналу Дончиана, стопы по величине ATR, возможность выбора лонг/шорт/всё. Имеется пирамидинг - добавление по +0,5ATR от первого бая, не более 4х входов. Модернизированный стоп - по ATR от первого бая.
Не финансовый совет.
A modernized Turtle strategy.
Entry/exit based on the Donchian Channel, stops based on the ATR value, and the ability to choose long/short/all options. Pyramiding is available – adding +0.5 ATR from the first buy, with a maximum of four entries. The modernized stop is based on the ATR value from the first buy.
This is not financial advice.

A-Share Broad-Based ETF Dual-Core Timing System1. Strategy Overview
The "A-Share Broad-Based ETF Dual-Core Timing System" is a quantitative trading strategy tailored for the Chinese A-share market (specifically for broad-based ETFs like CSI 300, CSI 500, STAR 50). Recognizing the market's characteristic of "short bulls, long bears, and sharp bottoms," this strategy employs a "Left-Side Latency + Right-Side Full Position" dual-core driver. It aims to safely bottom-fish during the late stages of a bear market and maximize profits during the main ascending waves of a bull market.
2. Core Logic
A. Left-Side Latency (Rebound/Bottom Fishing)
Capital Allocation: Defaults to 50% position.
Philosophy: "Buy when others fear." Seeks opportunities in extreme panic or momentum divergence.
Entry Signals (Triggered by any of the following):
Extreme Panic: RSI Oversold (<30) + Price below Bollinger Lower Band + Bullish Candle Close (Avoid catching falling knives).
Oversold Bias: Price deviates more than 15% from the 60-day MA (Life Line), betting on mean reversion.
MACD Bullish Divergence: Price makes a new low while MACD histogram does not, accompanied by strengthening momentum.
B. Right-Side Full Position (Trend Following)
Capital Allocation: Aggressively scales up to Full Position (~99%) upon signal trigger.
Philosophy: "Follow the trend." Strike heavily once the trend is confirmed.
Entry Signals (All must be met):
Upward Trend: MACD Golden Cross + Price above 20-day MA.
Breakout Confirmation: CCI indicator breaks above 100, confirming a main ascending wave.
Volume Support: Volume MACD Golden Cross, ensuring price increase is backed by volume.
C. Smart Risk Control
Bear Market Exhaustion Exit: In a bearish trend (MA20 < MA60), the strategy does not "hold and hope." It immediately liquidates left-side positions upon signs of rebound exhaustion (breaking below MA20, touching MA60 resistance, or RSI failure).
ATR Trailing Stop: Uses Average True Range (ATR) to calculate a dynamic stop-profit line that rises with the price to lock in profits.
Hard Stop Loss: Forces a stop-loss if the left-side bottom fishing fails and losses exceed a set ATR multiple, preventing deep drawdowns.
3. Recommendations
Target Assets: High liquidity broad-based ETFs such as CSI 300 ETF (510300), CSI 500 ETF (510500), ChiNext ETF (159915), STAR 50 ETF (588000).
Timeframe: Daily Chart.

SMA Crossover Strategy with Monte Carlo TunerCore logic
• Two signals:
• FAST SMA
• SLOW SMA
• Trade rule:
• FAST > SLOW → long
• FAST < SLOW → short
• Nothing else. No indicators stacked on top.
⸻
Two operating modes
1) Deterministic mode (baseline)
• MC = OFF
• You choose (fast, slow) explicitly (default 8/34)
• Behavior is stationary and repeatable
This is your control experiment.
⸻
2) Monte Carlo mode (adaptive discovery)
• MC = ON
• The script:
• Samples (fast, slow) pairs randomly from bounded integer ranges
• Simulates trades for each pair in parallel
• Tracks (gross profit, gross loss, trade count)
• Computes PF = GP / GL
• Promotes best-so-far online
Key point:
This is not grid search. It’s stochastic sampling with early stopping with time control (default 35 s)

High-Probability Scalper (Market Open)Market open is where volatility is real, spreads are tight, and momentum shows itself early. This scalping strategy is built specifically to operate during that window, filtering out low-quality signals that usually appear later in the session.
Instead of trading all day, the logic is restricted to the first 90 minutes after market open, where continuation moves and fast pullbacks are more reliable.
What This Strategy Does
This script looks for short-term momentum alignment using:
Fast vs slow EMA structure
RSI confirmation to avoid chasing extremes
ATR-based risk control
Session-based filtering to trade only when volume matters
It’s designed for intraday scalping, not swing trading.
Core Trading Logic
1. Market Open Filter
Trades are allowed only between 09:30 – 11:00 exchange time.
This avoids low-liquidity chop and focuses on the period where most breakouts and reversals form.
2. Trend Confirmation
Bullish bias: 9 EMA crosses above 21 EMA
Bearish bias: 9 EMA crosses below 21 EMA
This keeps trades aligned with short-term direction instead of random entries.
3. Momentum Check (RSI)
RSI is used as a quality filter, not as an overbought/oversold signal.
Long trades only when RSI is strong but not extended
Short trades only when RSI shows weakness without exhaustion
This removes late entries and reduces whipsaws.
Entries & Exits
Entries
Executed only on confirmed candles
No intrabar repainting
One position at a time
Risk Management
Stop-loss based on ATR
Take-profit calculated using a fixed risk–reward ratio
Same structure for both long and short trades
This keeps risk consistent across different symbols and volatility levels.
Why This Strategy Works Better at Market Open
Volume is highest
False breakouts are fewer
EMA crosses have follow-through
RSI behaves more cleanly
By not trading all day, the strategy avoids most of the noise that kills scalpers.
Best Use Cases
Index futures
High-liquidity stocks
Major crypto pairs during active sessions
1m to 5m timeframes
What This Strategy Is NOT
Not a martingale
Not grid-based
Not designed for ranging markets
Not a “set and forget” system
It’s a controlled scalping template meant for disciplined execution.
How to Use It Properly
Test on multiple symbols
Adjust ATR length for volatility
Tune RSI ranges per market
Always forward-test before live alerts
Final Note
This strategy focuses on structure, timing, and risk, not indicator stacking.
If you trade the open, this gives you a clear framework instead of emotional entries.
If you want:
Alerts
Session customization
News filters
Partial exits
You can extend this logic without breaking the core system.

CryptoFlux Dynamo [JOAT]CryptoFlux Dynamo: Velocity Scalping Strategy
This Pine Script v6 strategy is designed for cryptocurrency markets operating on 5-minute and faster timeframes. It combines volatility regime detection, multi-path signal confirmation, and adaptive risk management to identify momentum-based trading opportunities in perpetual futures markets.
Core Design Principles
The strategy addresses three challenges specific to cryptocurrency trading:
24/7 market operation without session boundaries requires continuous monitoring and execution logic
Volatility regimes shift rapidly, demanding adaptive stop and target calculations
Tick-level responsiveness is critical for capturing momentum moves before they complete
Strategy Architecture
1. Signal Generation Stack
The strategy uses multiple technical indicators calibrated for cryptocurrency momentum:
MACD with parameters 8/21/5 (fast/slow/signal) optimized for crypto acceleration phases
EMA ribbon using 8/21/34 periods with slope analysis to assess trend structure
Volume impulse detection combining SMA baseline, standard deviation, and z-score filtering
RSI (21 period) and MFI (21 period) for momentum confirmation
Bollinger Bands and Keltner Channels for squeeze detection
2. Volatility Regime Classification
The strategy normalizes ATR as a percentage of price and classifies market conditions into three regimes:
Compression (< 0.8% ATR): Reduced position sizing, tighter stops (1.05x ATR), lower profit targets (1.6x ATR)
Expansion (0.8% - 1.6% ATR): Standard risk parameters, balanced risk-reward (1.55x stop, 2.05x target)
Velocity (> 1.6% ATR): Wider stops (2.1x ATR), amplified targets (2.8x ATR), tighter trailing offsets
ATR is calculated over 21 periods and smoothed with a 13-period EMA to reduce noise from wicks.
3. Multi-Path Entry System
Four independent signal pathways contribute to a composite strength score (0-100):
Trend Break (30 points): Requires EMA ribbon alignment, positive slope, and structure breakout above/below recent highs/lows
Momentum Surge (30 points): MACD histogram exceeds adaptive baseline, MACD line crosses signal, RSI/MFI above/below thresholds, with volume impulse confirmation
Squeeze Release (25 points): Bollinger Bands compress inside Keltner Channels, then release with momentum bias
Micro Pullback (15 points): Shallow retracements within trend structure that reset without breaking support/resistance
Additional scoring modifiers:
Volume impulse: +5 points when present, -5 when absent
Regime bonus: +5 in velocity, -2 in compression
Cycle bias: +5 when aligned, -5 when counter-trend
Trades only execute when the composite score reaches the minimum threshold (default: 55) and all filters agree.
4. Risk Management Framework
Position sizing is calculated from:
RiskCapital = Equity × (riskPerTradePct / 100)
StopDistance = ATR × StopMultiplier(regime)
Quantity = min(RiskCapital / StopDistance, MaxExposure / Price)
The strategy includes:
Risk per trade: 0.65% of equity (configurable)
Maximum exposure: 12% of equity (configurable)
Regime-adaptive stop and target multipliers
Adaptive trailing stops based on ATR and regime
Kill switch that disables new entries after 6.5% drawdown
Momentum fail-safe exits when MACD polarity flips or ribbon structure breaks
5. Additional Filters
Cycle Oscillator : Measures price deviation from 55-period EMA. Requires cycle bias alignment (default: ±0.15%) before entry
BTC Dominance Filter : Optional filter using CRYPTOCAP:BTC.D to reduce long entries during risk-off periods (rising dominance) and short entries during risk-on periods
Session Filter : Optional time-based restriction (disabled by default for 24/7 operation)
Strategy Parameters
All default values used in backtesting:
Core Controls
Enable Short Structure: true
Restrict to Session Window: false
Execution Session: 0000-2359:1234567 (24/7)
Allow Same-Bar Re-Entry: true
Optimization Constants
MACD Fast Length: 8
MACD Slow Length: 21
MACD Signal Length: 5
EMA Fast: 8
EMA Mid: 21
EMA Slow: 34
EMA Slope Lookback: 8
Structure Break Window: 9
Regime Intelligence
ATR Length: 21
Volatility Soothing: 13
Low Vol Regime Threshold: 0.8% ATR
High Vol Regime Threshold: 1.6% ATR
Cycle Bias Length: 55
Cycle Bias Threshold: 0.15%
BTC Dominance Feed: CRYPTOCAP:BTC.D
BTC Dominance Confirmation: true
Signal Pathways
Volume Baseline Length: 34
Volume Impulse Multiplier: 1.15
Volume Z-Score Threshold: 0.5
MACD Histogram Smoothing: 5
MACD Histogram Sensitivity: 1.15
RSI Length: 21
RSI Momentum Trigger: 55
MFI Length: 21
MFI Momentum Trigger: 55
Squeeze Length: 20
Bollinger Multiplier: 1.5
Keltner Multiplier: 1.8
Squeeze Release Momentum Gate: 1.0
Micro Pullback Depth: 7
Minimum Composite Signal Strength: 55
Risk Architecture
Risk Allocation per Trade: 0.65%
Max Exposure: 12% of Equity
Base Risk/Reward Anchor: 1.8
Stop Multiplier • Low Regime: 1.05
Stop Multiplier • Medium Regime: 1.55
Stop Multiplier • High Regime: 2.1
Take Profit Multiplier • Low Regime: 1.6
Take Profit Multiplier • Medium Regime: 2.05
Take Profit Multiplier • High Regime: 2.8
Adaptive Trailing Engine: true
Trailing Offset Multiplier: 0.9
Quantity Granularity: 0.001
Kill Switch Drawdown: 6.5%
Strategy Settings
Initial Capital: $100,000
Commission: 0.04% (0.04 commission_value)
Slippage: 1 tick
Pyramiding: 1 (no position stacking)
calc_on_every_tick: true
calc_on_order_fills: true
Visualization Features
The strategy includes:
EMA ribbon overlay (8/21/34) with customizable colors
Regime-tinted background (compression: indigo, expansion: purple, velocity: magenta)
Dynamic bar coloring based on signal strength divergence
Signal labels for entry points
On-chart dashboard displaying regime, ATR%, signal strength, position status, stops, targets, and risk metrics
Recommended Usage
Timeframes
The strategy is optimized for 5-minute charts. It can operate on 3-minute and 1-minute timeframes for faster scalping, or 15-minute for swing confirmation. When using higher timeframes, consider:
Increasing structure lookback windows
Raising RSI trigger thresholds above 58 to filter noise
Extending volume baseline length
Markets
Designed for high-liquidity cryptocurrency perpetual futures:
BTC/USDT, BTC/USD perpetuals
ETH perpetuals
Major L1 tokens with sufficient volume
For thinner order books, increase volume impulse multiplier and adjust quantity granularity to match exchange minimums.
Limitations and Compromises
Backtesting Considerations
TradingView strategy backtesting does not replicate broker execution. Actual fills, slippage, and commissions may differ
The strategy uses calc_on_every_tick=true and calc_on_order_fills=true to reduce bar-close distortions, but real execution still depends on broker infrastructure
At least 200 historical bars are required to stabilize regime classification, volume baselines, and cycle context
Market Structure Dependencies
BTC dominance feed ( CRYPTOCAP:BTC.D ) may lag during low-liquidity periods or weekends. Consider disabling the filter if data quality degrades
Volume impulse detection assumes consistent order book depth. During extreme volatility or exchange issues, volume signatures may be unreliable
Regime classification based on ATR percentage assumes normal volatility distributions. During black swan events, regime thresholds may not adapt quickly enough
Parameter Sensitivity
Default parameters are tuned for BTC/ETH perpetuals on 5-minute charts. Different assets or timeframes require recalibration
The composite signal strength threshold (55) balances selectivity vs. opportunity. Higher values reduce false signals but may miss valid setups
Risk per trade (0.65%) and max exposure (12%) are conservative defaults. Aggressive scaling increases drawdown risk
Execution Constraints
Same-bar re-entry requires broker support for rapid order placement
Quantity granularity must match exchange contract minimums
Kill switch drawdown (6.5%) may trigger during normal volatility cycles, requiring manual reset
Performance Expectations
This strategy is a framework for momentum-based cryptocurrency trading. Performance depends on:
Market conditions (trending vs. ranging)
Exchange execution quality
Parameter calibration for specific assets
Risk management discipline
Backtest results shown in publications reflect specific market conditions and parameter sets. Past performance does not indicate future results. Always forward test with paper trading or broker simulation before deploying live capital.
Code Structure
The strategy is organized into functional sections:
Configuration groups for parameter organization
Helper functions for position sizing and normalization
Core indicator calculations (MACD, EMA, ATR, RSI, MFI, volume analytics)
Regime classification logic
Multi-path signal generation and composite scoring
Entry/exit orchestration with risk management
Visualization layer with dashboard and chart elements
The source code is open and can be modified to suit your trading requirements. Everyone is encouraged to understand the logic before deploying and to test thoroughly in their target markets.
Modification Guidelines
When adapting this strategy:
Document any parameter changes in your publication
Test modifications across different market regimes
Validate position sizing logic for your exchange's contract specifications
Consider exchange-specific limitations (funding rates, liquidation mechanics, order types)
Conclusion
This strategy provides a structured approach to cryptocurrency momentum trading with regime awareness and adaptive risk controls. It is not a guaranteed profit system, but rather a framework that requires understanding, testing, and ongoing calibration to market conditions.
You should thoroughly understand the logic, test extensively in their target markets, and manage risk appropriately. The strategy's effectiveness depends on proper parameter tuning, reliable execution infrastructure, and disciplined risk management.
Disclaimer
This script and its documentation are for educational and informational purposes only. They do not constitute financial advice, investment recommendations, or trading advice of any kind. Trading cryptocurrencies and derivatives involves substantial risk of loss and is not suitable for all investors. Past performance, whether real or indicated by backtesting, does not guarantee future results.
This strategy is provided "as is" without any warranties or guarantees of profitability
You should not rely solely on this strategy for making trading decisions
Always conduct your own research and analysis before making any financial decisions
Consider consulting with a qualified financial advisor before engaging in trading activities
The authors and contributors are not responsible for any losses incurred from using this strategy
Cryptocurrency trading can result in the loss of your entire investment
Only trade with capital you can afford to lose
Use this strategy at your own risk. The responsibility for any trading decisions and their consequences lies entirely with you.

Gold Smart Scalper V3 - Clean ChartOverview
The Gold Smart Scalper V3 is a trend-following momentum strategy specifically optimized for XAU/USD (Gold). It focuses on catching "value pullbacks" within a strong trend, avoiding the noise of sideways markets. Unlike many scalpers that use lagging indicators for exits, this version uses fixed ATR-based targets to lock in profits during high-volatility moves common in Gold.
Core Methodology
The strategy operates on three layers of confirmation:
Macro Trend (HTF Filter): Uses a 50-period EMA to ensure trades are only taken in the direction of the higher-timeframe momentum.
The Value Zone: Instead of "chasing" green or red candles, the script waits for a pullback to the space between the 9 EMA and 21 EMA. This ensures a better risk-to-reward entry point.
The Trigger: A trade is only executed when price confirms the resumption of the trend by crossing back over the signal EMA after the pullback.
Key Features
Fixed Profit Targets: Replaced dynamic trailing stops with fixed Take Profit (TP) and Stop Loss (SL) levels based on ATR, ensuring exits aren't "hunted" by Gold's signature volatility spikes.
C lean Chart Interface : All moving average plots are hidden. The only visuals provided are the active TP/SL levels when a trade is live, keeping your workspace clutter-free.
Single-Trade Logic: The script includes a "One Trade Per Cross" gate, preventing the strategy from over-trading or "stacking" positions during choppy price action.
Settings & OptimizationATR Multipliers :
Stop Loss (SL): Default $2.0 \times ATR$. Protects against standard market noise.Take Profit (TP): Default $3.0 \times ATR$. Designed for a high Risk/Reward profile.Timeframe Recommendation: Optimized for 15m and 1H for swing scalping, or 5m for aggressive scalping.Instrument: Specifically tuned for Gold (XAU/USD), but applicable to other high-volatility pairs like GBP/JPY or NASDAQ.
Disclaimer
This script is for educational and backtesting purposes only. Past performance does not guarantee future results. Always practice proper risk management.

extradestrategy.limited.editiom 2026cocok untuk btc usd tidak di perjual belikan harap tidak menggunakan sembarangan

The Engulfing Liquidity Signal with Adjustable Trailing StopEngulfing Liquidity Signal with Adjustable Trailing Stop
This strategy is designed to enter long trades based on the Engulfing Liquidity Signal combined with a Trailing Stop. The strategy uses custom volume analysis and price action to detect potential market opportunities. The Trailing Stop is adjustable, allowing traders to customize the distance at which the stop will trail the price.
Key Features:
Engulfing Liquidity Signal: The strategy enters a trade when the market shows signs of strong liquidity and price action, typically when there is a strong reversal signal (bullish engulfing) accompanied by higher volume.
Trailing Stop: A dynamic exit strategy that locks in profits by trailing the stop level behind the highest price achieved since the trade entry. This prevents the position from being closed prematurely while still protecting profits if the market reverses.
Customizable Trailing Stop: Users can adjust the trailing stop percentage via the settings. This allows for greater flexibility in how closely the stop will trail the price.
No Fixed Take Profit: The strategy uses only the trailing stop, ensuring that profits are maximized based on price action without a fixed profit target.
How the Strategy Works:
Buy Signal (LongC):
The strategy triggers a buy signal when a bullish engulfing pattern occurs, and the liquidity conditions align (i.e., the volume is increasing and price action shows signs of a potential reversal).
The strategy enters a long position when the signal conditions are met.
Trailing Stop Logic:
Once the trade is initiated, a trailing stop is applied. The stop level follows the highest price achieved since entry, trailing the price based on a user-defined percentage.
The stop level adjusts upward as the price increases, locking in profits. If the price reverses and hits the trailing stop, the trade is closed.
The trailing stop is dynamic, meaning it moves only in the direction of profit, but it will not move lower once it has been set.
Sell Signal (ShortC):
The position will also be closed if a sell signal (ShortC) is generated. This ensures that the strategy exits the trade when a potential reversal is detected in the market.
No Fixed Take Profit:
The strategy does not use a fixed take profit level. Instead, the profit is managed entirely by the trailing stop, which ensures that positions remain open as long as the market is moving in favor of the trade, allowing the position to capture the maximum possible profit.
Settings:
Trailing Stop Percentage: The user can adjust the trailing stop distance by setting a percentage value between 10% and 100%. This controls how tightly or loosely the trailing stop will follow the price.
Benefits:
Maximized Profits: By using a trailing stop, the strategy aims to capture as much profit as possible without prematurely exiting trades.
Customizable: The adjustable trailing stop allows traders to tailor the strategy to their risk tolerance and market conditions.
Simple & Effective: The strategy is straightforward, relying on price action and volume signals, making it easy to understand and implement.
Ideal Use Case:
This strategy is suitable for traders who prefer to let their profits run and manage risk with a trailing stop. It is particularly useful in trending markets where the price continues to move in one direction for an extended period. By using a trailing stop, the strategy allows you to stay in the market and capture large moves while protecting profits.
This strategy provides an excellent combination of automated trade management with a Trailing Stop and Engulfing Liquidity Signal, making it a solid choice for traders seeking to automate their trades with customizable risk management.

Trend Dip-BuyerThis strategy is a simplified, high-probability Dip Buying System designed for active growth stocks. Instead of chasing breakouts at the top, it waits for the stock to take a "breather" (pullback) within an uptrend and buys the discount.
It combines a classic Trend Filter (50 EMA) with a sensitive Momentum Oscillator (RSI 2) to pinpoint the exact moment a pullback is likely to reverse back up.
How It Works:
1. The Trend Filter (50 EMA)
The strategy ONLY trades Long.
It requires the price to be above the 50-period Exponential Moving Average (EMA) (Blue Line). This ensures you are trading with the momentum of the market, not against it.
2. The Dip Signal (RSI 2)
It uses a fast 2-period RSI.
When RSI(2) drops below 50, it signals that the stock is temporarily "oversold" or resting. This is your cue that a discount entry is available.
3. Dynamic Exits
Profit Taking: The primary target is dynamic. The strategy looks to exit when RSI(2) spikes above 70, allowing you to capture the bulk of the momentum swing. (A fixed ATR target option is also included).
Safety: A 3x ATR Stop Loss protects the trade from sudden reversals.
✅ Simple Entry Checklist
Before taking a trade, ensure all 3 boxes are checked:
Trend Check: Is the current price ABOVE the Blue Line (50 EMA)?
Dip Check: Is the RSI (2) value BELOW 50?
Time Check: Is it past 12:00 PM? (Recommended for cleaner trends, but optional).
👉 If YES to all: Enter Long on the next candle open.
Best Settings (Customizable):
RSI Threshold: Default is 50 (Balanced). Lower to 30 for fewer, higher-quality trades.
Exit Method: "RSI > 70" is recommended for maximizing wins in strong trends.
Time Filter: "Trade > 12pm" is enabled by default to avoid morning volatility.

UT Bot + Hull MA Close-Cross Confirm (Strategy)UT Bot + Hull MA Close-Cross Confirm (Strategy)
This strategy combines the classic UT Bot ATR trailing stop with a Hull Moving Average (HMA) close-cross confirmation to reduce false signals and improve trade quality.
The system works in two stages:
UT Bot Signal Detection
A volatility-adjusted ATR trailing stop identifies potential trend shifts using a 1-period EMA crossover. This provides early buy and sell signals based on momentum and volatility.
Hull MA Close-Cross Confirmation
UT Bot signals are only confirmed once price closes across the Hull Moving Average. If a UT signal occurs on the wrong side of the Hull MA, the strategy waits until a valid close-cross occurs before triggering an entry. This confirmation step helps filter chop and late-trend reversals.
Key Features
Non-repainting logic (uses bar-close confirmation)
Futures-friendly design (fixed contracts, point-based TP/SL)
Supports Long, Short, or Both directions
Built-in Take Profit & Stop Loss
Configurable Hull MA type (HMA / EHMA / THMA)
Optional Heikin Ashi signal source
Clean Buy/Sell alerts for automation and webhook execution
Trade Logic Summary
Long Entry:
UT Bot buy signal + confirmed close above Hull MA
Short Entry:
UT Bot sell signal + confirmed close below Hull MA
Exit:
Fixed Take Profit or Stop Loss (user-defined in points)
Alerts & Automation
The strategy includes dedicated Buy Alert and Sell Alert conditions designed for webhook automation (e.g., trade logging, execution engines, or external dashboards). Alerts trigger only on confirmed bar closes, matching backtest behavior.
Intended Use
This strategy is designed for futures markets (e.g., MNQ, ES, GC) and performs best on intraday timeframes. Session filters, risk rules, and trade management can be handled externally if desired.
Disclaimer
This script is provided for educational and research purposes only and is not financial advice. Always test thoroughly and use proper risk management.

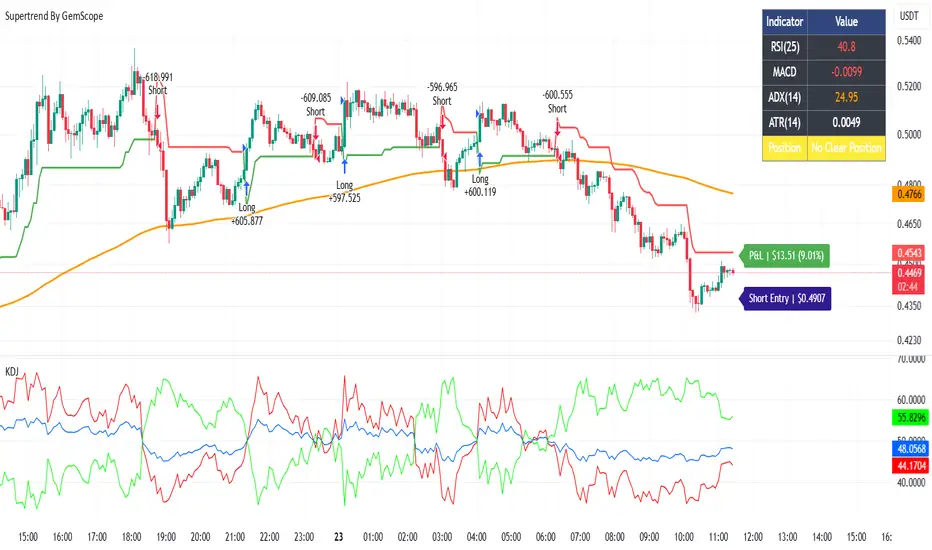
Supertrend By GemScope Supertrend by GemScope – Strategy Summary
This is an **automated trading strategy (Pine Script v5)** based on the **Supertrend indicator**, enhanced with **EMA filtering**, **percentage-based stop loss**, and **visual trade analytics**.
---
### 🔹 Core Strategy Logic
* Uses **Supertrend (ATR-based)** to detect market trend direction
* Trades **trend reversals and confirmations**
* Works on **both long and short positions**, or restricted to one side
---
### 🔹 Trade Direction Options
* **Both Long & Short**
* **Long Only**
* **Short Only**
---
### 🔹 Entry Conditions
#### 🟢 Long Entry
* Supertrend flips to **bullish**
* OR price crosses **above EMA 200**
* Long trades are allowed by settings
* If enabled: **price must be above EMA 200**
* Supertrend must confirm **uptrend**
#### 🔴 Short Entry
* Supertrend flips to **bearish**
* Short trades are allowed by settings
---
### 🔹 Position Sizing
* Trade size is defined in **USD**
* Quantity is calculated automatically based on market price
* Quantity rounding is user-configurable
---
### 🔹 Stop Loss (Risk Management)
* **Fixed percentage stop loss**
* Automatically placed after entry
* Works for both long and short positions
* No take-profit levels (trend-based exits instead)
---
### 🔹 Exit Logic
* **Short positions close** when:
* Supertrend turns bullish
* Price moves above EMA 200
* **Long positions close** when:
* Supertrend gives a short signal
---
### 🔹 Trend Protection
* Optional protection to **avoid closing shorts prematurely below EMA 200**
* EMA 200 acts as a **trend filter and support/resistance**
---
### 🔹 Visual Features
* **EMA 200** plotted on chart
* **Supertrend line** with color-coded direction
* Real-time **entry & P&L labels** displayed on the right side
* Indicator dashboard (RSI, MACD, ADX, ATR) shown in a table
---
### 🔹 Indicator Table Purpose
* Shows **market strength and bias**
* Helps identify whether **long or short positions are favored**
* Uses:
* RSI (momentum)
* MACD (trend direction)
* ADX (trend strength)
* ATR (volatility)
---
### 🔹 Overall Objective
This strategy is designed to:
* Trade **strong trends**
* Filter false signals using EMA 200
* Control risk with **strict percentage stop loss**
* Provide **clear visual feedback** for decision-making
RSI Divergence Strategy BTCRSI Divergence Strategy | Clean
Type: Backtestable strategy
Logic: Uses divergences between price and RSI to generate signals.
LONG: Price makes a lower low, RSI makes a higher low → bullish divergence
SHORT: Price makes a higher high, RSI makes a lower high → bearish divergence
TP / SL: Automatic, based on configurable percentage and Risk/Reward ratio.
Display:
RSI visible in a separate panel
LONG/SHORT signals indicated by small triangles in the RSI panel
Goal: Identify price reversals using relative strength (RSI) and backtest precise trades.

RSI Strategy with Auto Tuner (PF)# RSI Auto‑Tuner Strategy — How To Use
This document explains **how to use** the RSI Auto‑Tuner strategy. It intentionally avoids math and implementation details. Follow this as an operating guide.
---
## 1. What This Tool Is For
This strategy helps you:
* Discover **which RSI length works best** on a given ticker and timeframe
* Measure performance using **Profit Factor (PF)**
* Improve RSI performance on noisy markets by **transforming price first**
The auto‑tuner is a **research tool**, not a live trading signal generator.
---
## 2. Two Modes You Must Treat Differently
### Research Mode
Used to explore and discover parameters.
* Auto‑Tune: **ON**
* Parameters are allowed to change
* Results may look very good
* Overfitting risk is real
### Trading Mode
Used for forward testing or live trading.
* Auto‑Tune: **OFF**
* Parameters are fixed
* Behavior is stable and repeatable
* This is the only acceptable mode for live use
**Never trade live with Auto‑Tune enabled.**
---
## 3. Manual Mode (Trading Mode)
Use this after parameters are finalized.
Steps:
1. Set **Auto‑Tune = OFF**
2. Choose:
* Source (raw price or transformed price)
* RSI Length (manual, default 14)
* Oversold / Overbought levels
3. The strategy will:
* Enter long when RSI crosses up through Oversold
* Enter short when RSI crosses down through Overbought
* Flip positions on opposite signals
This mode is predictable and safe for forward testing.
---
## 4. Auto‑Tune Mode (Research Mode)
Use this to find optimal RSI lengths.
Steps:
1. Set **Auto‑Tune = ON**
2. Configure the search range:
* Minimum Length (default 5)
* Maximum Length (default 14)
* Step Size (default 1)
3. The strategy will:
* Internally simulate trades for each RSI length
* Track gross profit, gross loss, and trades
* Select the length with the highest Profit Factor
4. The best length is applied automatically
Auto‑Tune evaluates historical data only.
---
## 5. Using a Transform on Price (Critical)
RSI does **not** have to run on raw price.
You can significantly improve results by:
* Applying a **price transform** first
* Feeding the transformed series into the RSI Source input
Examples of transforms:
* Moving averages
* Low‑pass filters
* Butterworth filters
* Any smoother or denoiser
Why this works:
* Busy, wicky markets cause RSI to whipsaw
* Transforms remove micro‑noise
* RSI responds to structure instead of chaos
* Profit Factor often increases dramatically
Best practice:
* Auto‑tune on raw price
* Auto‑tune on transformed price
* Compare PF, trade count, and stability
---
## 6. Reading the Status Label
At the last bar, the on‑chart label shows:
* Whether Auto‑Tune is ON or OFF
* Whether candidates were built successfully
* Number of RSI lengths tested
* Best RSI length found
* Profit Factor and trade count
If Auto‑Tune is OFF, the label shows the manual length.
---
## 7. Recommended Workflow
1. Choose ticker and timeframe
2. Enable Auto‑Tune on **raw price**
3. Record best RSI length and PF
4. Enable Auto‑Tune on **transformed price**
5. Compare results
6. Lock parameters
7. Disable Auto‑Tune
8. Forward test
---
## 8. Warnings and Discipline
* High PF with few trades is unreliable
* Transforms can hide execution costs
* Always validate on a different period
* Auto‑Tune is a **lens**, not an edge
Treat this tool as a research microscope, not an autopilot.

Jack Dunn (Mean Reversion, Z-score + Vol Filter + Trend Filter))based on mean reversion and z score
FOR 1M XAUUSD or 5M USDJPY

GemScope Signals## 📊 GemScope Signals – Strategy Summary
This is an **automated trading strategy (Pine Script v5)** designed to trade market trends using a **custom GemScope oscillator**, **EMA trend filter**, **risk control**, and **multi-level take profit system**.
---
### 🔹 Trading Modes
* **Long Only**
* **Short Only**
* **Both Long & Short**
---
### 🔹 Entry Logic
**Long Trades**
* No active long position
* Entry allowed (not in cool-down after stop loss)
* GemScope shows **bullish trend (bull > bear)**
* If EMA filter is enabled: **price must be above EMA 200**
**Short Trades**
* No active short position
* Entry allowed
* GemScope gives **bearish signal (bull < bear)**
---
### 🔹 Exit Logic
* Positions close on **opposite GemScope signals**
* Short positions also close when:
* EMA filter is enabled
* Price moves above EMA
* Trend turns bullish
---
### 🔹 Stop Loss System
* **Percentage-based stop loss** for both long and short trades
* After a stop loss:
* New entries are blocked
* Trading resumes only after a fixed number of candles (cool-down)
---
### 🔹 Take Profit System (Partial Exits)
* Up to **three take-profit levels (TP1, TP2, TP3)**
* Each TP has:
* Independent price distance (%)
* Independent position size to close (%)
* Helps lock profits gradually while keeping runners open
---
### 🔹 Trend & Visuals
* Candles turn **green in bullish trend** and **red in bearish trend**
* **EMA 200** is plotted for trend confirmation
* Chart signals:
* **“G”** → Long signal
* **“S”** → Short signal
---
### 🔹 Risk & Money Management
* Uses **100% of account equity per trade**
* **No pyramiding** (one trade at a time)
* Built-in protection against over-trading after losses
---
### 🔹 Overall Purpose
The strategy aims to:
* Trade only in **confirmed trends**
* Reduce false entries using EMA filtering
* Protect capital with stop loss and cool-down
* Maximize profits using **structured partial exits**

Strategy-Based Breakout Backtest by AlturoiThis educational strategy is designed to help active traders learn how to turn trading ideas into data-driven decisions by testing strategies against historical price action before risking real capital.
The script walks through the step-by-step backtesting workflow on TradingView, showing how strategy logic, entries, exits, and risk rules translate into measurable performance metrics such as win rate, drawdown, and expectancy.
What this script helps you learn:
How to backtest on TradingView using Pine Script strategies
How the Strategy Tester calculates performance results
How to interpret win rate, drawdowns, and consistency
How to validate breakout and support/resistance concepts
How to identify structural edge — or flaws — before going live
This is not a signal service or financial advice. It is an educational framework meant to help traders understand proper backtesting techniques and avoid common mistakes when evaluating trading strategies.
Use this script as a learning template to experiment, modify logic, and improve your understanding of how professional backtesting on TradingView works.

Prop ES EMA Cross during Single/Dual Trading SessionEMA crossover strategy for ES futures optimized for prop firm rules.
Choose long-only, short-only, or both directions.
Customizable short and long EMA lengths.
Enter trades during one or two configurable sessions specified in New York time.
Fixed TP/SL in ticks with forced close by 4:59 PM NY time.

EMA 1 & SALMA Intersection StrategyTrading Strategy: EMA 1 & SALMA Crossover System
This strategy is a Trend-Following system that focuses on the direct interaction between the price (represented by EMA 1) and a smoothed trendline (SALMA). Instead of relying on the color changes of the indicator, it uses mechanical crossover signals to enter and exit trades.
1. Indicators Used
EMA 1 (Exponential Moving Average): Since the period is 1, it effectively represents the Current Price. It reacts instantly to every market move.
SALMA v3.0 (Smoothed Adaptive Lattice Moving Average): A double-smoothed moving average that acts as the "Base Line" or "Trend Support/Resistance."
RSI (Relative Strength Index): Used as a Momentum Filter to ensure we don't trade against the market's strength.
2. Buy (Long) Entry Rules
You enter a Long position when the following conditions are met:
The Crossover: The EMA 1 (Price) crosses ABOVE the SALMA line. This indicates that the short-term momentum is shifting higher than the average trend.
The Filter (RSI): The RSI must be above 50. This confirms that the buyers are in control and the upward move has enough strength.
3. Sell (Short) Entry Rules
You enter a Short position when the following conditions are met:
The Crossunder: The EMA 1 (Price) crosses BELOW the SALMA line. This indicates a breakdown in price action.
The Filter (RSI): The RSI must be below 50. This confirms that the sellers are dominating and the downward momentum is real.
4. Key Advantages of This System
Objectivity: You don't guess based on the color of the line; you wait for a clear physical break (cross) of the line.
Precision: By using EMA 1, you get the earliest possible entry signal compared to slower moving averages.
False Signal Protection: The RSI 50 filter prevents you from entering "weak" trades where the price crosses the line but lacks the volume or momentum to continue.

OCC Strategy Optimized (MA 5 + Delayed TSL)# OCC Strategy Optimized (MA 5 + Delayed TSL) - User Guide
## Introduction
The **OCC Strategy Optimized** is an enhanced version of the classic **Open Close Cross (OCC)** strategy. This strategy is designed for high-precision trend following, utilizing the crossover logic of Open and Close moving averages to identify market shifts. This optimized version incorporates advanced risk management, multi-timeframe analysis, and a variety of moving average types to provide a robust trading solution for modern markets.
>
> **Special Thanks:** This strategy is based on the original work of **JustUncleL**, a renowned Pine Script developer. You can find their work and profile on TradingView here: (in.tradingview.com).
---
## Key Features
### 1. Optimized Core Logic
- **MA Period (Default: 5):** The strategy is tuned with a shorter MA length to reduce lag and capture trends earlier.
- **Crossing Logic:** Signals are generated when the Moving Average of the **Close** crosses the Moving Average of the **Open**.
### 2. Multi-Timeframe (MTF) Analysis
- **Alternate Resolution:** Use a higher timeframe (Resolution Multiplier) to filter out noise. By default, it uses $3 \times$ your current chart timeframe to confirm the trend.
- **Non-Repainting:** Includes an optional delay offset to ensure signals are confirmed and do not disappear (repaint) after the bar closes.
### 3. Advanced Risk Management
This script features a hierarchical exit system to protect your capital and lock in profits:
- **Fixed Stop Loss (Initial):** Protects against sudden market reversals immediately after entry.
- **Delayed Trailing Stop Loss (TSL):**
- **Activation Delay:** The TSL only activates after the trade reaches a specific profit threshold (e.g., 1%). This prevents being stopped out too early in the trade's development.
- **Ratchet Trail:** Once activated, the stop loss "ratchets" up/down, never moving backward, ensuring you lock in profits as the trend continues.
- **Take Profit (TP):** A fixed percentage target to exit the trade at a pre-defined profit level.
### 4. Versatility
- **12 MA Types:** Choose from SMA, EMA, DEMA, TEMA, WMA, VWMA, SMMA, HullMA, LSMA, ALMA, SSMA, and TMA.
- **Trade Direction:** Toggle between Long-only, Short-only, or Both.
- **Visuals:** Optional bar coloring to visualize the trend directly on the candlesticks.
---
## User Input Guide
### Core Settings
- **Use Alternate Resolution?:** Enable this to use the MTF logic.
- **Multiplier for Alternate Resolution:** How many charts higher the "filter" timeframe should be.
- **MA Type:** Select your preferred moving average smoothing method.
- **MA Period:** The length of the Open/Close averages.
- **Delay Open/Close MA:** Use `1` or higher to force non-repainting behavior.
### Risk Management Settings
- **Use Trailing Stop Loss?:** Enables the TSL system.
- **Trailing Stop %:** The distance the stop follows behind the price (Optimized Default: 1.5%).
- **TSL Activation % (Delay):** The profit % required before the TSL starts moving. (Optimized Default: 2.0% to ensure 0.5% profit is locked immediately).
- **Initial Fixed Stop Loss %:** Your hard stop if the trade immediately goes against you.
- **Take Profit %:** Your ultimate profit target for the trade.
---
## How to Trade with This Strategy
1. **Identify the Trend:** Look for the Moving Average lines (Close vs Open) to cross.
2. **Wait for Confirmation:** If using MTF, ensure the higher timeframe also shows a trend change.
3. **Manage the Trade:** Let the TSL work. With the default **2.0% Activation** and **1.5% Trail**, the strategy will automatically lock in **0.5% profit** the moment the threshold is hit, then follow the price higher.
4. **Position Sizing:** Adjust the `Properties` tab in the script settings to match your desired capital allocation (Default is 10% of equity).
---
## Recommended Settings
1. Trialing < Activation
2. Check ranging
## Credits
Original Strategy by: **JustUncleL**
Optimized and Enhanced by: **Antigravity AI**

RSI (Any Source) StrategyThis is a simple RSI crossover/crossunder strategy. It calculates RSI on a user-selected Source (default close) using the chosen Length (default 14). It enters a long when RSI crosses up through the Oversold level (default 30), and enters a short when RSI crosses down through the Overbought level (default 70). It does not include explicit exits—each new signal effectively flips/replaces the position via a new entry.

Butterworth LPF Flip + AutoTune (PF)Butterworth LPF Flip + AutoTune (PF)
This strategy trades price trend flips using two Butterworth low-pass filters (a FAST filter and a SLOW filter). A trade is taken when the FAST filter crosses the SLOW filter. Optionally, the script can auto-tune the filter lengths by simulating many Fast/Slow combinations and selecting the pair with the best Profit Factor (PF).
What the Script Does
- Computes two 2‑pole Butterworth low‑pass filters on price.
- Enters LONG when FAST crosses above SLOW.
- Enters SHORT when FAST crosses below SLOW.
- Optionally simulates many Fast/Slow length combinations internally.
- Chooses the Fast/Slow pair with the highest Profit Factor.
- Trades only the selected best pair.
Manual Mode (Default)
1. Leave Auto‑Tune OFF.
2. Set:
- FAST cutoff period (bars)
- SLOW cutoff period (bars)
3. The strategy will trade using only these values.
Use this mode for normal trading or live deployment.
Auto‑Tune Mode
1. Enable Auto‑Tune.
2. Define Fast and Slow ranges:
- FAST min / max / step
- SLOW min / max / step
3. The script simulates ALL Fast × Slow combinations bar‑by‑bar.
4. Each combination tracks:
- Gross Profit
- Gross Loss
- Closed trades
- Profit Factor (PF = GP / GL)
5. At the end of the chart, the best PF pair is selected and used for trading.
Interpreting the End Box
The status label at the end of the chart reports:
- Whether Auto‑Tune is enabled
- Number of candidate pairs tested
- Best FAST period
- Best SLOW period
- Profit Factor of the best pair
- Win Rate (wins ÷ closed trades)
If PF is near 1.0 or trades are very low, expand the range or length of the test.
Best Practices
- Use Auto‑Tune ONLY for research and optimization.
- After finding good parameters, disable Auto‑Tune and trade manually.
- Keep Fast < Slow (logical separation).
- Longer charts produce more reliable PF results.
- Avoid very small step sizes (performance + noise).
Known Limitations
- Pine Script runs bar‑by‑bar; tuning is approximate, not vectorized.
- Large grids increase execution time.
- Results are historical and NOT predictive.
- Not suitable for live auto‑optimization.
Summary
This script is best viewed as a *research tool first, strategy second*. Use it to discover stable Fast/Slow regimes, then lock them in for simple, repeatable trading.

ES Multi-Timeframe SMC Entry SystemOverviewThis is a comprehensive Smart Money Concepts (SMC) trading strategy for ES1! (E-mini S&P 500) futures that provides simultaneous buy and sell signals across three timeframes: Daily, Weekly, and Monthly. It incorporates your complete entry checklists, confluence scoring system, and automated risk management.Core Features1. Multi-Timeframe Signal Generation
Daily Signals (D) - For intraday/swing trades (1-3 day holds)
Weekly Signals (W) - For swing trades (3-10 day holds)
Monthly Signals (M) - For position trades (weeks to months)
All three timeframes can trigger simultaneously (pyramiding enabled)
2. Smart Money Concepts ImplementationOrder Blocks (OB)
Automatically detects bullish and bearish order blocks
Bullish OB = Down candle before strong impulse up
Bearish OB = Up candle before strong impulse down
Validates freshness (< 10 bars = higher quality)
Visual boxes displayed on chart
Fair Value Gaps (FVG)
Identifies 3-candle imbalance patterns
Bullish FVG = Gap between high and current low
Bearish FVG = Gap between low and current high
Tracks unfilled gaps as targets/entry zones
Auto-removes when filled
Premium/Discount Zones
Calculates 50-period swing range
Premium = Upper 50% (short from here)
Discount = Lower 50% (long from here)
Deep zones (<30% or >70%) for higher quality setups
Visual shading: Red = Premium, Green = Discount
Liquidity Sweeps
Sell-Side Sweep (SSL) = False break below lows → reversal up
Buy-Side Sweep (BSL) = False break above highs → reversal down
Marked with yellow labels on chart
Valid for 10 bars after occurrence
Break of Structure (BOS)
Identifies when price breaks recent swing high/low
Confirms trend continuation
Marked with small circles on chart
3. Confluence Scoring SystemEach timeframe has a 10-point scoring system based on your checklist requirements:Daily Score (10 points max)
HTF Trend Alignment (2 pts) - 4H and Daily EMAs aligned
SMC Structure (2 pts) - OB in correct zone with HTF bias
Liquidity Sweep (1 pt) - Recent SSL/BSL occurred
Volume Confirmation (1 pt) - Volume > 1.2x 20-period average
Optimal Time (1 pt) - 9:30-12 PM or 2-4 PM ET (avoids lunch)
Risk-Reward >2:1 (1 pt) - Built into exit strategy
Clean Price Action (1 pt) - BOS occurred
FVG Present (1 pt) - Near unfilled fair value gap
Minimum Required: 6/10 (adjustable)Weekly Score (10 points max)
Weekly/Monthly Alignment (2 pts) - W and M EMAs aligned
Daily/Weekly Alignment (2 pts) - D and W trends match
Premium/Discount Correct (2 pts) - Deep zone + trend alignment
Major Liquidity Event (1 pt) - SSL/BSL sweep
Order Block Present (1 pt) - Valid OB detected
Risk-Reward >3:1 (1 pt) - Built into exit
Fresh Order Block (1 pt) - OB < 10 bars old
Minimum Required: 7/10 (adjustable)Monthly Score (10 points max)
Monthly/Weekly Alignment (2 pts) - M and W trends match
Weekly OB in Monthly Zone (2 pts) - OB in deep discount/premium
Major Liquidity Sweep (2 pts) - Significant SSL/BSL
Strong Trend Alignment (2 pts) - D, W, M all aligned
Risk-Reward >4:1 (1 pt) - Built into exit
Extreme Zone (1 pt) - Price <20% or >80% of range
Minimum Required: 8/10 (adjustable)4. Entry ConditionsDaily Long Entry
✅ Daily score ≥ 6/10
✅ 4H trend bullish (price > EMAs)
✅ Price in discount zone
✅ Bullish OB OR SSL sweep OR near bullish FVG
✅ NOT during avoid times (lunch/first 5 min)Daily Short Entry
✅ Daily score ≥ 6/10
✅ 4H trend bearish
✅ Price in premium zone
✅ Bearish OB OR BSL sweep OR near bearish FVG
✅ NOT during avoid timesWeekly Long Entry
✅ Weekly score ≥ 7/10
✅ Weekly trend bullish
✅ Daily trend bullish
✅ Price in discount
✅ Bullish OB OR SSL sweepWeekly Short Entry
✅ Weekly score ≥ 7/10
✅ Weekly trend bearish
✅ Daily trend bearish
✅ Price in premium
✅ Bearish OB OR BSL sweepMonthly Long Entry
✅ Monthly score ≥ 8/10
✅ Monthly trend bullish
✅ Weekly trend bullish
✅ Price in DEEP discount (<30%)
✅ Bullish order block presentMonthly Short Entry
✅ Monthly score ≥ 8/10
✅ Monthly trend bearish
✅ Weekly trend bearish
✅ Price in DEEP premium (>70%)
✅ Bearish order block present5. Automated Risk ManagementPosition Sizing (Per Entry)
Daily: 1.0% account risk per trade
Weekly: 0.75% account risk per trade
Monthly: 0.5% account risk per trade
Formula:
Contracts = (Account Equity × Risk%) ÷ (Stop Points × $50)
Minimum = 1 contractStop Losses
Daily: 12 points ($600 per contract)
Weekly: 40 points ($2,000 per contract)
Monthly: 100 points ($5,000 per contract)
Profit Targets (Risk:Reward)
Daily: 2:1 = 24 points ($1,200 profit)
Weekly: 3:1 = 120 points ($6,000 profit)
Monthly: 4:1 = 400 points ($20,000 profit)
Example with $50,000 AccountDaily Trade:
Risk = $500 (1% of $50k)
Stop = 12 points × $50 = $600
Contracts = $500 ÷ $600 = 0.83 → 1 contract
Target = 24 points = $1,200 profit
Weekly Trade:
Risk = $375 (0.75% of $50k)
Stop = 40 points × $50 = $2,000
Contracts = $375 ÷ $2,000 = 0.18 → 1 contract
Target = 120 points = $6,000 profit
Monthly Trade:
Risk = $250 (0.5% of $50k)
Stop = 100 points × $50 = $5,000
Contracts = $250 ÷ $5,000 = 0.05 → 1 contract
Target = 400 points = $20,000 profit
6. Visual Elements on ChartKey Levels
Previous Daily High/Low - Red/Green solid lines
Previous Weekly High/Low - Red/Green circles
Previous Monthly High/Low - Red/Green crosses
Equilibrium Line - White dotted line (50% of range)
Zones
Premium Zone - Light red shading (upper 50%)
Discount Zone - Light green shading (lower 50%)
SMC Markings
Bullish Order Blocks - Green boxes with "Bull OB" label
Bearish Order Blocks - Red boxes with "Bear OB" label
Bullish FVGs - Green boxes with "FVG↑"
Bearish FVGs - Red boxes with "FVG↓"
Liquidity Sweeps - Yellow "SSL" (down) or "BSL" (up) labels
Break of Structure - Small lime/red circles
Entry Signals
Daily Long - Small lime triangle ▲ with "D" below price
Daily Short - Small red triangle ▼ with "D" above price
Weekly Long - Medium green triangle ▲ with "W" below price
Weekly Short - Medium maroon triangle ▼ with "W" above price
Monthly Long - Large aqua triangle ▲ with "M" below price
Monthly Short - Large fuchsia triangle ▼ with "M" above price
7. Information TablesConfluence Score Table (Top Right)
┌──────────┬────────┬────────┬────────┐
│ TF │ SCORE │ STATUS │ SIGNAL │
├──────────┼────────┼────────┼────────┤
│ 📊 DAILY │ 7/10 │ ✓ PASS │ 🔼 │
│ 📈 WEEKLY│ 6/10 │ ✗ WAIT │ ━ │
│ 🌙 MONTH │ 9/10 │ ✓ PASS │ 🔽 │
├──────────┴────────┴────────┴────────┤
│ P&L: $2,450 │
└─────────────────────────────────────┘
Green scores = Pass (meets minimum threshold)
Orange/Red scores = Fail (wait for better setup)
🔼 = Long signal active
🔽 = Short signal active
━ = No signal
Entry Checklist Table (Bottom Right)
┌──────────────┬───┐
│ CHECKLIST │ ✓ │
├──────────────┼───┤
│ ━ DAILY ━ │ │
│ HTF Trend │ ✓ │
│ Zone │ ✓ │
│ OB │ ✗ │
│ Liq Sweep │ ✓ │
│ Volume │ ✓ │
│ ━ WEEKLY ━ │ │
│ W/M Align │ ✓ │
│ Deep Zone │ ✗ │
│ ━ MONTHLY ━ │ │
│ M/W/D Align │ ✓ │
│ Zone: Discount│ │
└──────────────┴───┘
Green ✓ = Condition met
Red ✗ = Condition not met
Real-time updates as market conditions change
8. Alert SystemIndividual Alerts:
"Daily Long" - Triggers when daily long setup appears
"Daily Short" - Triggers when daily short setup appears
"Weekly Long" - Triggers when weekly long setup appears
"Weekly Short" - Triggers when weekly short setup appears
"Monthly Long" - Triggers when monthly long setup appears
"Monthly Short" - Triggers when monthly short setup appears
Combined Alerts:
"Any Long Signal" - Catches any bullish opportunity (D/W/M)
"Any Short Signal" - Catches any bearish opportunity (D/W/M)
Alert Messages Include:
🔼/🔽 Direction indicator
Timeframe (DAILY/WEEKLY/MONTHLY)
Current confluence score
