AI Predictive Market Movement ProAI Predictive Market Movement Pro is a next-generation, data-driven trading strategy designed to analyze trend strength, momentum, and volatility in real time to forecast potential market direction. Using advanced normalization and weighted scoring, this strategy generates a Predictive Score that identifies optimal BUY and SELL opportunities with visual clarity.
It dynamically adapts to market conditions through adjustable parameters for trend, momentum, and volatility, combined with customizable Take-Profit (TP) and Stop-Loss (SL) levels. The AI-inspired algorithm detects market reversals and continuation points with high precision, helping traders stay on the right side of price movement.
Key Features:
📈 Intelligent Predictive Scoring (trend, momentum, volatility weighted blend)
⚡ Auto-generated Buy/Sell signals with visual markers
🎯 Customizable Take-Profit and Stop-Loss percentages
🧩 Adjustable sensitivity for more conservative or aggressive trading styles
🌈 Dynamic color visualization for market bias (green = bullish, red = bearish)
🔔 Integrated TradingView alerts for real-time notifications
Ideal For:
Scalpers, day traders, and swing traders who want a smart, adaptive, and visually intuitive AI-powered trading companion.
Indicators and strategies

WT + CRSI + Linear Regression Long-onlyLong-only strategy combining WaveTrend (WT), Connors RSI (CRSI), and Linear Regression Slope (LSDD) trend filter.
Signals are generated only when all three indicators align within a defined window.
Exits occur when all indicators turn bearish.
Backtested on BTC, 15-minute timeframe.

Camarilla Pivots + 20 EMA StrategyThis is an intraday volatility and trend-following system for commodities like Natural Gas, combining dynamic pivot levels (Camarilla) with a trend filter (20-period EMA) to improve risk-reward and reduce false breakouts.
Core Components
1. Camarilla Pivots:
These are special support and resistance levels (H3, H4, L3, L4) calculated each day based on the previous day's high, low, and close.
The pivots adapt to daily volatility, giving more relevant breakout and bounce zones than static lines.
H4: Aggressive resistance (used for breakout LONG entry)
H3: Moderate resistance/support (used for bounce or stoploss)
L4: Aggressive support (used for breakout SHORT entry)
L3: Moderate support/resistance (used for bounce or stoploss)
2. 20 EMA (Exponential Moving Average):
Plotted on the 30-minute chart, this acts as a trend filter.
If the price is above 20 EMA: Only look for long trades (bullish bias).
If below 20 EMA: Only look for short trades (bearish bias).
How the Strategy Works
Setup (30-Min Chart):
Camarilla pivots for the day are drawn on the chart.
20 EMA is also plotted.
Trade Filter:
Bullish: Trade ONLY if price is above 20 EMA.
Bearish: Trade ONLY if price is below 20 EMA.
Entry:
LONG: Enter when price breaks and closes above the H4 pivot AND is above 20 EMA.
SHORT: Enter when price breaks and closes below the L4 pivot AND is below 20 EMA.
Stop Loss:
LONG: Place stoploss at H3 (the next lower Camarilla resistance).
SHORT: Place stoploss at L3 (the next higher Camarilla support).
Target:
Always set a profit target at 2x the distance (risk) between entry and stoploss (strict R:R 2).
For example, if your entry is at H4 and stoploss at H3, your target is entry + 2*(entry - stoploss).
Alerts & Visuals:
The strategy plots entry arrows, stoploss and target lines for immediate visual reference.
Alerts trigger on breakout signals so you never miss a trade.
Why This Works Well for Natural Gas
Adapts to volatility: The pivots change daily, handling wide-ranging and choppy price moves better than fixed breakouts.
Trend filter: EMA prevents counter-trend whipsaws, only trades with market momentum.
Risk control: Every trade must meet strict risk-reward criteria, so losses are contained and winners can outweigh losers.

Ekoparaloji Strategy Cyrpto Strategy Description:
This strategy opens Long positions in bullish trends using average cost calculation. When the trend reverses, it implements pyramiding to take profit during upward corrections.
Capital Amount Settings:
• When "Capital Amount" is set to 5: The strategy uses the entire capital in portions for pyramiding, resulting in 1x leverage (no leverage).
• For Futures trading:
o "Capital Amount" set to 10: When all pyramiding positions are opened, it equals 2x leverage.
o "Capital Amount" set to 20: When all pyramiding positions are opened, it equals 4x leverage.
Recommendations:
• Spot trading: Use "Capital Amount" of 5 (recommended).
• Futures trading: Choose any amount based on your risk tolerance.
Additional Features:
• Take Profit %: Adjustable in the settings section.
• Stop Loss: Optional feature available in settings.
Best Performance: This strategy works more efficiently on 1-hour charts in Cryptocurrency Futures and Spot markets.
Testing: Contact me to test this strategy.


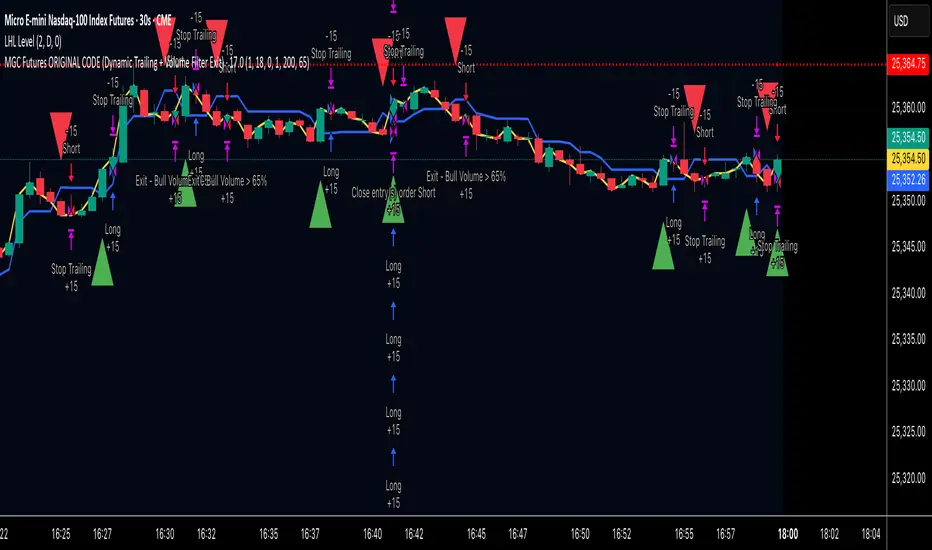
Bruno iarussi MNQ 30 sec Ashi candlesThis MGC Futures strategy uses an adaptive ATR trailing stop combined with a volume-based exit filter. Trades trigger on EMA crossovers and exit only when opposite volume exceeds 65%, preventing early exits while locking profits dynamically as trends strengthen.
get to use on Ashi candles on 30 sec chart
input 1-18-0-1-200-65
Prop 100K-15-0-0-0-0-0-0 select after order fill and using bar magnifier
Goldolito - Test - Strategy cross TP/SL dynamicTest crossover strategy with TP/SL dynamic. Just for test.

A Quantitative Strategy That Breaks the Mold – High Accuracy on As a quantitative researcher, I’ve built a trading strategy free from “look‑ahead bias” or indicator repainting. Back‑tests show about a 70 % win rate on BTC and ETH pairs, around 80 % on the 4‑hour timeframe and nearly 100 % on the daily. When applied to major Chinese A‑share indices, it maintains a 70–80 % win rate. These results come from rigorous testing across different markets and timeframes.
Years ago, I was as confused about markets as many newcomers are today. To help others avoid the same frustration, I’m now sharing this system and the thinking behind it. Our community doesn’t just provide signals; we teach risk management, position sizing and emotional discipline. If you’re ready to trade with structure rather than guesswork, join us and let’s succeed together.

Moona_Final_Auto_Trade369ID08.10.25A supertrend strategy is a popular trend-following trading system that uses the “Supertrend” indicator to generate buy and sell signals based on prevailing market momentum.

Monthly First Candle ORB BreakoutEvery Month first day candle High & low Marked, If high break go for a long in positional based on your RR, Stop loss must place candle low of first day and closing bases.

Fincandle Momentum ATR TrackerDescription (Compliant for Invite-Only Vendor Script)
The Fincandle Momentum ATR Tracker is a dynamic momentum-based strategy that combines price action with the Average True Range (ATR) to identify high-probability trend shifts.
It works by tracking an adaptive ATR trailing line that adjusts with market volatility. When price crosses this trailing line, it signals potential momentum reversals and dynamically switches between long and short positions.
Key Concepts:
ATR-based Trailing Logic: Adapts to volatility, allowing the stop line to follow price action smoothly.
Momentum Confirmation: Crossovers between price and the trailing line identify early trend reversals.
Dynamic Targets: Uses ATR multiples for both stop-loss and take-profit placement, maintaining consistent risk-reward profiles.
Clean Visuals: Buy/Sell markers and colored bars highlight current bias at a glance.
How Traders Use It:
As a trend-following system to stay aligned with dominant market direction.
As a volatility filter to avoid false breakouts during choppy conditions.
This strategy is best suited for traders who prefer objective, volatility-adaptive momentum tracking rather than fixed indicator levels.
Disclaimer:
This tool is designed for educational and analytical use only. Past results or chart examples do not guarantee future outcomes. Trading involves risk; use appropriate position sizing and risk control.
🟨 Author’s Instructions (Required Vendor Field)
To request access to this invite-only script, please contact me privately on TradingView or through the link in my profile signature.
Access is granted only upon explicit request — please do not request access in the comments section.
For additional documentation or support, visit my official Fincandle resources linked in my profile signature.
🟧 Release Notes Example (for updates)
Version 1.1 – Update:
• Improved trailing logic to reduce early signal reversals.
• Added adjustable Take Profit multiplier.
• Enhanced label readability on dark charts.

ProTrend Adaptive Strategy by TradingClueWhat it is
A volatility-adaptive trend-following strategy optimized on BTCUSD, 4-hour bars. It is built on the same adaptive signal engine as the ProTrend Adaptive Indicator by TradingClue, turning it into rule-based entries, exits, and position handling. The engine adjusts its effective lookback between user-defined bounds as volatility changes—tightening in quiet conditions and widening during expansions.
Entries require agreement between the adaptive signal and a Supertrend directional filter. The default exit closes on a Supertrend flip; no fixed profit target is used by default to preserve trend capture.
Why “adaptive” matters
Static lookbacks tend to over-trade in chop and under-react in fast moves. By letting the effective length glide between a minimum and a maximum based on ATR-style dispersion, the strategy aims to filter some sideways noise without giving up major runs.
Scope & portability
While tuned on BTCUSD 4h, the approach is portable to other symbols and asset classes—FX pairs/crosses, crypto assets, equities, and commodities—provided that parameters are re-tuned (lookback bounds, Supertrend factor, ATR settings, costs). Market microstructure differs, so validation with rolling metrics and cost assumptions is essential.
Context vs. Buy & Hold
This strategy is not intended to “win” against buy-and-hold in every regime. In persistent bull markets, passive exposure can deliver higher absolute returns.
In the backtest window shown on the strategy report, the parameter preset produced a higher (after-cost) equity curve than buy-and-hold for the same symbol/timeframe. Results are time-frame and cost dependent: during mixed or range-bound regimes, rules-based exits and variable exposure can reduce drawdowns and smooth the curve; during strong, uninterrupted uptrends, buy-and-hold may lead.
Results shown are for Jan 1, 2024 – present. The choice of a recent window is intentional:
- Relevance of regime. Crypto market microstructure evolves quickly (liquidity, spreads, leverage, volatility clustering). Using a contemporary window reduces non-stationarity between the sample and the environment we expect over the next quarters.
- Parameter fit to current volatility. The strategy’s adaptive engine is tuned to recent volatility levels; very old regimes can dilute evaluation and are less informative for forward expectations.
- Representative mix. The window contains both trending and range-bound segments, which is useful to assess trend capture vs. whipsaw control on BTCUSD 4h.
Robustness .
We also review longer-history runs and cost-stress scenarios (higher commission/slippage) and recommend users to do the same. Backtests are approximations; live results can differ due to fills, fees, slippage, funding, outages, and latency.
Intended use
Research/education and systematic testing. If used live, align commission and slippage with your venue, review rolling metrics (e.g., 90/180-day Profit Factor), and perform walk-forward and cost-stress checks.
Backtest context for the shared parameter-set
Symbol/TF: BTCUSD, 4h
commission: 0.04%
slippage: 2 ticks
backtesting-window: Jan 1, 2024 – present
Limitations
Backtests are approximations. Fills, fees, slippage, funding, outages and latency can deviate from live execution. Past performance does not guarantee future results. This publication is not financial advice.

BTC/ETH 8hr Trend SwingBTC/ETH 8hr Trend Swing
This is for Major Cryptos, where we will track it on 8-hour tf

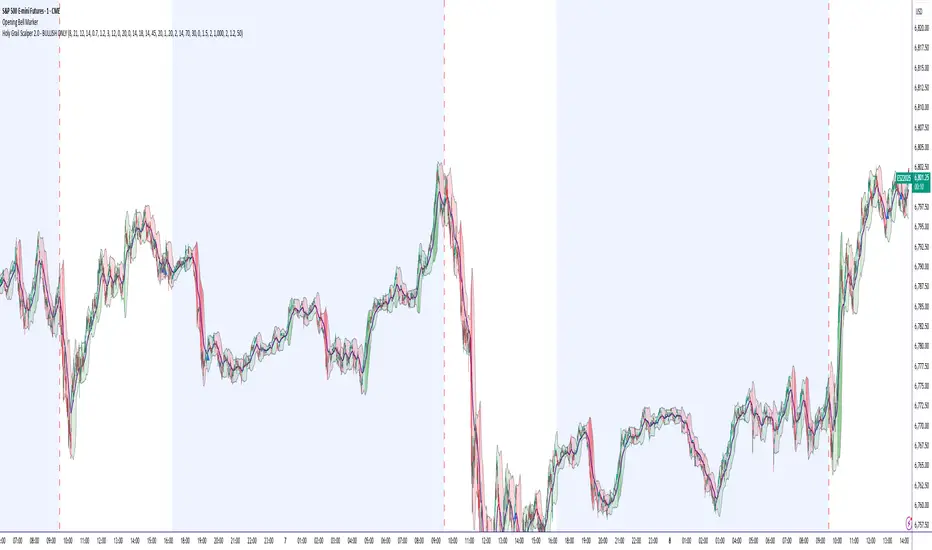
Holy Grail Scalper 2.0 - BULLISH ONLY## 🚀 The Holy Grail Scalper 2.0: Bullish Precision Trading
**Dominate the market with the scalping machine engineered for high-probability bullish moves!**
The **Holy Grail Scalper 2.0** is not just an indicator—it's a comprehensive, high-frequency trading strategy meticulously designed to capture explosive moves with maximum precision. It combines the power of EMAs, ADX, RSI, and Volume to ensure every entry is validated by trend momentum, strength, and volume surge.
### Key Features that Deliver Results:
* **Bullish-Only Focus:** Eliminates noise and maximizes efficiency by strictly targeting high-conviction long opportunities during peak market hours.
* **Elite Performance:** Backtested for superior results, this strategy boasts an **impressive 81% Win Rate** under optimal market conditions.
* **Adaptive Risk Management:** Utilizes a dynamic **ATR-based Stop-Loss** for micro-losses and a sophisticated multi-stage exit plan (TP1 and Trailing Stop) with an optional **Break-Even Lock-in** to secure profits fast.
* **Fully Automated Ready:** Seamlessly connect the strategy's signals to your brokerage account using TradingView's **Webhooks** feature for 24/7, hands-free automation.
Stop guessing and start trading with an edge. Leverage the power of institutional-grade logic, built for the retail trader. There is also a Holy Grail two way trade scalper. Contact us if you need it.
---
**Ready to transform your trading performance?**
Access the Holy Grail Scalper 2.0 and its full automation capabilities today with our exclusive monthly subscription.
**Monthly Subscription: $250 USD**
(stan.store)
MNQ 12H Swing MNQ 12H Swing — Independent Trades + Push Alerts (Fixed 3-bar Trade Lines)
This strategy is designed for 12-hour MNQ charts and focuses on swing trading setups aligned with the short-term trend.
It uses a 9-period SMA as a directional bias filter to confirm bullish or bearish continuation patterns.
Each entry is triggered when a candle breaks the previous bar’s high/low in the direction of the SMA.
Position sizing is risk-based, using a fixed USD risk per trade divided by the stop size in points.
Stops are determined either by Bar Low/High or an ATR-based multiplier for adaptive volatility control.
Take-profit targets can be defined by fixed points or R-multiples, ensuring flexible reward structures.
Each trade creates fixed horizontal lines (Entry / SL / TP) that persist for exactly 3 bars.
Multiple stacked trades per direction are supported (default 3), with independent management and exits.
The system includes Chandelier ATR trailing stops, optionally activated only after reaching +1R.
Break-even logic allows automatic SL movement to entry once the position gains 1R profit.
Alerts are sent automatically on new entries and trade closures, with detailed PnL reporting.
A visual debug mode highlights valid and invalid setup conditions for transparency and testing.
No hedging is allowed — long and short trades are mutually exclusive by design.
The script enforces strict time-frame validation (12-hour only) to maintain signal integrity.
All SL and TP lines are dynamically recreated if updated (e.g., trailing stop adjustments).
The strategy supports pyramiding (up to 50 total trades) for layered swing scaling.
Each trade instance is tracked with arrays for full state management and line references.
The goal: structured swing trading with precise risk control, automation, and clean visualization.

rakesh option buying strategybest option scalping strategy
this indicator10/20 point esly capture in option buying
manage proper risk reward and execute the trade
start with low quantity believe the indicator than increase your quantity......

Ultra scalper: separate fade + breakout + TP/SL + pyramidingDescription:
The 1-Minute Nasdaq Breakout Strategy is a powerful intraday trading approach designed specifically for traders who thrive in fast-moving market conditions. Built for precision and speed, this strategy identifies key breakout levels on the 1-minute chart, allowing traders to capitalize on rapid momentum shifts and volatility spikes that often occur during the most active trading hours.
By combining real-time price action analysis with smart volatility filters, the strategy helps distinguish between genuine breakouts and false moves, ensuring only high-probability setups are captured. It’s ideal for scalpers and short-term traders who prefer multiple opportunities throughout the session while maintaining a structured risk-to-reward framework.
This strategy works exceptionally well on Nasdaq futures (NQ) or Nasdaq 100 stocks, leveraging the index’s natural volatility to generate quick, consistent profits. When used alongside proper trade management and bias confirmation tools—such as Supertrend, VWAP, or session-based levels—it becomes an invaluable part of any professional intraday trading system.
Whether you’re looking to refine your scalping edge or enhance your breakout playbook, the 1-Minute Nasdaq Breakout Strategy offers the perfect balance of simplicity, precision, and performance.

RSI and EMA Crossover Buy with Exit Conditions and Re-entryRSI WITH MOVING AVERAGES..
RSI and EMA Crossover Buy with Exit Conditions and Re-entry

VCP + TTM Squeeze Breakout StrategyOverview
This strategy combines Mark Minervini’s Volatility Contraction Pattern (VCP) with the TTM Squeeze momentum framework to detect explosive breakouts in strong trending markets.
It identifies periods of volatility contraction within up-trending stocks and executes only when price, momentum, and volume confirm a valid breakout.
The system was designed to be robust and non-optimized, using one set of parameters that performs consistently across multiple stocks and indices without overfitting.
This strategy is based on the previously published “VCP + TTM Squeeze Breakout Detection Tool”, which is a public indicator by the same author.
The strategy expands upon that indicator by adding position management, ATR-based stop logic, Supertrend trailing, and full backtesting functionality.
Core Concept
VCP detects volatility contraction using ATR and volume.
TTM Squeeze measures compression between Bollinger Bands and Keltner Channels.
EMA filter ensures that trades only occur in established uptrends.
Pivot logic tracks recent highs and resets automatically after failed attempts.
Breakout triggers when price closes above pivot, volume exceeds its average, momentum is positive, and—if enabled—the TTM Squeeze releases (green).
Stop-loss is ATR-based and transitions to a Supertrend trailing stop once profits exceed ≈ 1 %.
This creates a mechanical system that mirrors institutional-style breakout trading while minimizing noise and false signals.
Input Parameters
🔹 VCP Settings
VCP Period (10) – ATR lookback for volatility contraction
Pivot Lookback (5) – number of bars used to define resistance
Volatility Tolerance (1.1) – ATR compression threshold
Volume & TrueRange Comparisons (5) – lookbacks for breakout validation
Max Days Active (50) – how long the pattern remains valid
EMA 50 / 100 / 200 – trend filter; must be aligned upward
Use TTM Squeeze (true) – activates compression filter
🔹 TTM Squeeze Settings
Length (20) – core period for BB and KC calculations
Bollinger STD (2.0) – standard deviation multiplier
Keltner Channels (1.5 / 2 / 3) – three compression zones
Green = No Squeeze
Orange/Red/Black = Compression levels
🔹 ATR Stop Loss
ATR Length (14)
Smoothing (RMA)
Multiplier (1.0) – defines distance below swing low
Show Lines (true) – optional visualization
🔹 Trailing Stop (Supertrend)
ATR Length (10)
Factor (3.0) – standard Supertrend setting
Active after ≈ 1 % profit – replaces initial ATR stop
Entry Conditions
Price > EMA 50/100/200 and EMAs in ascending order
ATR indicates volatility contraction (≤ lowest ATR × 1.1)
A Pivot High is set over the last 5 bars
Breakout occurs when:
• Close > Pivot High
• Volume > average of past 5 bars
• Momentum > 0
• (If enabled) TTM Squeeze = No Squeeze (green)
• Price > Supertrend
A new position is entered the next bar when all conditions are true.
Exit Logic
Initial Stop-Loss: Low − ATR × Multiplier
Trailing Stop: Supertrend (ATR 10 × Factor 3) after ≈ 1 % gain
Exit Condition: Triggered if price hits stop or volume/TR drops below average.
Stops are handled through strategy.exit() to ensure immediate execution.
Visualization
Yellow dots = VCP setup (active contraction)
Green dots = active breakout
Red/Blue lines = current stop loss
Green line = entry price
Colored bars (top) = momentum strength
Bottom squares = Squeeze status (green = free, orange/red = compressed)
Performance and Risk Considerations
Designed for daily or 4-hour charts of trending equities or ETFs.
Best results in high-momentum stocks (e.g., tech, growth sectors).
Avoid using on range-bound or low-volume assets.
Typical backtests show a high profit factor (> 2) with controlled drawdowns.
Each trade risks ≈ 1 – 2 % of equity when sized per ATR.
Disclaimer
This strategy is for educational purposes only and does not constitute financial advice.
Past performance from backtesting does not guarantee future results.
Use responsibly and adjust risk according to your account size and broker conditions.

Bitwardex AI AlgoBitwardex AI Algo — Next-Generation Adaptive Market Intelligence
Bitwardex AI Algo is a multi-layered algorithmic trading framework designed to dynamically adapt to changing market structures.
Built upon a synthesis of cluster-based machine learning, stochastic filtering, volatility normalization, and adaptive risk modulation, this strategy operates as a self-adjusting analytical engine for modern traders.
🧠 Core Concept
At the heart of the system lies Adaptive Market Clustering methodology — a hybrid analytical architecture that combines pseudo-K-Means clustering, sigmoid feature normalization, and Gaussian price smoothing.
This unique framework isolates statistically stable price formations in real time, effectively filtering market noise and transient anomalies.
Each market input — price, volatility, momentum, or CCI deviation — is transformed into a unified metric space, where the algorithm identifies equilibrium clusters representing the probabilistic transition between impulse, consolidation, and reversal phases.
The result is a dynamic analytical structure capable of interpreting short-term volatility as contextual, not random.
⚙️ System Architecture
Bitwardex AI Algo operates through several integrated analytical layers:
1. Trend Intelligence Layer
Performs adaptive trend filtering using a combination of multi-timeframe Gaussian smoothing and ATR gradient mapping.
It adjusts sensitivity dynamically, ensuring smooth yet responsive trend detection without excessive lag.
2. Consolidation Risk Control
Evaluates price compression and volatility contraction zones, reducing trade exposure during low-energy phases.
This intelligent modulation maintains strategic consistency by aligning position sizing with structural volatility.
3. Cluster-Based Signal Engine
Applies a custom cluster-learning mechanism that groups market behavior into statistically meaningful formations.
Signals are generated only when probabilistic thresholds align with directional confirmation — significantly minimizing false breakouts and noise.
4. Adaptive Risk Framework
Implements real-time position sizing and leverage calibration.
Includes advanced Martingale control and position cap management, allowing the system to withstand high-volatility environments and event-driven distortions.
5. Multi-Target TP/SL & Breakeven System
Profit targets and stops are dynamically calculated via adaptive ATR- and ROI-based models.
The strategy supports up to four take-profit levels, a flexible trailing stop, and automatic breakeven logic — all clearly visualized on the chart.
6. Visual & Alert Engine
Comprehensive graphical interface displaying trend zones, TP/SL levels, trailing positions, and market phase indicators.
Customizable alerts allow seamless integration into both manual and automated workflows.
📊 Analytical Methods
Gaussian Smoothing Filter – minimizes short-term noise while preserving momentum integrity.
Sigmoid Normalization – aligns nonlinear market features into a comparable probability scale.
K-Means-like Clustering – identifies statistically consistent states of market equilibrium.
ATR-Based Sensitivity Modulation – scales responsiveness according to volatility intensity.
Trend Slope Reinforcement – dynamically adjusts the directional bias based on CCI correlation and mean deviation metrics.
🔍 Use Cases
Intraday mode: optimized for high-frequency environments with adaptive reaction time.
Swing mode: automatically deepens its analytical horizon on higher timeframes.
Analytical mode: may function purely as a market structure diagnostic tool, offering probabilistic context for manual traders.
💡 Visual & Functional Features
Dynamic trend color coding (bullish, bearish, neutral).
Auto-generated support and resistance zones.
Full visualization of entry, exit, TP/SL, trailing, and breakeven levels.
Informative trade panels and label-based data overlays.
User-configurable visual interface for all display elements.
⚠️ Disclaimer
Bitwardex AI Algo does not predict future prices or guarantee profits.
It is a probabilistic analytical framework that assists traders in filtering market noise and identifying contextually significant price behavior.
All performance results are historical simulations and may differ in live trading.
Always test and calibrate parameters according to your personal strategy and risk tolerance.
🇷🇺 Bitwardex AI Algo — интеллектуальная адаптивная стратегия нового поколения
Bitwardex AI Algo — это многоуровневая торговая система, способная адаптироваться к изменению рыночных структур и режимов волатильности.
Она объединяет в себе принципы кластерного машинного обучения, стохастической фильтрации, динамической нормализации волатильности и адаптивного управления рисками, формируя саморегулирующийся аналитический контур.
🧠 Концепция работы
В основе лежит методология Adaptive Market Clustering — гибридная архитектура, сочетающая псевдо-кластеризацию K-Means, сигмоидную нормализацию признаков и гауссово сглаживание ценовых траекторий.
Эта технология позволяет в реальном времени выделять статистически устойчивые ценовые паттерны, отсекая шум и кратковременные всплески.
Каждый поток данных (цена, ATR-волатильность, импульс, CCI-девиация и др.) преобразуется в унифицированное пространство признаков, где алгоритм выявляет зоны равновесия рынка, интерпретируя их как вероятностные переходы между импульсом, консолидацией и разворотом.
⚙️ Архитектура стратегии
1. Trend Intelligence Layer
Адаптивный тренд-фильтр с мультитаймфреймной логикой и гауссовым сглаживанием.
Он динамически изменяет чувствительность в зависимости от силы тренда и рыночного шума.
2. Consolidation Risk Control
Анализирует периоды сжатия диапазонов и снижает торговую активность во время консолидации.
Таким образом, стратегия регулирует риск и размер позиции пропорционально рыночной динамике.
3. Cluster-Based Signal Engine
Использует кластерное самообучение для выделения устойчивых рыночных состояний и формирования сигналов только при совпадении вероятностных и трендовых факторов.
4. Adaptive Risk Framework
Модуль управления капиталом, использующий динамическое перераспределение объёма, гибкое плечо и ограничения на максимальный риск.
Поддерживает модели Мартингейла и контроль агрессивности входов.
5. TP/SL & Breakeven System
Формирует многоуровневые цели прибыли (до 4 уровней TP), трейлинг-стоп, безубыточную зону и визуальное отображение всех параметров на графике.
6. Visual Analytics & Alert Engine
Отрисовывает все ключевые элементы: зоны тренда, TP/SL, trailing-уровни, зоны консолидации, а также уведомления о сигналах.
Поддерживает гибкую настройку интерфейса и формата уведомлений.
📊 Применяемые методы
Гауссово сглаживание для подавления шумов при сохранении инерции тренда.
Сигмоидная нормализация для унификации нелинейных параметров.
Псевдо-кластеризация K-Means для выделения равновесных рыночных состояний.
ATR-адаптация чувствительности для масштабирования под текущую волатильность.
Реинфорсмент угла тренда на основе CCI-корреляций и отклонений цены.
🔍 Режимы работы
Интрадей — для краткосрочной динамики и высокой реактивности.
Свинг-режим — оптимизация под среднесрочные сценарии.
Аналитический — используется как диагностический инструмент для оценки структуры рынка.
💡 Особенности визуализации
Цветовая идентификация фаз (тренд/флэт/разворот).
Автоматическая отрисовка уровней поддержки и сопротивления.
Подробное отображение TP/SL, трейлинг-зон и входов.
Информационные таблицы и визуальные метки позиций.
Полная кастомизация всех визуальных элементов под пользователя.
⚠️ Предупреждение
Bitwardex AI Algo не является инструментом прогнозирования и не гарантирует прибыль.
Это статистическая адаптивная система, направленная на фильтрацию рыночного шума и оценку вероятностных сценариев движения цены.
Перед использованием рекомендуется провести собственное тестирование и оптимизацию параметров под индивидуальный стиль торговли.

Evergreen Solutions - ONEOverview
ONE is an adaptive strategy designed for all markets that captures short-term momentum in high-volatility conditions. It integrates RSI, volume analysis, chop filters, standard moving averages, and custom moving averages to identify when markets shift from range-based choppiness to high-probability opportunities. The system is structured to be reactive, focusing on trades with strong volatility expansion and statistically favorable win potential.
How to Use It
- Equities: A reliable options or swing-trading companion for large-cap tickers.
- Futures: Refined for intraday structure on index products (NQ, ES, RTY, GC, CL, YM).
- Forex: Designed to reduce false starts on illiquid currency pairs.
- Digital Assets: Tailored for the volatility of 24/7 markets while maintaining composure in high volatility.
When ONE executes a trade, a SL and TP plot is generated. These plots serve as delineated boundaries for the trade. Simply place your SL and TP, and walk away.
Modes of Operation
ONE Mode – A single-entry, single-exit design for simplicity.
Breakeven Mode – Shifts the stop to entry once a defined profit threshold is met, protecting capital in uncertain markets.
Multi Mode – Scales entries and exits to capture extended runs and adapt to different volatility regimes.
Conceptual Logic
Trend Detection: Uses custom and standard moving averages to define short-term directional bias.
Volatility Filter: Custom chop filters suppress trades during ranging price action.
Momentum Signal: RSI combined with volume analysis highlights moments of rapid volatility expansion and strong price acceleration.
Execution Rule: All trades trigger only on bar open; no repainting or lookahead data is used.
What Makes ONE Different
ONE’s originality lies in its adaptive trade-management modes and the integration of multiple filters (RSI + volume + choppiness + adaptive MAs) into a single framework. This reduces conflicting signals, emphasizes risk control, and keeps decision-making transparent for the trader.
- Consistency: ONE adapts seamlessly to all markets. It does not rely on hidden market structure; its design is universal.
- Simplicity: No learning curve. ONE was built so any trader — beginner or advanced — can trade immediately.
- Risk: Every mode respects capital preservation. Decisions are made to avoid catastrophic losses.
- Transparency: New positions enter only on bar open, with no hidden repainting or misleading lookaheads.
- Structure: ONE reflects the discipline of professional trading: structured, rules-based, and repeatable under changing conditions.
Backtest Defaults
Symbol: CME_MINI:NQ1!
Backtest range: Oct 31, 2024 – Oct 6, 2025
Account size: $10,000
Total trades: 859
Win rate: 62%
Total P&L: $113,160
Profit factor: 1.32
Sharpe ratio: 0.78
Sortino ratio: 5.78
Limitations
ONE does not guarantee profits. Effectiveness depends on liquidity, volatility, and market conditions. Past results do not imply future returns.

Galac III SOXL - Galac — SOXL strategy (long only). Purpose: swing trading leveraged semiconductor ETF (SOXL) with volatility‑aware position sizing. Core components: adaptive EMAs as trend filter, relative volume confirmation, volatility-adjusted position sizing and dynamic take-profit / stop-loss management. Default parameters: EMA_short=20, EMA_long=50, vol_rel_period=20, default stop ≈6% per trade. Backtests run with commissions=0.05% and slippage=0.2%. Backtest sample and timeframe are included in the attached results. Not intended for scalping. Risks and limitations: performs best in trending environments; may underperform in choppy, low-volume conditions. Past performance ≠ future results.

Ajay R5.41🔻 Ajay Gold 3H Sell Power Indicator 🔻
Precision-Based Smart Sell System for Gold (XAU/USD)
💡 Overview
This indicator is specifically designed for Gold (XAU/USD) and delivers best results on the 3-Hour Timeframe (3H TF).
It is a Smart Money Logic-based Sell Confirmation System, combining institutional structure and candle behavior to generate highly accurate bearish signals.
⚙️ Technical Foundation
The indicator uses multiple advanced confirmations:
📉 EMA Trend Filter → Confirms downtrend
💪 RSI Overbought Rejection → Momentum reversal signal
📊 MACD Bearish Cross → Confirms trend strength
🕯️ Bearish Candle Structure → Price action validation
When all conditions align, a clear 🔻 Sell Signal is plotted on the chart.
💎 Hidden Feature
This indicator includes a hidden feature that activates only when the correct market structure forms.
It helps reduce false signals and increases accuracy without being visible on the chart — fully automated internal logic.
📆 Recommended Settings
Symbol: XAU/USD (Gold)
Timeframe: 3-Hour (3H)
Market: Forex / Commodity
Mode: Sell-Only Confirmation Indicator
Performance: Best precision and consistency on 3H TF
📈 How to Use
Select XAU/USD on chart and set 3H timeframe.
Add the indicator to the chart.
Wait for the 🔻 Sell Signal and confirm the market structure after candle close.
Take entry according to your risk management.
⚠️ Disclaimer
This indicator is for educational and analytical purposes only.
No system is 100% accurate — always backtest and demo trade before using in real trading.
💬 Credits
Developed by Ajay Sahu (India)
Based on Institutional & Smart Money Logic
Best results on 3H TF
Hidden Algorithm for XAU/USD traders

Ajay R5.41🔻 Ajay Gold 3H Power Indicator 🔻
Precision-Based Smart Sell System for Gold (XAU/USD)
💡 Overview
This indicator is specifically designed for Gold (XAU/USD) and delivers best results on the 3-Hour Timeframe (3H TF).
It is a Smart Money Logic-based Sell Confirmation System, combining institutional structure and candle behavior to generate highly accurate bearish signals.
⚙️ Technical Foundation
The indicator uses multiple advanced confirmations:
📉 EMA Trend Filter → Confirms downtrend
💪 RSI Overbought Rejection → Momentum reversal signal
📊 MACD Bearish Cross → Confirms trend strength
🕯️ Bearish Candle Structure → Price action validation
When all conditions align, a clear 🔻 Sell Signal is plotted on the chart.
💎 Hidden Feature
This indicator includes a hidden feature that activates only when the correct market structure forms.
It helps reduce false signals and increases accuracy without being visible on the chart — fully automated internal logic.
📆 Recommended Settings
Symbol: XAU/USD (Gold)
Timeframe: 3-Hour (3H)
Market: Forex / Commodity
Mode: Sell-Only Confirmation Indicator
Performance: Best precision and consistency on 3H TF
📈 How to Use
Select XAU/USD on chart and set 3H timeframe.
Add the indicator to the chart.
Wait for the 🔻 Sell Signal and confirm the market structure after candle close.
Take entry according to your risk management.
⚠️ Disclaimer
This indicator is for educational and analytical purposes only.
No system is 100% accurate — always backtest and demo trade before using in real trading.
💬 Credits
Developed by Ajay Sahu (India)
Based on Institutional & Smart Money Logic
Best results on 3H TF
Hidden Algorithm for XAU/USD traders
