Benchmark Relative Performance BRPBenchmark Relative Performance (BRP) is a comprehensive technical analysis tool that compares any stock's performance against a chosen benchmark (QQQ, SPY, IWM, etc.) to identify outperformance and underperformance patterns.
Key Features:
Dual-line visualization: Shows both ticker and relative strength performance
Dynamic color coding: 5-level color system indicating performance strength
Customizable benchmark: Choose from any ticker via TradingView's symbol picker
Volume weighting: Optional volume analysis for stronger signal confirmation
Performance zones: Visual thresholds for strong/moderate performance levels
Compact info table: Real-time performance status and values
What It Shows:
Benchmark Performance Line (Blue): Shows your chosen benchmark's percentage performance
Relative Strength Line (Color-coded): Shows how much the ticker outperforms/underperforms
Fill Area: Visual gap between ticker and benchmark performance
Performance Zones: Dotted lines marking significant performance thresholds
Color System:
Green: Strong outperformance (above custom threshold)
Lime: Standard outperformance
Yellow: Neutral/Equal performance
Orange: Standard underperformance
Red: Strong underperformance (below custom threshold)
Best Used For:
Stock selection and rotation strategies
Sector/ETF relative strength analysis
Identifying momentum shifts vs benchmarks
Portfolio performance evaluation
Market timing based on relative performance
Settings:
Customizable lookback period (default: 20)
Adjustable strong performance threshold (default: 5%)
Optional volume weighting factor
Full table customization (position, colors, fonts)
Performance display (percentage or decimal)
Perfect for traders and investors who want to identify stocks showing relative strength or weakness compared to major market benchmarks.
Indicators and strategies

TRUMP FACTORTrump factor index reflect hoe trump anthycs and politics affect the wolrd and how USA perform against the rest of the world

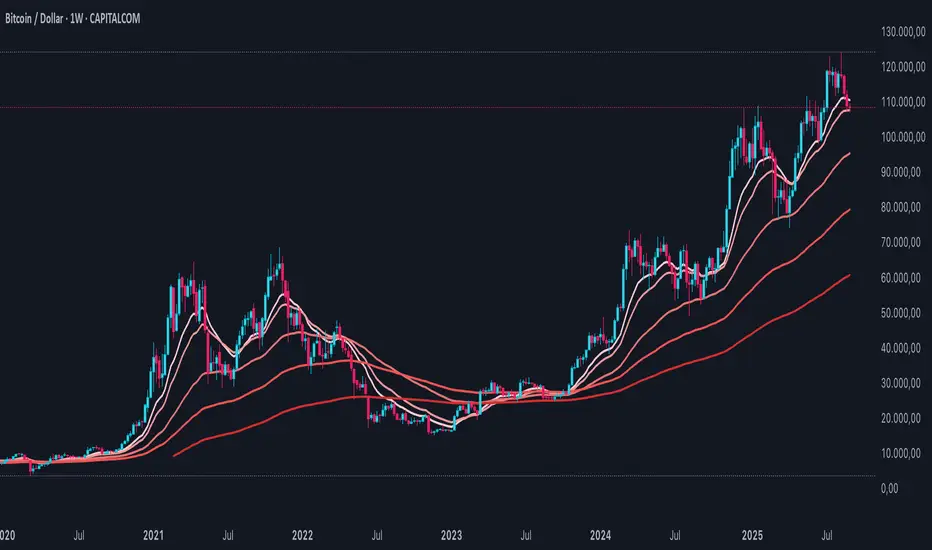
BTC Power-Law Decay Channel Oscillator (0–100)🟠 BTC Power-Law Decay Channel Oscillator (0–100)
This indicator calculates Bitcoin’s position inside its long-term power-law decay channel and normalizes it into an easy-to-read 0–100 oscillator.
🔎 Concept
Bitcoin’s long-term price trajectory can be modeled by a log-log power-law channel.
A baseline is fitted, then an upper band (excess/euphoria) and a lower band (capitulation/fear).
The oscillator shows where the current price sits between those bands:
0 = near the lower band (historical bottoms)
100 = near the upper band (historical tops)
📊 How to Read
Oscillator > 80 → euphoric excess, often cycle tops
Oscillator < 20 → capitulation, often cycle bottoms
Works best on weekly or bi-weekly timeframes.
⚙️ Adjustable Parameters
Anchor date: starting point for the power-law fit (default: 2011).
Smoothing days: moving average applied to log-price (default: 365 days).
Upper / Lower multipliers: scale the bands to align with historical highs and lows.
✅ Best Use
Combine with other cycle signals (dominance ratios, macro indicators, sentiment).
Designed for long-term cycle analysis, not intraday trading.

DTC Intra+DTC Intra+
Complete Indian Intraday Trading Indicator
What This Indicator Does:
DTC Intra+ is a comprehensive intraday trading indicator designed specifically for Indian markets. It provides real-time session analysis, volume profiling, and technical insights that work consistently across all timeframes.
Key Features:
Multi-Timeframe Data Consistency
Solves the common problem where indicators show different values on different timeframes
Gap percentage, ADR (Average Daily Range), and Burst values remain consistent whether viewing 1-minute or daily charts
Uses proprietary algorithms to fetch daily data and apply it accurately to intraday calculations
Intelligent Session Detection
Automatically detects and displays three Indian market sessions: Morning (9:15-11:00 AM), Mid-Day (11:00-1:30 PM), Afternoon (1:30-3:30 PM)
Creates visual session boxes that extend dynamically and finalize at session boundaries
Each session maintains distinct colors and labels for easy identification
Advanced Volume Analysis
Calculates Relative Volume (RVol) using 21-period moving average for volume strength assessment
Colors candles based on volume strength: high/moderate bullish and bearish volume patterns
Customizable volume thresholds (150% and 200% of average volume) for precise signal generation
Pattern Recognition System
Identifies mini-coil consolidation patterns with customizable styling options
Maintains visual persistence across timeframes and chart updates
Configurable lookback periods and pattern validation algorithms
Technical Analysis Tools
Four customizable Moving Averages (10, 20, 50, 200) with multiple calculation types (SMA, EMA, WMA, HMA)
VWAP integration with theme-adaptive styling
Gap analysis with customizable thresholds (1% and 2%+) and visual alerts
Theme-Adaptive Interface
Automatically detects and adapts to dark or light chart themes
Professional color schemes optimized for both theme types
Customizable transparency and styling for all visual elements
Information Dashboard
Dynamic information table displaying Gap %, RVol, ADR, Burst, Sector, Industry, Theme, and Session data
Real-time sector and industry classification from TradingView data
Burst Ranker with descriptive labels (GREAT, GOOD, LOW) based on historical performance analysis
How It Works:
Session Management:
The indicator uses time-based detection algorithms to identify Indian market sessions, creating visual boxes that extend dynamically and finalize at session boundaries. Each session maintains its own color scheme and label system.
Data Consistency Engine:
Proprietary cross-timeframe calculation system ensures that daily metrics display consistently across all timeframes by fetching daily data and applying it to intraday calculations.
Volume Profiling:
Custom volume analysis algorithms calculate relative volume strength and apply color coding to candles based on volume thresholds and price direction, providing immediate visual feedback on market activity.
Pattern Detection:
Advanced consolidation pattern recognition system that identifies mini-coil formations using customizable parameters and maintains visual persistence across chart updates.
How To Use:
Apply to any Indian stock chart (BSE, NSDL) on intraday timeframes
Session times are pre-configured for Indian markets but can be customized
Moving Averages can be adjusted to your preferred lengths and calculation types
Volume thresholds can be modified based on your trading strategy
Monitor the information panel for real-time market insights
Use session boxes to identify optimal trading windows
Who This Is For:
Indian intraday traders seeking comprehensive market analysis
Traders who need consistent data across multiple timeframes
Volume-based traders requiring real-time volume strength analysis
Technical analysts needing session-based market structure insights
Busy professionals who want market insights without constant chart monitoring
What Makes It Unique:
Unlike basic session indicators, DTC Intra+ provides cross-timeframe data consistency, advanced volume profiling, and comprehensive Indian market analysis in a single, theme-adaptive interface. The proprietary algorithms ensure accurate daily metrics on intraday charts, making it essential for serious Indian market traders who need reliable, consistent data across all timeframes.
The Bottom Line:
This indicator transforms how you view Indian intraday markets by providing consistent, reliable data across all timeframes while offering advanced session analysis, volume profiling, and pattern recognition. It's designed specifically for Indian market characteristics and trading patterns, giving you the tools to trade with confidence and precision.


Ultimate EMA (Futures) - (Moneybytomorrow)This Indicator is still in the Beta phase and set for testing. Enjoy! - Made for Futures Trading in mind but can be used for stocks etc.

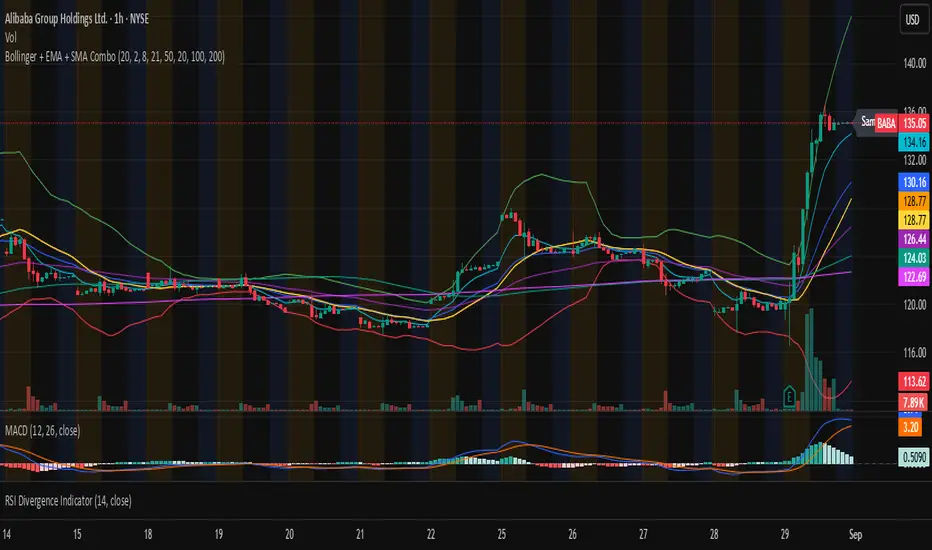
Bollinger + EMA + SMA Combo to match ToWIt allows to select Standard Std or Popular Std when calculating Bollinger to match the Bollinger indicator on ToW.
svm tikole ADX rsi How this works:
ADX checks trend strength. (Above 25 = strong trend)
RSI confirms momentum (above 50 = bullish, below 50 = bearish).
Strong Buy = ADX strong + DI+ > DI– + RSI > 50.
Strong Sell = ADX strong + DI– > DI+ + RSI < 50.
Buy/Sell labels are plotted on chart.
RSI panel included as optional.
👉 This script is error-free and gives clear strong buy/sell signals.

VX_ToolsLibrary "VX_Tools"
calcSpread(frontClose, nextClose)
Parameters:
frontClose (float)
nextClose (float)
bearishReversal(o, h, l, c, minUpperWickMult, maxLowerWickMult, wickFlexFactor, smallBodyThreshold, requireSmallBody, trendBars)
Parameters:
o (float)
h (float)
l (float)
c (float)
minUpperWickMult (float)
maxLowerWickMult (float)
wickFlexFactor (float)
smallBodyThreshold (float)
requireSmallBody (bool)
trendBars (int)

Trade Life Balance Multi EMAThe Trade Life Balance EMA Indicator is a versatile and essential tool for technical analysts and traders. It combines five of the most commonly used Exponential Moving Averages (EMAs) into a single indicator, and additionally offers two optional EMAs for advanced analysis. This indicator helps to quickly identify trend direction, dynamic support and resistance levels, and potential entry and exit points.
Important Note:
Moving averages are lagging indicators, meaning they are based on past price data and do not predict future price movements. For a comprehensive market analysis, it is highly recommended to use the TLB EMA indicator in combination with other analytical tools such as volume, price action, and oscillators.
How the TLB EMA Indicator Works
The indicator plots multiple Exponential Moving Averages directly on the price chart. An EMA is a type of moving average that gives more weight and significance to the most recent price data, making it more responsive to price changes than a Simple Moving Average (SMA).
Default Configuration:
The indicator comes pre-configured with five core EMAs that play a crucial role in many trading strategies:
EMA 13 & 20: Often used as short-term trend indicators. Their slope and the distance to the price can indicate the strength of the current momentum.
EMA 50: Considered an important mid-term trend indicator. A price holding above the 50 EMA often suggests a healthy uptrend.
EMA 100: Serves as a mid- to long-term trend filter.
EMA 200: Widely regarded as the decisive line between a long-term bull and bear market.
The color scheme, ranging from light red (fastest EMA) to dark red (slowest EMA), facilitates quick visual identification.
Customization Options
The TLB EMA indicator is fully customizable to suit individual trading strategies and preferences:
EMA Lengths: All five standard EMAs, as well as the two optional ones, can be set to any desired length in the "Inputs" settings.
Optional EMAs: Two additional EMAs are disabled by default. They can be activated via a checkbox to supplement the analysis with other user-defined periods (e.g., for Fibonacci numbers or specific strategies).
Visual Style: In the "Style" tab of the indicator settings, the color, thickness, and visibility of each individual EMA line can be adjusted as desired.
Advantages of the TLB EMA Indicator
All-in-One Solution: Consolidates the most important EMAs into a single indicator, keeping the chart view clean and eliminating the need to add multiple individual indicators.
High Flexibility: With fully customizable lengths and two optional EMAs, the indicator can be configured for any strategy and any market (stocks, forex, crypto, etc.).
Visual Clarity: The pre-configured color coding allows for an intuitive and quick interpretation of the different trend speeds.
Efficiency: Saves time in chart setup and analysis.
Using the TLB EMA Indicator
The TLB EMA can be used in various ways in trading:
Trend Identification: The simplest application is to determine the overall trend. If the price is above the EMAs (especially the 200), it indicates an uptrend. If it is below, the trend is downward.
Dynamic Support and Resistance: In an uptrend, the EMAs often act as dynamic support zones where the price can bounce. In a downtrend, they serve as dynamic resistance zones.
Crossover Signals: The crossing of EMAs can generate trading signals. A "Golden Cross" (e.g., the 50 EMA crosses above the 200 EMA) is considered a bullish signal, while a "Death Cross" (50 EMA crosses below the 200 EMA) is considered a bearish signal.
Please note that the TLB EMA indicator is a tool for analysis and does not guarantee profitable trades. Always use it in conjunction with a solid risk management strategy.
PnL Bubble [%] | Fractalyst1. What's the indicator purpose?
The PnL Bubble indicator transforms your strategy's trade PnL percentages into an interactive bubble chart with professional-grade statistics and performance analytics. It helps traders quickly assess system profitability, understand win/loss distribution patterns, identify outliers, and make data-driven strategy improvements.
How does it work?
Think of this indicator as a visual report card for your trading performance. Here's what it does:
What You See
Colorful Bubbles: Each bubble represents one of your trades
Blue/Cyan bubbles = Winning trades (you made money)
Red bubbles = Losing trades (you lost money)
Bigger bubbles = Bigger wins or losses
Smaller bubbles = Smaller wins or losses
How It Organizes Your Trades:
Like a Photo Album: Instead of showing all your trades at once (which would be messy), it shows them in "pages" of 500 trades each:
Page 1: Your first 500 trades
Page 2: Trades 501-1000
Page 3: Trades 1001-1500, etc.
What the Numbers Tell You:
Average Win: How much money you typically make on winning trades
Average Loss: How much money you typically lose on losing trades
Expected Value (EV): Whether your trading system makes money over time
Positive EV = Your system is profitable long-term
Negative EV = Your system loses money long-term
Payoff Ratio (R): How your average win compares to your average loss
R > 1 = Your wins are bigger than your losses
R < 1 = Your losses are bigger than your wins
Why This Matters:
At a Glance: You can instantly see if you're a profitable trader or not
Pattern Recognition: Spot if you have more big wins than big losses
Performance Tracking: Watch how your trading improves over time
Realistic Expectations: Understand what "average" performance looks like for your system
The Cool Visual Effects:
Animation: The bubbles glow and shimmer to make the chart more engaging
Highlighting: Your biggest wins and losses get extra attention with special effects
Tooltips: hover any bubble to see details about that specific trade.
What are the underlying calculations?
The indicator processes trade PnL data using a dual-matrix architecture for optimal performance:
Dual-Matrix System:
• Display Matrix (display_matrix): Bounded to 500 trades for rendering performance
• Statistics Matrix (stats_matrix): Unbounded storage for complete statistical accuracy
Trade Classification & Aggregation:
// Separate wins, losses, and break-even trades
if val > 0.0
pos_sum += val // Sum winning trades
pos_count += 1 // Count winning trades
else if val < 0.0
neg_sum += val // Sum losing trades
neg_count += 1 // Count losing trades
else
zero_count += 1 // Count break-even trades
Statistical Averages:
avg_win = pos_count > 0 ? pos_sum / pos_count : na
avg_loss = neg_count > 0 ? math.abs(neg_sum) / neg_count : na
Win/Loss Rates:
total_obs = pos_count + neg_count + zero_count
win_rate = pos_count / total_obs
loss_rate = neg_count / total_obs
Expected Value (EV):
ev_value = (avg_win × win_rate) - (avg_loss × loss_rate)
Payoff Ratio (R):
R = avg_win ÷ |avg_loss|
Contribution Analysis:
ev_pos_contrib = avg_win × win_rate // Positive EV contribution
ev_neg_contrib = avg_loss × loss_rate // Negative EV contribution
How to integrate with any trading strategy?
Equity Change Tracking Method:
//@version=6
strategy("Your Strategy with Equity Change Export", overlay=true)
float prev_trade_equity = na
float equity_change_pct = na
if barstate.isconfirmed and na(prev_trade_equity)
prev_trade_equity := strategy.equity
trade_just_closed = strategy.closedtrades != strategy.closedtrades
if trade_just_closed and not na(prev_trade_equity)
current_equity = strategy.equity
equity_change_pct := ((current_equity - prev_trade_equity) / prev_trade_equity) * 100
prev_trade_equity := current_equity
else
equity_change_pct := na
plot(equity_change_pct, "Equity Change %", display=display.data_window)
Integration Steps:
1. Add equity tracking code to your strategy
2. Load both strategy and PnL Bubble indicator on the same chart
3. In bubble indicator settings, select your strategy's equity tracking output as data source
4. Configure visualization preferences (colors, effects, page navigation)
How does the pagination system work?
The indicator uses an intelligent pagination system to handle large trade datasets efficiently:
Page Organization:
• Page 1: Trades 1-500 (most recent)
• Page 2: Trades 501-1000
• Page 3: Trades 1001-1500
• Page N: Trades to
Example: With 1,500 trades total (3 pages available):
• User selects Page 1: Shows trades 1-500
• User selects Page 4: Automatically falls back to Page 3 (trades 1001-1500)
5. Understanding the Visual Elements
Bubble Visualization:
• Color Coding: Cyan/blue gradients for wins, red gradients for losses
• Size Mapping: Bubble size proportional to trade magnitude (larger = bigger P&L)
• Priority Rendering: Largest trades displayed first to ensure visibility
• Gradient Effects: Color intensity increases with trade magnitude within each category
Interactive Tooltips:
Each bubble displays quantitative trade information:
tooltip_text = outcome + " | PnL: " + pnl_str +
" Date: " + date_str + " " + time_str +
" Trade #" + str.tostring(trade_number) + " (Page " + str.tostring(active_page) + ")" +
" Rank: " + str.tostring(rank) + " of " + str.tostring(n_display_rows) +
" Percentile: " + str.tostring(percentile, "#.#") + "%" +
" Magnitude: " + str.tostring(magnitude_pct, "#.#") + "%"
Example Tooltip:
Win | PnL: +2.45%
Date: 2024.03.15 14:30
Trade #1,247 (Page 3)
Rank: 5 of 347
Percentile: 98.6%
Magnitude: 85.2%
Reference Lines & Statistics:
• Average Win Line: Horizontal reference showing typical winning trade size
• Average Loss Line: Horizontal reference showing typical losing trade size
• Zero Line: Threshold separating wins from losses
• Statistical Labels: EV, R-Ratio, and contribution analysis displayed on chart
What do the statistical metrics mean?
Expected Value (EV):
Represents the mathematical expectation per trade in percentage terms
EV = (Average Win × Win Rate) - (Average Loss × Loss Rate)
Interpretation:
• EV > 0: Profitable system with positive mathematical expectation
• EV = 0: Break-even system, profitability depends on execution
• EV < 0: Unprofitable system with negative mathematical expectation
Example: EV = +0.34% means you expect +0.34% profit per trade on average
Payoff Ratio (R):
Quantifies the risk-reward relationship of your trading system
R = Average Win ÷ |Average Loss|
Interpretation:
• R > 1.0: Wins are larger than losses on average (favorable risk-reward)
• R = 1.0: Wins and losses are equal in magnitude
• R < 1.0: Losses are larger than wins on average (unfavorable risk-reward)
Example: R = 1.5 means your average win is 50% larger than your average loss
Contribution Analysis (Σ):
Breaks down the components of expected value
Positive Contribution (Σ+) = Average Win × Win Rate
Negative Contribution (Σ-) = Average Loss × Loss Rate
Purpose:
• Shows how much wins contribute to overall expectancy
• Shows how much losses detract from overall expectancy
• Net EV = Σ+ - Σ- (Expected Value per trade)
Example: Σ+: 1.23% means wins contribute +1.23% to expectancy
Example: Σ-: -0.89% means losses drag expectancy by -0.89%
Win/Loss Rates:
Win Rate = Count(Wins) ÷ Total Trades
Loss Rate = Count(Losses) ÷ Total Trades
Shows the probability of winning vs losing trades
Higher win rates don't guarantee profitability if average losses exceed average wins
7. Demo Mode & Synthetic Data Generation
When using built-in sources (close, open, etc.), the indicator generates realistic demo trades for testing:
if isBuiltInSource(source_data)
// Generate random trade outcomes with realistic distribution
u_sign = prand(float(time), float(bar_index))
if u_sign < 0.5
v_push := -1.0 // Loss trade
else
// Skewed distribution favoring smaller wins (realistic)
u_mag = prand(float(time) + 9876.543, float(bar_index) + 321.0)
k = 8.0 // Skewness factor
t = math.pow(u_mag, k)
v_push := 2.5 + t * 8.0 // Win trade
Demo Characteristics:
• Realistic win/loss distribution mimicking actual trading patterns
• Skewed distribution favoring smaller wins over large wins
• Deterministic randomness for consistent demo results
• Includes jitter effects to prevent visual overlap
8. Performance Limitations & Optimizations
Display Constraints:
points_count = 500 // Maximum 500 dots per page for optimal performance
Pine Script v6 Limits:
• Label Count: Maximum 500 labels per indicator
• Line Count: Maximum 100 lines per indicator
• Box Count: Maximum 50 boxes per indicator
• Matrix Size: Efficient memory management with dual-matrix system
Optimization Strategies:
• Pagination System: Handle unlimited trades through 500-trade pages
• Priority Rendering: Largest trades displayed first for maximum visibility
• Dual-Matrix Architecture: Separate display (bounded) from statistics (unbounded)
• Smart Fallback: Automatic page clamping prevents empty displays
Impact & Workarounds:
• Visual Limitation: Only 500 trades visible per page
• Statistical Accuracy: Complete dataset used for all calculations
• Navigation: Use page input to browse through entire trade history
• Performance: Smooth operation even with thousands of trades
9. Statistical Accuracy Guarantees
Data Integrity:
• Complete Dataset: Statistics matrix stores ALL trades without limit
• Proper Aggregation: Separate tracking of wins, losses, and break-even trades
• Mathematical Precision: Pine Script v6's enhanced floating-point calculations
• Dual-Matrix System: Display limitations don't affect statistical accuracy
Calculation Validation:
// Verified formulas match standard trading mathematics
avg_win = pos_sum / pos_count // Standard average calculation
win_rate = pos_count / total_obs // Standard probability calculation
ev_value = (avg_win * win_rate) - (avg_loss * loss_rate) // Standard EV formula
Accuracy Features:
• Mathematical Correctness: Formulas follow established trading statistics
• Data Preservation: Complete dataset maintained for all calculations
• Precision Handling: Proper rounding and boundary condition management
• Real-Time Updates: Statistics recalculated on every new trade
10. Advanced Technical Features
Real-Time Animation Engine:
// Shimmer effects with sine wave modulation
offset = math.sin(shimmer_t + phase) * amp
// Dynamic transparency with organic flicker
new_transp = math.min(flicker_limit, math.max(-flicker_limit, cur_transp + dir * flicker_step))
• Sine Wave Shimmer: Dynamic glowing effects on bubbles
• Organic Flicker: Random transparency variations for natural feel
• Extreme Value Highlighting: Special visual treatment for outliers
• Smooth Animations: Tick-based updates for fluid motion
Magnitude-Based Priority Rendering:
// Sort trades by magnitude for optimal visual hierarchy
sort_indices_by_magnitude(values_mat)
• Largest First: Most important trades always visible
• Intelligent Sorting: Custom bubble sort algorithm for trade prioritization
• Performance Optimized: Efficient sorting for real-time updates
• Visual Hierarchy: Ensures critical trades never get hidden
Professional Tooltip System:
• Quantitative Data: Pure numerical information without interpretative language
• Contextual Ranking: Shows trade position within page dataset
• Percentile Analysis: Performance ranking as percentage
• Magnitude Scaling: Relative size compared to page maximum
• Professional Format: Clean, data-focused presentation
11. Quick Start Guide
Step 1: Add Indicator
• Search for "PnL Bubble | Fractalyst" in TradingView indicators
• Add to your chart (works on any timeframe)
Step 2: Configure Data Source
• Demo Mode: Leave source as "close" to see synthetic trading data
• Strategy Mode: Select your strategy's PnL% output as data source
Step 3: Customize Visualization
• Colors: Set positive (cyan), negative (red), and neutral colors
• Page Navigation: Use "Trade Page" input to browse trade history
• Visual Effects: Built-in shimmer and animation effects are enabled by default
Step 4: Analyze Performance
• Study bubble patterns for win/loss distribution
• Review statistical metrics: EV, R-Ratio, Win Rate
• Use tooltips for detailed trade analysis
• Navigate pages to explore full trade history
Step 5: Optimize Strategy
• Identify outlier trades (largest bubbles)
• Analyze risk-reward profile through R-Ratio
• Monitor Expected Value for system profitability
• Use contribution analysis to understand win/loss impact
12. Why Choose PnL Bubble Indicator?
Unique Advantages:
• Advanced Pagination: Handle unlimited trades with smart fallback system
• Dual-Matrix Architecture: Perfect balance of performance and accuracy
• Professional Statistics: Institution-grade metrics with complete data integrity
• Real-Time Animation: Dynamic visual effects for engaging analysis
• Quantitative Tooltips: Pure numerical data without subjective interpretations
• Priority Rendering: Intelligent magnitude-based display ensures critical trades are always visible
Technical Excellence:
• Built with Pine Script v6 for maximum performance and modern features
• Optimized algorithms for smooth operation with large datasets
• Complete statistical accuracy despite display optimizations
• Professional-grade calculations matching institutional trading analytics
Practical Benefits:
• Instantly identify system profitability through visual patterns
• Spot outlier trades and risk management issues
• Understand true risk-reward profile of your strategies
• Make data-driven decisions for strategy optimization
• Professional presentation suitable for performance reporting
Disclaimer & Risk Considerations:
Important: Historical performance metrics, including positive Expected Value (EV), do not guarantee future trading success. Statistical measures are derived from finite sample data and subject to inherent limitations:
• Sample Bias: Historical data may not represent future market conditions or regime changes
• Ergodicity Assumption: Markets are non-stationary; past statistical relationships may break down
• Survivorship Bias: Strategies showing positive historical EV may fail during different market cycles
• Parameter Instability: Optimal parameters identified in backtesting often degrade in forward testing
• Transaction Cost Evolution: Slippage, spreads, and commission structures change over time
• Behavioral Factors: Live trading introduces psychological elements absent in backtesting
• Black Swan Events: Extreme market events can invalidate statistical assumptions instantaneously

Gaussian Channel Strategy – GC + Kijun + VAPI Gate Gaussian Channel Strategy – Description
This strategy combines multiple technical tools into a rules-based trading system designed for crypto and other volatile markets. The main components are:
- **Gaussian Channel (GC):** Acts as the core trend filter. When price is above the Gaussian filter, conditions favor longs; when below, shorts are favored. The channel bands (high/low) also provide visual guidance of volatility and dynamic support/resistance.
- **Kijun-Sen (Ichimoku baseline, period 120):** Serves as a secondary trend filter. Long trades are only considered if price is above the Kijun-Sen, shorts only if price is below.
- **VAPI (Volume Accumulation Percentage Indicator):** Adds a volume confirmation layer. Long setups require positive accumulation, while short setups require negative accumulation. This helps to filter out low-volume and false signals.
- **Risk Management (ATR):** Stop-losses are set at 3× the ATR distance from entry, dynamically adjusting to volatility. Position sizing is calculated as a percentage of account equity at risk per trade.
- **Take Profit & Trailing Exit:** Positions are split into two legs. Leg A (30% of size) takes fixed profit at 0.75× the stop-loss distance (RR 0.75). Leg B (70% of size) uses a trailing stop that follows price with an ATR-based buffer, aiming to capture extended moves.
- **Trade Management:** Long and short entries are triggered only when all three conditions (GC, Kijun, VAPI) align. Exits are handled automatically through fixed TP, SL, and trailing stops.
Overall, the strategy seeks to balance safety and trend-following by combining a smooth Gaussian filter with trend/volume confirmation and adaptive risk management.

Machine Learning Z-Score Buy and Sell [SS]Hey everyone,
Releasing this Z-Score based buy and sell indicator.
What it does
This indicator:
Uses Z-score and trend to identify potential buy and sell areas.
Signals those buy and sell areas and provides a target price based on the mean.
Plots the target price for buy and sell signals as a red line (for sell signals) or green line (for buy signals).
Has some "machine learning" aspects, namely, it is able to auto select its lookback length based on its analysis of the trend using Pienscript's trend correlation function iterated over multiple lengths, in order for the indicator to identify:
a) The strongest trend; and
b) The correct target price
What is Z-Score
Z-Score is a measure of the mean. Thus, this is a mean reverting type strategy, as it uses z-score to determine price's distance from the mean (or a Z-Score of 0) and then it looks at historic deviations from the mean to signal the buy and sell signals (i.e. how far has price traditionally drifted from the mean before reverting).
Z-Score is a powerful tool in this sense, and if you folow my other indicators, you will know how much I love Z-score!
How to use the indicator
If you want to use the full Machine Learning capabilities of the indicator, its best to just leave all default settings. These default settings will automatically adjust the mean target price and buy and sell signals to align with the current price action.
If you want to be more aggressive in your
Target Price; and
Signals
Then you can opt to manually input a lookback length and mean reversion standard deviation. However, I generally suggest to avoid this as you are then making your own determination of trend by qualitative assessment. It can work, but its just not suggested.
In the input menu, you will see the option to "Manually select lookback" thus over-riding the auto-determination of trend and targets.
You will also see "manual pullback" enabler and "Pullback Standard Deviation". You can set your pullback standard deviation if you want to be more aggressive. The indicator will naturally shift to conservative target prices based on a neutral mean. However, if you want to increase the aggressiveness of the target price, you can increase or decrease the pullback standard deviation.
General Tips about Manually Adjusting Pullback Target
Here are some tips if you want to manually adjust the pullback targets:
The pullback target needs to be in a standard deviation value, this can be anywhere from 0 to 4 or 0 to -4 (you can theoretically go higher but its not really realistic). You can also do decimals, so 1.5 or 1.25 etc.
To determine whether you should be doing negative or positive standard deviation, you should determine the trend. If it is a downtrend and you are looking to short the rips, you will want to select a negative number, like -1.
If it is an uptrend and you want to buy the dips, you should be selecting a positive number, like 1 or 1.5.
Again, I do suggest leaving the indicator to decide for itself, but the options are there for those who wish.
Overall strategy
This is a mean reverting strategy. So if you are a mean reversion trader, this may be of particular interest to you.
Optional
Optionally, you can have the indicator plot the target prices or not, simply toggle this functionality off or on in the settings menu.
Concluding remarks
That is the indicator in a nutshell!
I hope you enjoy it and find it helpful.
Feel free to check out my other Z-Score based indicators if you find this interesting or want to learn more about the power of Z-Score in trading!
Thanks all and safe trades!


MACD Classic MT5 Style (2 Lines + Histogram)MACD เหมือน MT5 นะจ๊ะ
MACD Line (Green) = Difference between Fast EMA and Slow EMA
Signal Line (Red) = EMA of the MACD Line
Histogram = Distance between MACD Line and Signal Line (or in MT5 style, just MACD Line itself)

Daily High/Low Alerts MJO✅ Alert you when price hits daily highs and lows
✅ Work with any timeframe
✅ Support both stocks and crypto
✅ Include customizable colors for all visual elements
✅ Show optional table with current daily levels
✅ Provide flexible alert options

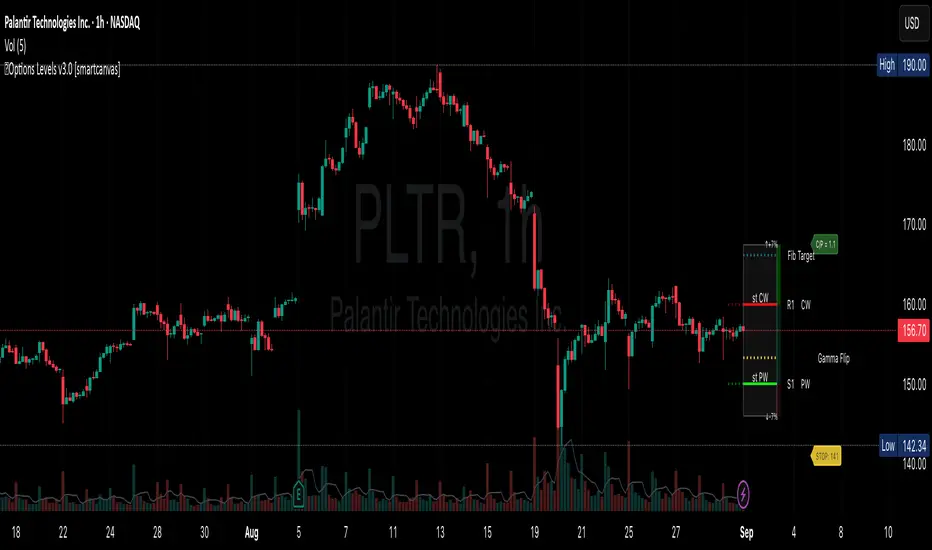
Support and Resistance levels from Options DataINTRODUCTION
This script is designed to visualize key support and resistance levels derived from options data on TradingView charts. It overlays lines, labels, and boxes to highlight levels such as Put Walls (gamma support), Call Walls (gamma resistance), Gamma Flip points, Vanna levels, and more.
These levels are intended to help traders identify potential areas of price magnetism, reversal, or breakout based on options market dynamics. All calculations and visualizations are based on user-provided data pasted into the input field, as Pine Script cannot directly fetch external options data due to platform limitations (explained below).
For convenience, my website allows users to interact with a bot that will generate the string for up to 30 tickers at once getting nearly real-time data on demand (data is cached for 15min). With the output string pasted into this indicator, it's a bliss to shuffle through your portfolio and see those levels for each ticker.
The script is open-source under TradingView's terms, allowing users to study, modify, and improve it. It draws inspiration from common options-derived metrics like gamma exposure and vanna, which are widely discussed in financial literature. No external code is copied without rights; all logic is original or based on standard mathematical formulas.
How the Options Levels Are Calculated
The levels displayed by this script are not computed within Pine Script itself—instead, they rely on pre-calculated values provided by the user (via a pasted data string). These values are derived from options chain data fetched from financial APIs (e.g., using libraries like yfinance in Python). Here's a step-by-step overview of how these levels are generally calculated externally before being input into the script:
Fetching Options Data:
Historical and current options chain data for a ticker (e.g., strikes, open interest, volume, implied volatility, expirations) is retrieved for near-term expirations (e.g., up to 90 days).
Current stock price is obtained from recent history.
Gamma Support (Put Wall) and Resistance (Call Wall):
Gamma Calculation: For each option, gamma (the rate of change of delta) is computed using the Black-Scholes formula:
gamma = N'(d1) / (S * sigma * sqrt(T))
where S is the stock price, K is the strike, T is time to expiration (in years), sigma is implied volatility, r is the risk-free rate (e.g., 0.0445), and N'(d1) is the normal probability density function.
Weighted gamma is multiplied by open interest and aggregated by strike.
The Put Wall is the strike below the current price with the highest weighted gamma from puts (acting as support).
The Call Wall is the strike above the current price with the highest weighted gamma from calls (acting as resistance).
Short-term versions focus on strikes closer to the money (e.g., within 10-15% of the price).
Gamma Flip Level:
Net dealer gamma exposure (GEX) is calculated across all strikes:
GEX = sum (gamma * OI * 100 * S^2 * sign * decay)
where sign is +1 for calls/-1 for puts, and decay is 1 / sqrt(T).
The flip point is the price where net GEX changes sign (from positive to negative or vice versa), interpolated between strikes.
Vanna Levels:
Vanna (sensitivity of delta to volatility) is calculated:
vanna = -N'(d1) * d2 / sigma
where d2 = d1 - sigma * sqrt(T).
Weighted by open interest, the highest positive and negative vanna strikes are identified.
Other Levels:
S1/R1: Significant strikes with high combined open interest and volume (80% OI + 20% volume), below/above price for support/resistance.
Implied Move: ATM implied volatility scaled by S * sigma * sqrt(d/365) (e.g., for 7 days).
Call/Put Ratio: Total call contracts divided by put contracts (OI + volume).
IV Percentage: Average ATM implied volatility.
Options Activity Level: Average contracts per unique strike, binned into levels (0-4).
Stop Loss: Dynamically set below the lowest support (e.g., Put Wall, Gamma Flip), adjusted by IV (tighter in low IV).
Fib Target: 1.618 extension from Put Wall to Call Wall range.
Previous day levels are stored for comparison (e.g., to detect Call Wall movement >2.5% for alerts).
Effect as Support and Resistance in Technical Trading
Options levels like gamma walls influence price action due to market maker hedging:
Put Wall (Gamma Support): High put gamma below price creates a "magnet" effect—market makers buy stock as price falls, providing support. Traders might look for bounces here as entry points for longs.
Call Wall (Gamma Resistance): High call gamma above price leads to selling pressure from hedging, acting as resistance. Rejections here could signal trims, sells or even shorts.
Gamma Flip: Where gamma exposure flips sign, often a volatility pivot—crossing it can accelerate moves (bullish above, bearish below).
Vanna Levels: Positive/negative vanna indicate volatility sensitivity; crosses may signal regime shifts.
Implied Move: Shows expected range; prices outside suggest overextension.
S1/R1 and Fib Target: Volume/OI clusters act as classic S/R; Fib extensions project upside targets post-breakout.
In trading, these are not guarantees—combine with TA (e.g., volume, trends). High activity levels imply stronger effects; low CP ratio suggests bearish sentiment. Alerts trigger on proximities/crosses for awareness, not advice.
Limitations of the TradingView Platform for Data Pulling
TradingView's Pine Script is sandboxed for security and performance:
No direct internet access or API calls (e.g., can't fetch yfinance data in-script).
Limited to chart data/symbol info; no real-time options chains.
Inputs are static per load; updates require manual pasting.
Caching isn't persistent across sessions.
This prevents dynamic data pulling, ensuring scripts remain lightweight but requiring external tools for fresh data.
Creative Solution for On-Demand Data Pulling
To overcome these limitations, users can use external tools or scripts (e.g., Python-based) to fetch and compute levels on demand. The tool processes tickers, generates a formatted string (e.g., "TICKER:level1,level2,...;TIMESTAMP:unix;"), and users paste it into the script's input. This keeps data fresh without violating platform rules, as computation happens off-platform. For example, run a local script to query APIs and output the string—adaptable for any ticker.
Script Functionality Breakdown
Inputs: Custom data string (parsed for levels/timestamp); toggles for short-term/previous/Vanna/stop loss; style options (colors, transparency).
Parsing: Extracts levels for the chart symbol; gets timestamp for "updated ago" display.
Drawing: Lines/labels for levels; boxes for gamma zones/implied move; clears old elements on updates.
Info Panel: Top-right summary with metrics (CP ratio, IV, distances, activity); emojis for quick status.
Alerts: Conditions for proximities, crosses, bounces (e.g., 0.5% bounce from Put Wall).
Performance: Uses vars for persistence; efficient for real-time.
This script is educational—test thoroughly. Not financial advice; past performance isn't indicative of future results. Feedback welcome via TradingView comments.
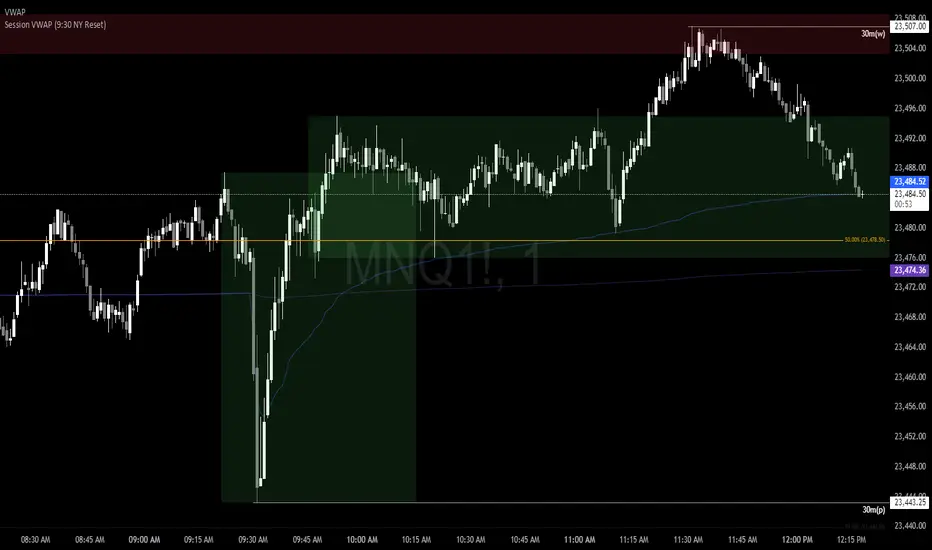
VWAP TrendGuard [KedarArc Quant]Strategy Overview: A non-repainting intraday strategy that pairs VWAP entries with an EMA-based trend gate on the entry timeframe. Entries come from VWAP Cross or Cross+Retest, with an optional Momentum exception. Exits use either an ATR emergency stop or a structural TrendBreak. The Today Panel summarizes Net-R, Win%, and PF for the current session.
Non-repainting: all higher-timeframe requests use lookahead_off (no peeking).
Works across intraday frames; keep the HTF filter your chart timeframe.
Signals & Exits
Trend gate (entry timeframe): trendUp if EMA(fast) > EMA(slow); trendDown otherwise.
Volume gate: volume SMA(volume, volLen) × volMult.
Long (Base): trendUp & volOK AND (cross above VWAP OR (Cross+Retest AND recent low VWAP
within lookback)).
Short (Base): trendDown & volOK AND (cross below VWAP OR (Cross+Retest AND recent high VWAP within lookback)).
Momentum exception (optional): body momBodyPct AND volume SMA × momVolMult allows fast
entry.
TrendBreak exit: Long closes when price < VWAP AND EMA(fast) < EMA(slow); Short closes on the
opposite.
ATR emergency stop: strategy.exit at entry with stop = close ± ATR(atrLen) × atrMult.

ADX Only (Custom, same as TradingView)This is ADX indicator , same as default indicator. But it will change colour when ADX is bullish and bearish.

Draw Trend LinesSometimes the simplest indicators help traders make better decisions. This indicator draws simple trend lines, the same lines you would draw manually.
To trade with an edge, traders need to interpret the recent price action, whether it's noisy or choppy, or it's trending. Trend Lines will help traders with that interpretation.
The lines drawn are:
1. lower tops
2. higher bottoms
Because trends are defined as higher lows, or lower highs.
When you see "Wedges", formed by prices chopping between top and bottom trend lines, that's noisy environment not to be traded. When you learn to "stop yourself", you already have an edge.
Often when you see a trend, it's still not too late. Trend will continue until it doesn't. But the caveat is a very steep trend is unlikely to continue, because buying volume is extremely unbalanced to cause the steep trend, and that volume will run out of energy. (Same on the sell side of course)
Trends can reverse, and when price action breaks the trend line, Breakout/Breakdown traders can take this as an entry signal.
Enjoy, and good trading!

Ultra-Precise Scalper with OB, W/M & Liquidity Sweepsupport and resistance with order block detection and M and W PATTERNS

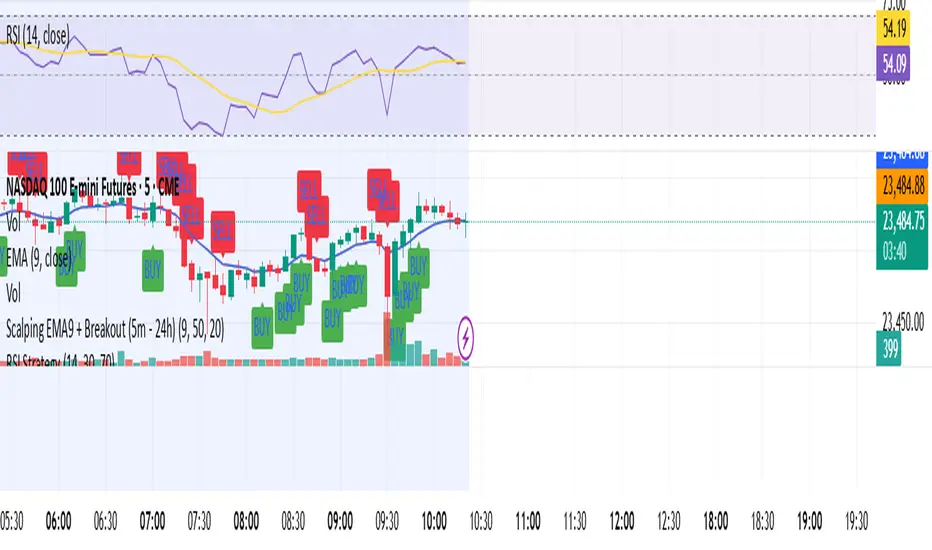
Scalping EMA9 + Breakout (5m - 24h)//@version=6
indicator("Scalping US100 - EMA9 Breakout", overlay=true)
ema9 = ta.ema(close, 9)
plot(ema9, color=color.orange, title="EMA9")
// Condições de rompimento
breakout_up = close > high and close > ema9
breakout_down = close < low and close < ema9
// Plotar sinais visuais
plotshape(breakout_up, title="Buy Signal", location=location.belowbar, color=color.green, style=shape.labelup, text="BUY")
plotshape(breakout_down, title="Sell Signal", location=location.abovebar, color=color.red, style=shape.labeldown, text="SELL")
// Alerta para Webhook
alertcondition(breakout_up, title="Buy Alert", message="BUY - US100 🚀")
alertcondition(breakout_down, title="Sell Alert", message="SELL - US100 🔻")