HTF Candles with PVSRA Volume Coloring (PCS Series)This indicator displays higher timeframe (HTF) candles using a PVSRA-inspired color model that blends price and volume strength, allowing traders to visualize higher-timeframe activity directly on lower-timeframe charts without switching screens.
OVERVIEW
This script visualizes higher-timeframe (HTF) candles directly on lower-timeframe charts using a custom PVSRA (Price, Volume & Support/Resistance Analysis) color model.
Unlike standard HTF indicators, it aggregates real-time OHLC and volume data bar-by-bar and dynamically draws synthetic HTF candles that update as the higher-timeframe bar evolves.
This allows traders to interpret momentum, trend continuation, and volume pressure from broader market structures without switching charts.
INTEGRATION LOGIC
This script merges higher-timeframe candle projection with PVSRA volume analysis to provide a single, multi-timeframe momentum view.
The HTF structure reveals directional context, while PVSRA coloring exposes the underlying strength of buying and selling pressure.
By combining both, traders can see when a higher-timeframe candle is building with strong or weak volume, enabling more informed intraday decisions than either tool could offer alone.
HOW IT WORKS
Aggregates price data : Groups lower-timeframe bars to calculate higher-timeframe Open, High, Low, Close, and total Volume.
Applies PVSRA logic : Compares each HTF candle’s volume to the average of the last 10 bars:
• >200% of average = strong activity
• >150% of average = moderate activity
• ≤150% = normal activity
Assigns colors :
• Green/Blue = bullish high-volume
• Red/Fuchsia = bearish high-volume
• White/Gray = neutral or low-volume moves
Draws dynamic outlines : Outlines update live while the current HTF candle is forming.
Supports symbol override : Calculations can use another instrument for correlation analysis.
This multi-timeframe aggregation avoids repainting issues in request.security() and ensures accurate real-time HTF representation.
FEATURES
Dual HTF Display : Visualize two higher timeframes simultaneously (e.g., 4H and 1D).
Dynamic PVSRA Coloring : Volume-weighted candle colors reveal bullish or bearish dominance.
Customizable Layout : Adjust candle width, spacing, offset, and color schemes.
Candle Outlines : Highlight the forming HTF candle to monitor developing structure.
Symbol Override : Display HTF candles from another instrument for cross-analysis.
SETTINGS
HTF 1 & HTF 2 : enable/disable, set timeframes, choose label colors, show/hide outlines.
Number of Candles : choose how many HTF candles to plot (1–10).
Offset Position : distance to the right of the current price where HTF candles begin.
Spacing & Width : adjust separation and scaling of candle groups.
Show Wicks/Borders : toggle wick and border visibility.
PVSRA Colors : enable or disable volume-based coloring.
Symbol Override : use a secondary ticker for HTF data if desired.
USAGE TIPS
Set the indicator’s visual order to “Bring to front.”
Always choose HTFs higher than your active chart timeframe.
Use PVSRA colors to identify strong momentum and potential reversals.
Adjust candle spacing and width for your chart layout.
Outlines are not shown on chart timeframes below 5 minutes.
TRADING STRATEGY
Strategy Overview : Combine HTF structure and PVSRA volume signals to
• Identify zones of high institutional activity and potential reversals.
• Wait for confirmation through consolidation or a pullback to key levels.
• Trade in alignment with dominant higher-timeframe structure rather than chasing volatility.
Setup :
• Chart timeframe: lower (5m, 15m, 1H)
• HTF 1: 4H or 1D
• HTF 2: 1D or 1W
• PVSRA Colors: enabled
• Outlines: enabled
Entry Concept :
High-volume candles (green or red) often indicate market-maker activity , such zones often reflect liquidity absorption by larger players and are not necessarily ideal entry points.
Wait for the next consolidation or pullback toward a support or resistance level before acting.
Bullish scenario :
• After a high-volume or rejection candle near a low, price consolidates and forms a higher low.
• Enter long only when structure confirms strength above support.
Bearish scenario :
• After a high-volume or rejection candle near a top, price consolidates and forms a lower high.
• Enter short once resistance holds and momentum weakens.
Exit Guidelines :
• Exit when next HTF candle shifts in color or momentum fades.
• Exit if price structure breaks opposite to your trade direction.
• Always use stop-loss and take-profit levels.
Additional Tips :
• Never enter directly on strong green/red high-volume candles, these are usually areas of institutional absorption.
• Wait for market structure confirmation and volume normalization.
• Combine with RSI, moving averages, or support/resistance for timing.
• Avoid trading when HTF candles are mixed or low-volume (unclear bias).
• Outlines hidden below 5m charts.
Risk Management :
• Use stop-loss and take-profit on all positions.
• Limit risk to 1–2% per trade.
• Adjust position size for volatility.
FINAL NOTES
This script helps traders synchronize lower-timeframe execution with higher-timeframe momentum and volume dynamics.
Test it on demo before live use, and adjust settings to fit your trading style.
DISCLAIMER
This script is for educational purposes only and does not constitute financial advice.
SUPPORT & UPDATES
Future improvements may include alert conditions and additional visualization modes. Feedback is welcome in the comments section.
CREDITS & LICENSE
Created by @seoco — open source for community learning.
Licensed under Mozilla Public License 2.0 .
Pvsra

PVSRA Volume Suite with Volume DeltaPVSRA Volume Suite with Volume Delta
🔹 Overview
This indicator is a Volume Suite that enhances PVSRA (Price, Volume, Support, Resistance Analysis) by incorporating Volume Delta and AI-driven predictive alerts. It is designed to help traders analyze volume pressure, market trends, and price movements with color-coded visualizations.
📌 Key Features
PVSRA Volume Color Coding – Highlights vector candles based on extreme volume/spread conditions.
Volume Delta Analysis – Tracks buying/selling pressure using up/down volume data.
AI-Powered Predictive Alerts – Identifies potential trend shifts based on volume and trend context.
Volatility-Adjusted Thresholds – Dynamically adapts volume conditions based on ATR (Average True Range).
Customizable MA & Symbol Overrides – Allows traders to tweak settings for personalized market insights.
Debug & Diagnostic Labels – Shows statistical z-scores, thresholds, and volume dynamics.
How It Works
PVSRA Color Coding – The script classifies candles into four categories based on volume and spread analysis:
🔴 Red Vector → Extreme bearish volume/spread
🟢 Green Vector → Extreme bullish volume/spread
🟣 Violet Vector → Above-average bearish volume
🔵 Blue Vector → Above-average bullish volume
Volume Delta Calculation – Uses lower timeframe volume analysis to estimate up/down volume differentials.
Trend & Predictive Alerts – Combines EMA crossovers with statistical volume analysis to detect potential trend shifts.
Volatility Adaptation – Adjusts volume thresholds based on ATR, making signals more reliable in changing market conditions.
Custom Symbol Override – Fetches PVSRA data from a different instrument, useful for index-based volume analysis.
Customizable Inputs
PVSRA Color Settings – Modify candle color schemes for better visual clarity.
Volume Delta Colors – Customize delta volume body, wick, and border colors.
AI Settings – Tune z-score thresholds, lookback periods, and enable predictive alerts.
Symbol Overrides – Analyze volume from a different market or asset.
Moving Average (MA) Settings – Display a volume-based moving average for trend confirmation.
Important Notes
Works best on intraday timeframes where volume data is reliable.
Lower timeframe volume delta estimates might not be precise for all assets.
No guarantees of accuracy – Use alongside other confluence tools for decision-making.
Credits & Open-Source Notice
This script is based on PVSRA methodologies and integrates Volume Delta analysis. Special thanks to Traders Reality and TradingView for their contributions to volume-based analysis.

Volume Delta with PVSRAVolume Delta with PVSRA
Volume Delta with PVSRA is an advanced volume indicator that dissects each bar’s volume into its directional components using higher resolution data. It visually distinguishes between buying and selling volume, so that for a bullish candle the bottom portion represents buying volume and for a bearish candle it represents selling volume. A dot is plotted at the 50% mark of the candle’s total volume, serving as a clear reference point.
Key Features:
Directional Volume Breakdown:
The indicator calculates the delta volume by analyzing lower timeframe data. The bottom portion of a bullish candle (displayed in green) represents buying volume, while that of a bearish candle (displayed in red) represents selling volume.
PVSRA Analysis:
Using Price-Volume Spread Range Analysis, the indicator compares the current volume to the 10-bar average. When volume is significantly higher (using thresholds of 150% and 200%), the candle borders are highlighted in custom colors, indicating medium or strong volume conditions.
Volume Moving Averages:
Three moving averages are plotted:
Total Volume MA (yellow): Tracks overall volume.
Buying Volume MA (green) and Selling Volume MA (red): These are re-centered around the total volume MA. A crossover of the green over the red typically signals rising buying pressure, while the opposite indicates increasing selling pressure.
Scalable Volume Bars:
The indicator scales the volume bars to provide optimal visualization on your chart.
Setup Instructions:
For best results, open your chart settings, navigate to the Canvas tab, and set the bottom margin to 0%. This ensures the indicator displays like a standard volume indicator without any unwanted gaps at the bottom.
Customize the various settings—including colors, border opacity, and moving average parameters—to suit your trading style.

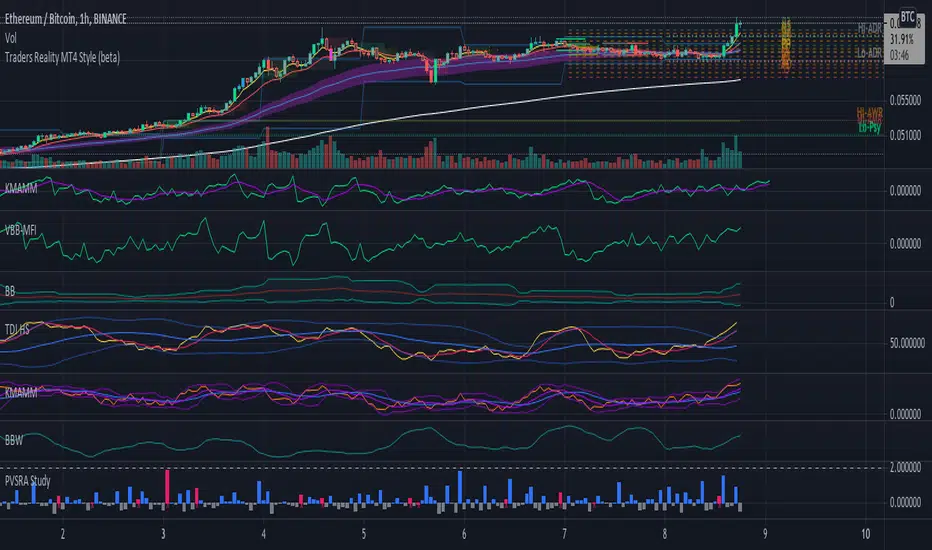
Traders Reality Vector Candle ZonesVector Candle Zone indicator displays areas of unrecovered liquidity based on PVSRA with override option for the chart symbol.
Developed for TradersReality by infernixx with library conversion by peshocore

Traders Reality PVSRA Volume SuitePVSRA volume bars color coded to PVSRA vector candles and with override option and configurable moving average.
Indicator displays volume bars color coded to PVRSA price action and allows the user to override the chart symbol.
Developed for TradersReality by infernixx with library conversion by peshocore.
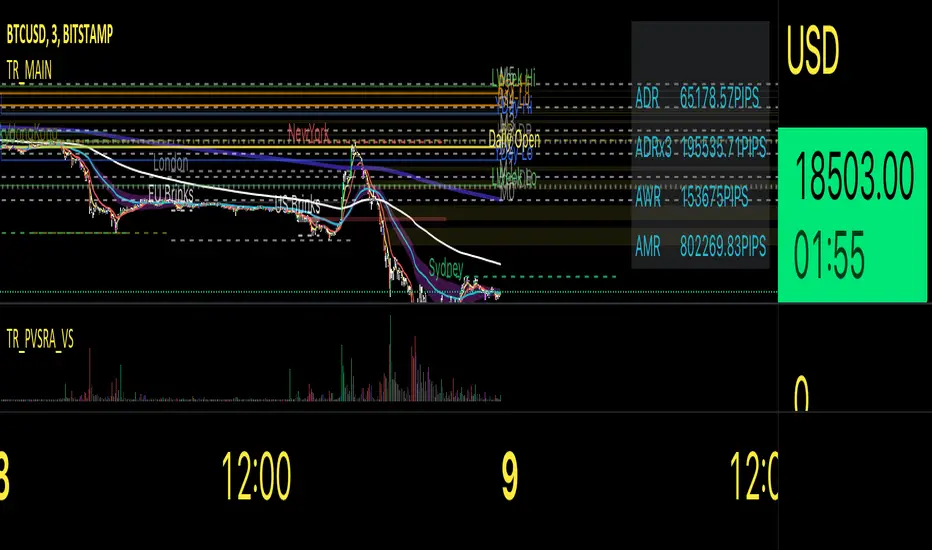
Traders Reality MainThis indicator serves as the Tradingview equivalent of an MT4 indicator suite.
It differentiates from existing TV indicators in its style and total feature set (most notably PVSRA and PVSRA Override)
It was originally designed for forex markets, and it will work for crypto as well, but it has not been tested on stocks.
List of features:
PVSRA Candles
Market boxes (NY/JP/ HK /UK/ FR and Brinks Boxes)
5/13/50/200/800 EMAs (cloud for 50EMA)
Pivot points (S/M/R 1,2,3; PP )
Yesterday and Last Week price range
Average Daily Range (Weekly and Monthly as well)
Daily Open
PVSRA Override
Psychological High/Low
Vector Candle Zones
All of these are configurable in the indicator settings.
Usage instructions:
PVSRA Candle colors meaning:
Green (bull) and red (bear): Candles with volume >= 200% of the average volume of the 10 previous chart candles, and candles where the product of candle spread x candle volume is >= the highest for the 10 previous chart time candles.
Blue (bull) and blue-violet (bear): Candles with volume >= 150% of the average volume of the 10 previous chart candles
PVSRA Override
In order to get reliable bar coloring, we need accurate data. If you're on a chart with low volume on some obscure exchange, you may want to use another exchanges datafeed for the symbol you are on to calculate the PVSRA bar colors with. This lets you do exactly that. By default it's off, but you can turn it on and use INDEX:BTCUSD, or really any other chart you want. You can combine charts too, e.g. use BINANCE:BTCUSDT+COINBASE:BTCUSD.
PVSRA Alerts
Alerts can be made for PVSRA "vector"/"climax" candles:
1. Create Alert (Clock with + sign)
2. Set Condition: "Traders Reality",
3. Select "Alert on Vector Candle",
4. Set it to Once per Bar,
5. choose your notification options.
Market boxes
The market boxes times are configurable and will change depending on the exchange timezone. I recommend to pick your main exchange/chart and adjust the times so that they are correct. Technically you will need to shift the time from the exchanges' timezone to GMT . Default values should be good for UTC based exchanges in current US+UK summer time.
Psychological High/Low
Configurable for Crypto or Forex - draws the perceived Psychological High/Low ranges for the week. Can display historical values too.
Vector Candle Zones
displays unrecovered liquidity left behind on unrecovered vectors. Configurable to take into account candle bodies or candles and wicks.
Recommended additional Tradingview indicator(s):
- TDI - Goldminds, Edited for Market Makers Method by Jakub Donovan
Footnotes
The code was originally by plasmapug, continued development (with permission) is now done by infernix and peshocore and xtech5192 in collaboration with TradersReality.
If you have suggestions or questions, you can message me or leave a comment.
Unrecovered Imbalanced Zone with PVRSAThis indicator highlights imbalanced PVSRA candles that have not been recovered.
Bullish Candles/Zones
200% Volume = Green
150% Volume = Blue
Bearish Candles/Zones
200% Volume = Red
150% Volume = Fuchsia
Imbalanced Zones with normal/below 150% Average 10ema volume can be displayed or hidden from view (Hidden by default)

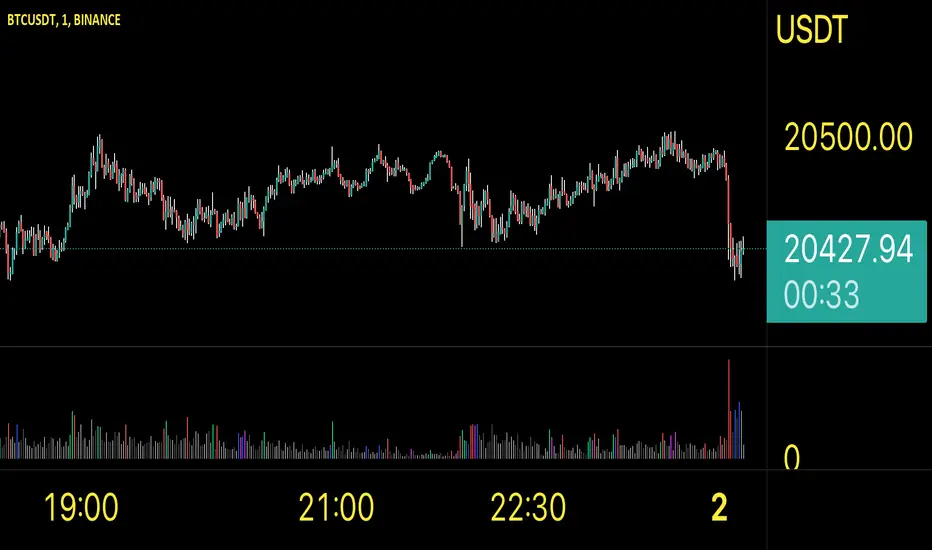
PVSRA StudyThis script will show you the percentage change in volume and also consider stopping volume that is genuine reversal volume.
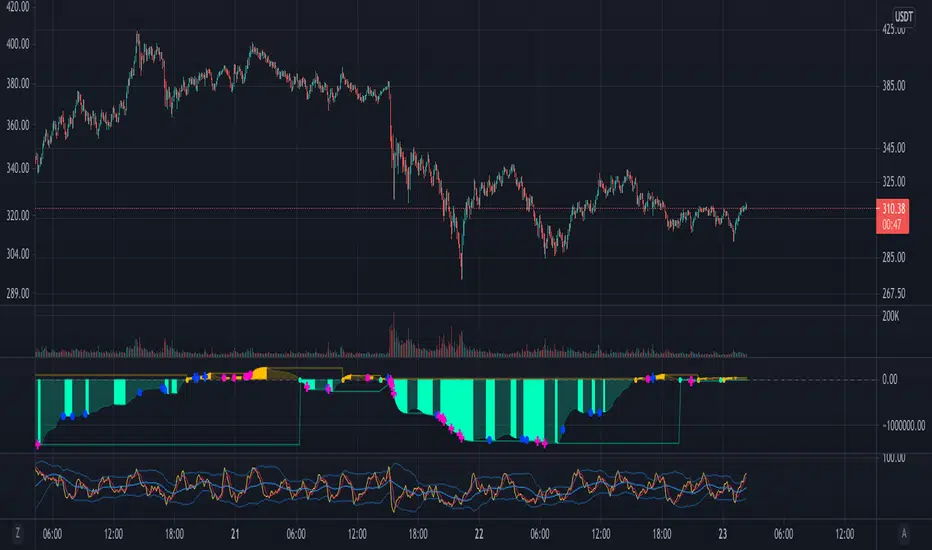
Market Maker BalanceWhere is the market maker in his cycle of building longs or shorts? When is that big drop or big pump coming?
This is a simple and unexpectedly powerful indicator that shows you an estimate of the market maker's position over the last 200 candles. It works on any timeframe.
How does it work?
It combines a simple 10-candle Price Volume Support Resistance Analysis metric of climactic and rising volume. That volume is combined to create a bullish and bearish balance over a period of 200 candles. The curves are smoothed out with a 10 period EMA.
The MMB (Marker Maker Balance) oscillator is the resulting bearish volume - bullish volume, which shows us THEIR position balance.
Indications:
when shorts are increasing (further below 0), we are in a bullish trend -- you should be taking profit on longs
when shorts are flat or decreasing, the trend is due for a reversal -- you should be closing longs and looking to short
when shorts cross 0 to long, the trend is reversing down -- you should be in a short position by now
when longs are increasing, we are in a bearish trend -- you should be taking profits on your shorts
when longs are flat or decreasing, the trend is due for a reversal -- you should be closing your shorts
For extra information, there are also the separate lines for rising and climactic volume to give you early indications of reversal or change in Market Maker behaviour. You can disable them in the Style settings, but they can be a useful early indicator that the current trend is losing strength when rising volume overtakes climax volume (MM's no longer moving out of zones higher/lower).
Ways to use this indicator are quite simple and eerily accurate:
for short term gains, do the opposite of MMs: long when MM are opening more shorts, short when they are opening more longs
for huge positions, mimic the MM position: build long positions / close shorts when MMB is rising, build shorts / close longs when MMB is falling or crosses above 0 (be careful with leverage, begin on 1x leverage)
Note: the results of this indicator will be different for each exchange, because of their different trading volumes per candle. It's advisable to use it for the exchange you're trading on or use a chart that averages all exchanges for that asset, like INDEX:BTCUSD.
For those of you who use the Backtesting & Trading Engine by PineCoders, the BTE Signal plot generates long and short entries as well as filter states. Use this plot as the source for BTE.
Shout out to @infernixx for PVSRA calculations in his awesome Traders Reality indicator, the code of which I shamelessly ripped off and edited for this indicator.
Leave comments below if you want something added.