Qube [AstrideUnicorn]Qube is an indicator that shows market regimes. It is able to detect medium and long term trends and ranging markets. If the indicator bars are colored blue and are between the two blue lines, it means that the market is in sideways movement or consolidation. If indicator bars cross the upper boundary and are colored green, it means that the market is in an uptrend. Red bars crossing the lower blue line indicate a downward trend. The red or green columns are further referred as signal bars.
The indicator is based on the normalized momentum oscillator raised to the third power. This is done to increase the sensitivity of the indicator and to emphasize the difference between the market modes.
The indicator can be used in different ways. One of them is determining the trend direction based on the last signal bar. Even if the current indicator bar is blue (showing range or consolidation), the user should consider the longer-term market mode as upward if the last signal bar is green. And vice versa, if the last signal bar is red, the current market bias is downward. One other way to use the indicator is to catch active price impulses, when columns of the same color (red or green) appear consecutively.
Regime

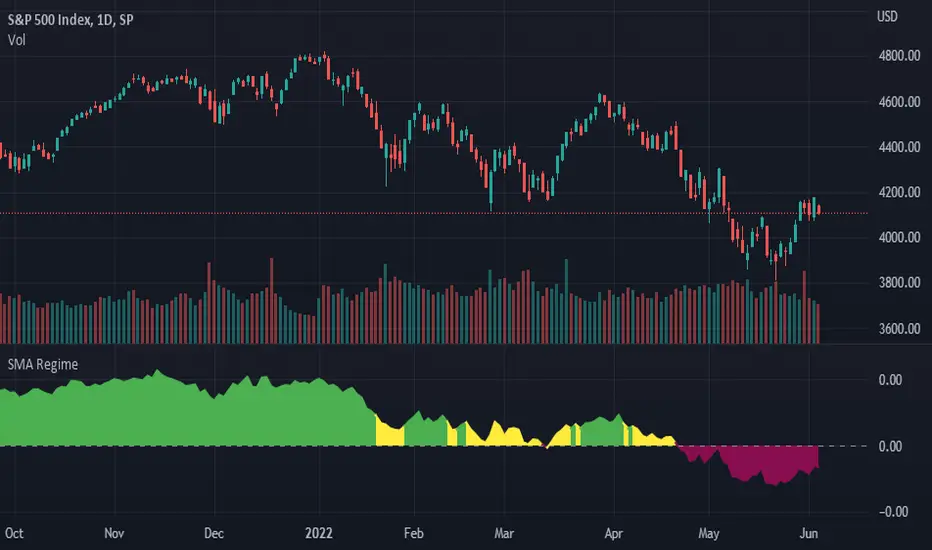
SMA RegimeProvides a color coded indicator based upon both the slope of a moving average of choice, and the asset's position in relation to that moving average. If the specified moving average is downward sloping and the asset closes below the moving average the indicator will be red. If the specified moving average is upward sloping and the asset closes above the moving average the indicator will be green. Any other combination of these two factors will color the indicator yellow indicating indecision.
Market Risk ON/OFFMarket Risk ON/OFF is a indicator designed to show you when it may be a good time to add hedges and/or reduce long exposure to the US stock market. It can be used to make forecasts on the overall market, when a crash or bear market may be about to occur and when a bull market is still strong. When the indicator is applied to a chart, entire time periods will be shaded either Green (Risk-ON Mode) or shaded Red (Risk-OFF Mode). It can be applied to any chart, however it's best applied to a chart of the S&P 500 Index or the ETF $SPY on the daily timeframe.
It's calculation is based on 3 things; price action of the S&P 500 Index ETF $SPY, overall market breadth (that is advancing stocks versus declining stocks) and CBOE Volatility (VIX) Futures term structure. By default 2 out of these 3 signals must be in confluence for a regime change from Risk-On to Risk-Off mode, however this setting can be changed to either 1, 2 or 3 signals required for a regime change.
You can see in the chart above an example of how this indicator would have alerted users on the 25th February 2020 of a change to Risk-Off mode and allowed you to prepare for a possible market crash which happened (the Covid bear market) and when things settled down it switched back to Risk-On mode on the 24th of April 2020 letting you know it was safer to position your portfolio for a bull market again.
Here's another example from the 2008 Global Financial Crisis (GFC) market crash of the Market Risk ON/OFF indicator alerting you to a possible crash.
To get access PM or email me to my address shown below.
Enjoy :)
Disclaimer: All my scripts and content are for educational purposes only. I'm not a financial advisor and do not give personal finance advice. Past performance is no guarantee of future performance. Please trade at your own risk.

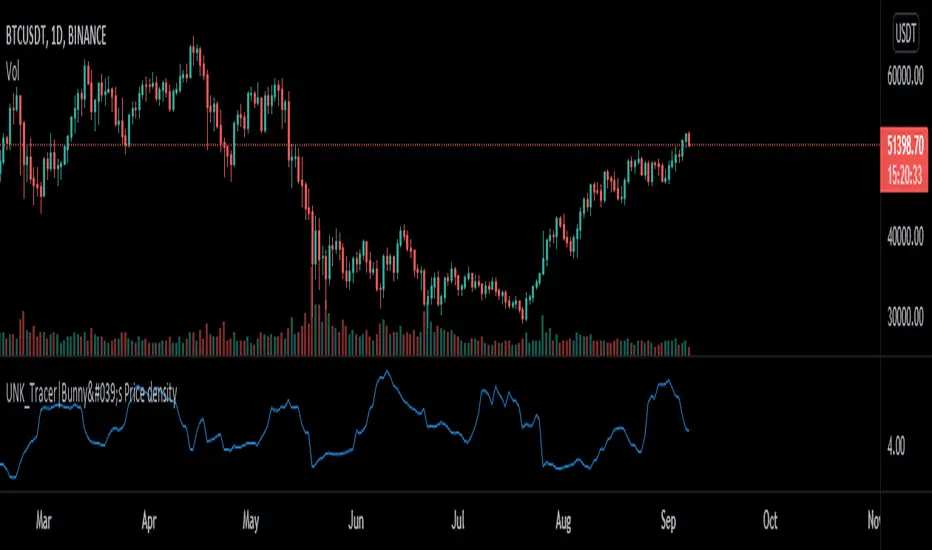
Price density [Measuring Market Noise:Take advantage]$$ Market noise can be problematic to some types of trading strategies yet beneficial to others.
By measuring noise using the 'Price Density' can enable us to improve our
trading edge and turn noise to our advantage.
Robust analysis of noise can inform us when it is best to avoid trend-following
systems (when noise is too high), and vice versa for systems based on a
mean-reverting trading premise (when market noise is low).
__________________________________________________________________________
Using Noise to our advantage
* Two techniques:
-Measure Noise and trade when suitable for the system
~ High noise = avoid trend-following
~ Low noise = avoid mean-reversion
-Match assets to strategies
~ Only trade 'noisy assets' with Mean-reversion Strategies
~ Only trade 'efficient assests' with Trend-following Strategies
## Price density:-
High values = High noise
Low values = Low noise
___________________________________________________________________________
Disclaimer!! Do your own research