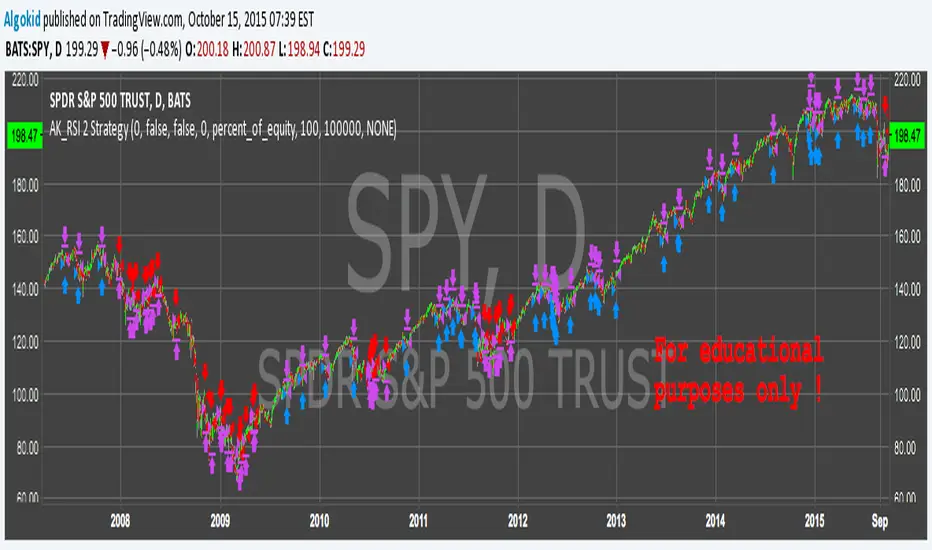
The Relative Momentum Index (RMI) was developed by Roger Altman. Impressed with the Relative Strength Index's sensitivity to the number of look-back periods, yet frustrated with it's inconsistent oscillation between defined overbought and oversold levels, Mr. Altman added a momentum component to the RSI. As mentioned, the RMI is a variation of the RSI...
Script based on True Strength Index (TSI) and RSI A technical momentum indicator that helps traders determine overbought and oversold conditions of a security by incorporating the short-term purchasing momentum of the market with the lagging benefits of moving averages. Generally a 25-day exponential moving average (EMA) is applied to the difference between two...
This strategy uses the RSI indicator together with the Bollinger Bands to go long when the price is below the lower Bollinger Band (and to close the long trade when this value is above the upper Bollinger band). This simple strategy only places a long, when both the RSI and the Bollinger Bands indicators are at the same time in a oversold condition. In this new...
This is RSI indicator which is more sesitive to price changes. It is based upon a modern math tool - Laguerre transform filter. With help of Laguerre filter one becomes able to create superior indicators using very short data lengths as well. The use of shorter data lengths means you can make the indicators more responsive to changes in the price. You...
Another basic strategy most people learn at the beginning of their trading carreer (like me) is the RSI strategy. This is an adaptation of the built-in RSI strategy for use in binary options. Who knows, maybe one day i will graduate to CFD trading, but my time for trading in general is limited at the moment and I am very much still at the beginning of this entire...
The RSI is a very popular indicator that follows price activity. It calculates an average of the positive net changes, and an average of the negative net changes in the most recent bars, and it determines the ratio between these averages. The result is expressed as a number between 0 and 100. Commonly it is said that if the RSI has a low value, for...
This simple indicator modified RSI You can use in the xPrice any series: Open, High, Low, Close, HL2, HLC3, OHLC4 and ect... You can change long to short in the Input Settings Please, use it only for learning or paper trading. Do not for real trading.
// // Author : Jacques CRETINON // Last Version : V1.0 11-22-2016 // // Risk disclaimer : Do not use this script in production environment. We assume no liability or responsibility for any damage to you, your computer, or your other property, due to the use of this script. // // Purpose of this script : // 1- use same pine code for strategy or study script (with...
What does it do? This script checks whether RSI movement affects future price. Trades when probability increases or decreases. Developed for daily(D) bars and Bitcoin. This script is just a toy and for educational use. Please rent my bots at cryptotrader.org/?r=51
Updated by request: this is a "Strategy" trading version of the "QQE Cross Indicator Alert v2.0 by JustUncleL" (which is mainly for Binary Options trading), the same BUY/SELL signals are used to generate trade entry and exit conditions. Thanks again to JayRogers for making the Strategy risk management easier to understand and implement. In this update I have...
A simple strategy that use EMAs convergence/divergence and RSI peeks to take position. Fractals are really useful to positioning your stop loss. It works well on commodities and forex markets.
This model uses a Smoothed RSI to measure the momentum of the Civilian Unemployment Rate as published by FRED. The behavior of the unemployment rate makes it ideal for applying momentum-based timing techniques because it tends to rise sharply in a short time period and then declines gradually over a longer period. Using other basic momentum-based timing techniques...
*** USE AT YOUR OWN RISK *** Nothing is perfect, and all decisions by you are on your own head. And stuff. Description: It's RSI versus a Simple Moving Average.. Not sure it really needs much more description. Should not repaint - Automatically offsets by 1 bar if anything other than "open" selected as RSI source. ...sometimes smashing things...
A rsi strategy that has potential to do over 700% annually on the EURUSD 1h
Uses two sets of MACD plus an RSI to either long or short. All three indicators trigger buy/sell as one (ie it's not 'IF MACD1 OR MACD2 OR RSI > 1 = buy", its more like "IF 1 AND 2 AND RSI=buy", all 3 match required for trigger) The MACD inputs should be tweaked depending on timeframe and what you are trading. If you are doing 1, 3, 5 min or real...
EXPERIMENTAL: Double EMA RSI Strategy. Optional: N max orders per day, %equity trade size, Time session constraints, TP, SL, Trailing.
This is a simple swing trading algorithm that uses a fast RSI-EMA to trigger buy/cover signals and a slow RSI-EMA to trigger sell/short signals for SPY, an xchange-traded fund for the S&P 500. The idea behind this strategy follows the premise that most profitable momentum trades usually occur during periods when price is trending up or down. Periods of flat price...
ATTENTION: This is a symmetrical algorithm designed only for trading EUR/USD on the 1h time frame. For other currency pairs and time frames, you need to re-calibrate the RSI-EMAs as well as the profit targets and stop losses. BACKTEST CONDITIONS: Initial equity = $100,000 (no leverage) Order size = 100% of equity Pyramiding = disabled TRADING RULES: Long...