Smart Divergence Engine [ChartNation]SMART DIVERGENCE ENGINE — REPAINTING-PROOF RSI DIVERGENCE WITH EXHAUSTION CONFIRMATION
═══════════════════════════════════════════
Smart Divergence Engine solves three critical problems that plague free RSI divergence indicators:
PROBLEM 1: REPAINTING DIVERGENCES
Most divergence scripts detect divergence in real-time as bars form. This causes signals to appear, disappear, and reappear unpredictably—making them unusable for alerts or systematic trading.
OUR SOLUTION: Pivot-Locked Detection
Smart Divergence Engine evaluates RSI at the exact bar where price structure confirms (rsi ), not at the current bar. Once a divergence prints, it NEVER disappears. This is implemented via:
Full swing confirmation (Pivot Left + Pivot Right bars must complete)
RSI evaluation at historical bar: rsi , not rsi
Divergence triggers AFTER structure lock, not during formation
Technical implementation: The script stores RSI values at confirmed pivot bars using var floats (lowRsiPrev, lowRsiCurr, highRsiPrev, highRsiCurr), then compares these locked values when new pivots confirm. This prevents any possibility of historical repaint.
PROBLEM 2: FALSE POSITIVE OVERLOAD
Divergence scripts trigger on ANY price-RSI mismatch, flooding charts with weak signals during choppy conditions. No filtering means traders must manually screen out noise.
OUR SOLUTION: Shark Fin Exhaustion Filter
Before any divergence can be considered actionable, Smart Divergence Engine requires RSI to demonstrate genuine momentum exhaustion through our proprietary "Shark Fin" detection:
Shark Fin Logic (Not Found in Free Scripts):
RSI must pierce the outer volatility band by a configurable buffer (default 1.5 RSI points)
RSI must re-enter the band with directional confirmation (positive slope for bullish, negative slope for bearish)
Band width must exceed minimum standard deviation threshold (volatility qualification)
Cooldown period enforced (default 25 bars) to prevent signal clustering
This multi-condition filter dramatically reduces false divergences by requiring RSI to physically demonstrate exhaustion BEFORE structure confirmation matters.
Technical implementation: The Shark Fin state machine uses boolean flags (bullFinForming, bearFinForming) to track when RSI is stretched beyond bands, then validates re-entry using ta.crossover(rsi, lower) / ta.crossunder(rsi, upper) with slope checks (ta.change(rsi) > 0 / < 0) and volatility gates (dev >= finMinDev).
PROBLEM 3: NO VOLATILITY CONTEXT
Divergence scripts use fixed RSI levels (30/70 or similar) that fail to adapt to changing market conditions. What's "overbought" in a low-volatility regime differs drastically from high-volatility conditions.
OUR SOLUTION: Adaptive Volatility Bands
Smart Divergence Engine calculates dynamic overbought/oversold zones using:
34-period SMA of RSI as basis
1.618 standard deviation multiplier (golden ratio expansion)
Real-time band expansion/contraction based on RSI volatility
The bands provide three advantages:
Shark Fin events only qualify when RSI breaches ADAPTIVE thresholds, not arbitrary fixed levels
Band width (standard deviation) serves as volatility filter—narrow bands = low conviction moves get rejected
50-line midline provides regime context (above 50 = bullish bias, below 50 = bearish bias)
Technical implementation: basis = ta.sma(rsi, 34), dev = ta.stdev(rsi, 34), upper/lower = basis ± dev * 1.618. Shark Fin logic requires rsi < (lower - finBuffer) or rsi > (upper + finBuffer) to trigger, ensuring exhaustion is measured relative to CURRENT volatility, not historical constants.
═══════════════════════════════════════════
METHODOLOGY COMPARISON VS FREE ALTERNATIVES
═══════════════════════════════════════════
STANDARD DIVERGENCE SCRIPTS:
Detection timing: Real-time (current bar)
Historical stability: Repaints continuously
Signal filtering: None or minimal
Volatility adaptation: Fixed levels (30/70)
Exhaustion confirmation: Not implemented
Confirmation layers: 1 (divergence only)
Alert reliability: Unreliable (signals disappear)
SMART DIVERGENCE ENGINE:
Detection timing: Pivot-confirmed (rsi )
Historical stability: Locked at structure bar
Signal filtering: Shark Fin + cooldown + stdev gate
Volatility adaptation: Dynamic bands (34-SMA + 1.618σ)
Exhaustion confirmation: Required via Shark Fin
Confirmation layers: 3 (structure + exhaustion + volatility)
Alert reliability: Stable (never repaints)
═══════════════════════════════════════════
TECHNICAL SPECIFICATIONS
═══════════════════════════════════════════
RSI ENGINE:
Base calculation: ta.rsi(src, 14)
Smoothing: ta.rma(rsiRaw, 2) — reduces whipsaw noise
Source: Configurable (default close)
VOLATILITY BANDS:
Basis: 34-period SMA of RSI
Multiplier: 1.618 (golden ratio)
Upper band: basis + (stdev * 1.618)
Lower band: basis - (stdev * 1.618)
Purpose: Creates adaptive overbought/oversold zones
DIVERGENCE DETECTION:
Pivot confirmation: 10 left bars + 10 right bars (default)
RSI evaluation: Locked at rsi (historical bar, never current)
Bullish divergence: price lower low + RSI higher low
Bearish divergence: price higher high + RSI lower high
Rendering: Lines drawn between last two confirmed pivots with labels
SHARK FIN EXHAUSTION FILTER:
Depth buffer: 1.5 RSI points (penetration threshold beyond band)
Min band stdev: 1.0 (volatility qualification)
Cooldown: 25 bars minimum between Shark Fin confirmations
Slope validation: Requires ta.change(rsi) > 0 (bullish) or < 0 (bearish)
State tracking: Boolean flags prevent premature confirmations
VISUAL CUSTOMIZATION:
Beauty Mode: Six-layer gradient fill anchored at 50-line
• Purple regime (above 50) with configurable opacity
• Green regime (below 50) with configurable opacity
• Gradient layers: 33%, 66%, 100% intensity
Divergence lines: Glow effect (6px) + core line (3px), both configurable
Shark Fin rendering: 20% fill between RSI and violated band (ephemeral)
Labels: Compact "Bull"/"Bear" markers with dot indicators
═══════════════════════════════════════════
ALERT SYSTEM
═══════════════════════════════════════════
Four distinct alert conditions (configure once, fires on all intervals):
"RSI Shark Fin — Bullish"
Triggers when: RSI re-enters lower band from below with slope + stdev + cooldown confirmation
Use case: Momentum exhaustion at oversold extreme
Reliability: No repaint (confirmation locked at re-entry bar)
"RSI Shark Fin — Bearish"
Triggers when: RSI re-enters upper band from above with slope + stdev + cooldown confirmation
Use case: Momentum exhaustion at overbought extreme
Reliability: No repaint (confirmation locked at re-entry bar)
"Bullish Divergence (Panel)"
Triggers when: Pivot-confirmed bullish divergence completes (price LL + RSI HL)
Timing: Fires AFTER Pivot Right bars complete (delayed but stable)
Reliability: Never repaints (divergence locked at rsi )
"Bearish Divergence (Panel)"
Triggers when: Pivot-confirmed bearish divergence completes (price HH + RSI LH)
Timing: Fires AFTER Pivot Right bars complete (delayed but stable)
Reliability: Never repaints (divergence locked at rsi )
═══════════════════════════════════════════
TRADING IMPLEMENTATION
═══════════════════════════════════════════
CONFLUENCE FRAMEWORK:
Highest-probability setups occur when three conditions align:
Bullish Setup:
Shark Fin confirms below lower band (exhaustion)
Bullish divergence prints at pivot (structure)
RSI reclaims 50 line (regime shift to bullish)
→ Entry consideration at next price structure (support, swing low)
Bearish Setup:
Shark Fin confirms above upper band (exhaustion)
Bearish divergence prints at pivot (structure)
RSI loses 50 line (regime shift to bearish)
→ Entry consideration at next price structure (resistance, swing high)
TREND CONTEXT:
Strong uptrends: Prioritize bullish divergence + lower band Shark Fins (buy dips)
Strong downtrends: Prioritize bearish divergence + upper band Shark Fins (sell rallies)
Range-bound markets: Use 50-line crossovers as additional confirmation filter
RISK MANAGEMENT:
Smart Divergence Engine provides CONTEXT, not entries:
Wait for price confirmation (engulfing candle, rejection wick, structure break)
Place stops below/above pivot structure that triggered divergence
Size positions based on distance to invalidation level
Divergence + Shark Fin = elevated probability, not certainty
═══════════════════════════════════════════
CONFIGURATION PARAMETERS
═══════════════════════════════════════════
RSI SETTINGS:
RSI Length: 14 (default, standard momentum window)
Price Source: close (configurable to any price source)
Note: 2-period RMA smoothing is hardcoded (reduces noise)
VOLATILITY BAND SETTINGS:
Band Length: 34 (SMA period for RSI basis)
Band Multiplier: 1.618 (golden ratio, adjustable)
Show Bands: Toggle visibility (true/false)
DIVERGENCE SETTINGS:
Pivot Left: 10 bars (left-side swing confirmation)
Pivot Right: 10 bars (right-side swing confirmation)
Overbought Level: 68 (reference line, does not affect logic)
Oversold Level: 32 (reference line, does not affect logic)
SHARK FIN SETTINGS:
Fin Depth Buffer: 1.5 RSI points (penetration threshold)
Min Band Stdev: 1.0 (volatility qualification gate)
Min Bars Between Fins: 25 (cooldown period)
VISUAL SETTINGS (Beauty Mode):
Enable Beauty Mode: true/false (gradient rendering)
Divergence Glow: true/false (glow effect on lines)
Glow Width: 3-10 px (glow layer thickness)
Main Line Width: 1-6 px (divergence core line)
Top Color: Purple (configurable, above-50 regime)
Bottom Color: Green (configurable, below-50 regime)
Top Opacity: 0-100% (gradient base transparency)
Bottom Opacity: 0-100% (gradient base transparency)
═══════════════════════════════════════════
PERFORMANCE & LIMITATIONS
═══════════════════════════════════════════
RESOURCE ALLOCATION:
max_lines_count: 500 (divergence + Shark Fin lines)
max_labels_count: 500 (divergence markers)
max_bars_back: 500 (historical pivot lookback)
Suitable for most timeframes; reduce limits if performance degrades on low-end devices
SIGNAL TIMING:
Divergences print AFTER Pivot Right bars complete. This is intentional:
Delayed signals are more reliable than real-time signals
Structure confirmation requires waiting for swing completion
Users demanding instant signals should use free real-time divergence indicators
Users demanding reliable signals that never disappear should use this
PANEL VS OVERLAY:
This is the panel version (overlay=false):
Renders in separate pane below price chart
RSI, bands, divergence lines, and Shark Fin fills appear in this pane
For price-chart annotations, use the companion overlay version (same logic, different rendering)
═══════════════════════════════════════════
This script implements proprietary methodology not available in regular community scripts:
REPAINTING-PROOF ARCHITECTURE
The pivot-locked detection system (rsi evaluation) is a non-trivial implementation that requires:
State management across bars using var variables
Historical RSI value storage at pivot confirmation
Divergence comparison between stored values (not current bar)
This architecture eliminates the #1 complaint with free divergence indicators: disappearing signals.
SHARK FIN EXHAUSTION LOGIC
The multi-condition state machine that validates momentum exhaustion is not found in free scripts:
Penetration threshold (buffer beyond band)
Directional slope confirmation on re-entry
Volatility gate (minimum standard deviation)
Cooldown enforcement (prevents clustering)
This filter layer was developed through extensive backtesting to reduce false divergences during choppy conditions.
ADAPTIVE VOLATILITY FRAMEWORK
The dynamic band system (34-SMA + 1.618σ) provides context-aware overbought/oversold detection:
Bands expand in volatile markets → signals adapt to conditions
Bands contract in ranging markets → tighter detection thresholds
50-line regime framework → directional bias context
This approach outperforms fixed-level systems (30/70) that ignore market context.
CONFLUENCE METHODOLOGY
The three-layer confirmation system (structure + exhaustion + volatility) was engineered to answer: "When is a divergence actually tradeable?" Free scripts detect divergence and stop there. Smart Divergence Engine asks: "Did RSI show exhaustion? Is volatility sufficient? Did structure confirm?"
This level of methodological depth—combined with repainting-proof architecture and professional-grade visual implementation—justifies closed-source protection and paid access.
═══════════════════════════════════════════
Smart Divergence Engine is engineered for traders who demand institutional-grade divergence detection without the noise, repainting, and false positives that plague free alternatives.
Access is restricted to maintain signal quality as methodology evolves.
Reversals

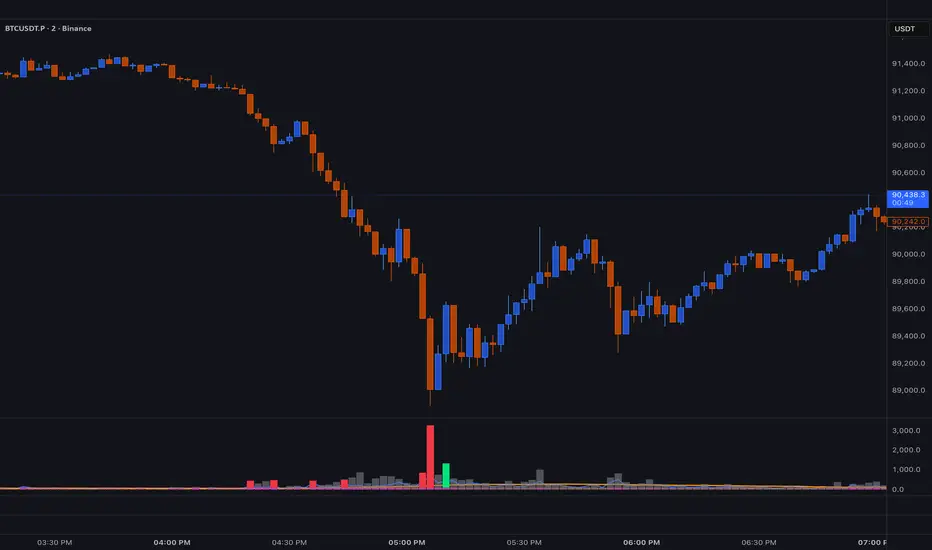
BT SpikeBT Spike is a lightweight but highly effective alert engine designed to identify
moments of unusual volatility and volume expansion . These spikes often appear
at the very beginning of major moves, giving traders early insight into:
Momentum ignition
Breakout confirmation
Liquidity shifts
Stop runs & displacement moves
Trend acceleration
High-impact expansions before news or volatility events
Rather than watching charts all day, BT Spike allows traders to receive
instant alerts whenever the market enters an abnormal volatility regime.
---
■ What BT Spike Measures
1. ATR Spike
Detects sudden expansion in true range (micro-volatility).
This often marks the beginning of a displacement candle.
2. Volume Spike
Identifies candles where volume exceeds typical market participation.
3. Combined Spike
A powerful signal triggered only when both conditions occur together:
ATR Spike AND Volume Spike
4. Spike Score (0–100)
A normalized measure of spike intensity.
• Higher score → Stronger anomaly
• 90+ → Extreme event (liquidity shifts, stop runs, institutional activity)
---
■ Visual Elements
• True Range Line
Shows per-candle volatility relative to baseline ATR.
• Volume Bars (Color-Scaled)
Volume bars turn:
Green for bullish spikes
Red for bearish spikes
Intensity based on Spike Score
Gray during normal activity
This creates a clear volatility heatmap directly in the volume panel.
• Spike Score Histogram
Helps visually identify:
Minor spikes
Major volatility clusters
Extreme anomalies
• Threshold Lines
Yellow = Minor
Orange = Major
Red = Extreme
---
■ Why BT Spike Is Useful
Spike-based analysis helps traders:
Catch large moves early
Confirm breakouts and avoid fake ones
Identify when smart money enters the market
Find the start of momentum legs
Monitor many charts with alerts instead of manual watching
A spike is often the first footprint of a meaningful move.
---
■ Practical Trading Uses
1. Breakout Confirmation
A breakout with no spike is often weak.
A breakout with a spike is typically genuine and sustained.
2. Reversal Detection
Extreme spike after a sweep often signals a reversal event.
3. Trend Ignition
Spikes frequently occur at the beginning of:
Trend legs
News-driven surges
Momentum continuation moves
4. Divergence With Price
High-volume, high-ATR spikes with little price movement can indicate:
Absorption
Trap conditions
Exhaustion
5. Alert-Driven Market Monitoring
Set alerts for:
ATR Spike
Volume Spike
Combined Spike
Major Spike (Score ≥ threshold)
Extreme Spike (Score ≥ threshold)
This allows traders to walk away while still catching every volatility event.
---
■ Spike Score Guide
0–30 → Mild noise
30–60 → Minor shift
60–80 → Strong volatility expansion
80–95 → Major spike (high-impact)
95–100 → Extreme event (institutional presence, sweeps, stop runs)
---
■ Final Summary
BT Spike gives traders:
Early detection of volatility expansion
Bull/Bear intensity visualization
Powerful alert automation
A universal signal layer that fits any strategy
Cleaner insight into where major moves originate
BT Spike = Your volatility radar .
It tells you when to look at a chart—before the move happens.
BT Delta AbsorptionBT Absorption detects aggressive counterflow volume—moments where one side
of the market (buyers or sellers) attacks aggressively, yet price fails to move
proportionally.
This is the classic definition of absorption:
"Large market orders are being absorbed by strong passive limit orders."
Absorption is one of the most reliable early signals for:
Reversals
Trap conditions
Failed breakouts
Liquidity grabs
Fake displacement moves
---
■ What BT Absorption Measures
1. Delta Imbalance
Identifies when buying or selling pressure becomes unusually one-sided.
2. Volatility Mismatch
Shows when large delta does NOT translate into meaningful price movement.
3. Absorption Strength Score
A normalized reading (often 0–100) showing the intensity of counterflow activity.
4. Wick & Structure Absorption
Wick-driven absorption helps identify:
Failed sweeps
Stop hunts
Rejection zones
Trapped traders
---
■ Why Absorption Matters
Absorption almost always precedes:
Reversals
Failed breakout moves
SMC/ICT-style displacement
Order block formation
Trend continuation after a trap
When aggressive traders cannot move price toward their desired direction,
the move typically reverses quickly—and with force.
---
■ Visual Elements
• Bull Absorption Marker
Often appears near lows—signals seller aggression failing to push price down.
• Bear Absorption Marker
Often appears near highs—signals buyer aggression failing to break higher.
• Absorption Score Heatmap (optional)
Shows intensity of absorption per candle.
• Threshold Levels
Identify when absorption becomes statistically significant.
---
■ How to Use BT Absorption in Trading
1. Reversal Detection
Look for absorption after:
Equal highs/lows
Sweeps
Stop runs
Breakout failures
This is often the earliest possible signal that a reversal is coming.
2. Filter Breakouts
A breakout without absorption is usually weak.
A breakout with absorption against it is likely a fakeout.
3. Confirm SMC/ICT Concepts
The indicator pairs perfectly with:
Fair Value Gaps
Order Blocks
Liquidity sweeps
Displacement legs
If your setup triggers and absorption confirms → high confidence.
4. Identify Trap Conditions
Absorption often marks:
Trapped breakout chasers
Trapped trend shorts
Imbalanced orderflow
These create ideal high-R trades.
5. Alert-Driven Market Monitoring
Use alerts for:
Bull Absorption
Bear Absorption
High-strength absorption
Absorption clusters
This allows traders to step away from charts while still catching
high-probability reversals.
---
■ High-Probability Absorption Setups
A) Sweep + Absorption
Swept level → absorption → enter opposite direction.
B) Failed Breakout Absorption
Breaks structure → delta fails → absorption prints → strong reversal.
C) Trend Continuation Absorption
Absorption against the correction often precedes continuation.
D) Absorption Clusters
Multiple absorption signals indicate a structural market shift.
---
■ Final Summary
BT Absorption provides:
Early reversal signals
Counterflow pressure detection
Confirmation for existing setups
Identification of liquidity traps
Alert-based monitoring across multiple markets
BT Absorption is the perfect complement to BT Spike:
• BT Spike = detects volatility ignition
• BT Absorption = detects failed aggression + reversals
Combined, they form a complete liquidity and orderflow toolkit.

Volatility Radar [upslidedown]💎 Overview
Volatility Radar visualizes extreme volatility conditions in a clean, intuitive oscillator format.
Unlike traditional momentum oscillators, it transforms average true range (ATR) behavior into a directional volatility structure, making it easier to spot moments when markets may be shifting into expansion, compression, or potential pivot zones.
💎 How to Use
The oscillator highlights moments when the internal volatility condition becomes active as well as when that condition breaks. These events may coincide with structural turning points, breakout conditions, or volatility expansions. While not a prediction tool, Volatility Radar helps traders identify moments worth paying closer attention to.
💎 Signal Markers
■ Square icons on top/bottom identify when the Volatility Radar condition is ACTIVE
▲▼ Triangle icons on top/bottom identify when the Volatility Radar condition BREAKS
📌 Chart Example:
💎 Oscillator Trends
One of the core features of Volatility Radar is its ability to highlight positive or negative volatility trends. The oscillator automatically colors its components to reflect uptrending vs. downtrending volatility structure, making trend context easier to interpret at a glance.
📌 Chart Example:
💎 Histogram Trends
For users who prefer a more compact or traditional visual style, Volatility Radar includes an optional histogram display mode. This mode provides a clean representation of the detected trend and can be helpful for validating price-action concepts within the broader volatility context.
📌 Chart Example:
💎 Volatility Moving Average
The yellow moving average line offers a volatility moving average that can aid in determining longer term trend strength.
Interpret the trend direction by observing whether the average is increasing/decreasing or above/below the zero line.
Reversals may be observed when values move into oversold territories.
Trend continuation may occur during periods when the average is near the zero line.
Evaluate opportunities when the moving average is "touched" or "pinged" by the radar line (setting available to highlight these crosses).
📌 Chart Example:
💎 Backtesting Support
Volatility Radar outputs external signals designed for use with automated backtesting on TradingView. It integrates with @jason5480’s open-source Template Trailing Strategy and its supporting signal libraries.

Island Reversal [LuxAlgo]The Island Reversal tool allows traders to identify reversal patterns directly on the chart. These patterns signal a potential change in trend, either from bullish to bearish or vice versa.
The tool enables traders to filter these patterns by trend, volume, and range, making it easy to display pure or less constrained island reversals.
🔶 USAGE
An island reversal pattern may indicate a change in trend. It occurs when prices change direction from an uptrend to a downtrend, or vice versa.
This pattern is a great tool for timing the market. Traders should be aware of when these patterns develop and watch how prices behave after the pattern forms.
Now, let's take a closer look at one of these island reversal patterns to highlight its different components.
The different parts are depicted in the image above.
1. A trend prior to the pattern
2. A gap starts the pattern.
3. A range of prices
4. A final gap, opposite to the first one, closes the pattern.
5. In this case, the pattern leads to a bearish trend, which is opposite to the trend in the first step.
🔹 Trend, Volume and Range Filters
Enabling the trend filter causes the tool to only detect top island reversals during a bullish trend and bottom island reversals during a bearish trend.
Traders can adjust the size of the detected trend in the settings panel. The larger the trend size, the more relevant the reversal patterns can be.
The volume filter only detects reversal patterns if there is more volume within the range of the pattern than in the preceding trend.
The idea is that more people tend to participate at the top and bottom of a trend as it changes direction.
The tool has two range filters that discriminate the range within the island reversal pattern:
Horizontality Filter (R2): Based on the R-squared statistic from linear regression, it detects whether the price is moving sideways within the range.
Volatility Filter: Based on long-term volatility, it detects the size of the range within the pattern.
The smaller the value in the Horizontality Filter, the more horizontal the prices will be within the range. A larger value will detect more reversal patterns.
The larger the value in the Volatility Filter, the larger the ranges will be. A smaller value will detect fewer reversal patterns.
🔶 SETTINGS
🔹 Trend Filter
Trend Filter: Enable or disable the trend filter.
Trend Length: Select the size of the detected trend.
🔹 Volume Filter
Volume Filter: Enable or disable the volume filter.
🔹 Range Filter
Horizontality Filter (R2): Enable or disable the Horizontality filter and select a threshold value.
Volatility Filter: Enable or disable the Volatility filter and select the multiplier value.
🔹 Style
Bullish: Select a color for bullish sessions.
Bearish: Select a color for bearish sessions.
Transparency: Select a transparency level from 100 to 0.

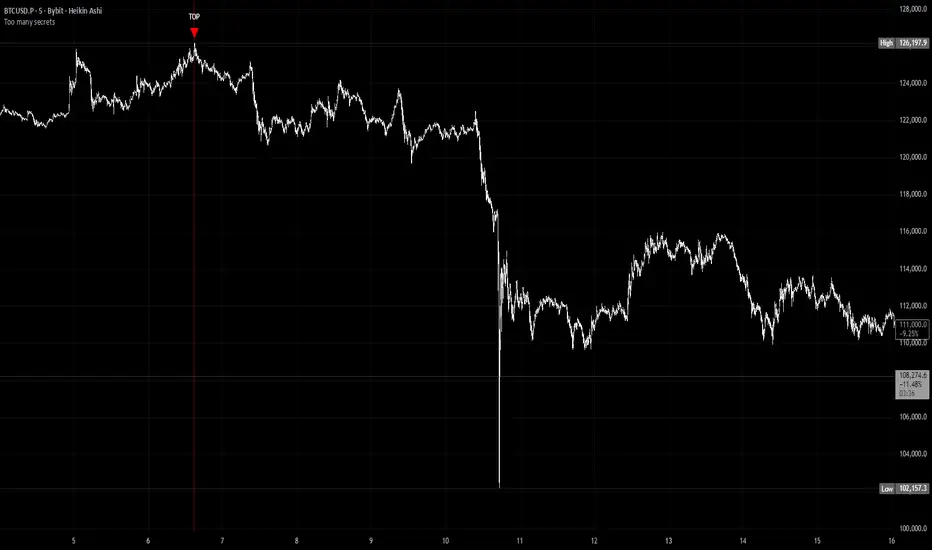
Too many secretsTOO MANY SECRETS - Extreme Condition Signal Detector
This indicator identifies extreme market conditions and provides clear TOP and BOTTOM signals when specific criteria are met. Designed for traders who want reliable entry points without the noise.
KEY FEATURES:
No Repaint - Once a signal prints, it's locked in and will not disappear or change
Smart Filtering - The Blackbox and other proprietary modules prevent signal spam, ensuring only high-quality setups trigger alerts
Customizable Alerts - Use as a multi-symbol screener across different timeframes
Visual Strike Lines - Optional vertical lines mark exact signal locations with adjustable transparency
Clean Interface - Minimal chart clutter with maximum information
CLASSIFIED METHODOLOGY:
The internal workings of this indicator, including the Blackbox module and other signal processing components, are intentionally classified. The specific calculations, timeframes, and confluence requirements remain undisclosed.
RECOMMENDED USAGE:
Best viewed on 5 minute charts
Configure alerts to monitor multiple symbols simultaneously
Adjustable Blackbox parameter allows fine-tuning for your trading style
IMPORTANT NOTES:
Bar Replay: Signals only appear on 5x or faster speeds during replay. In live trading, signals appear instantly in real-time.
This is highly experimental. Not financial advice - trade at your own risk.
WHAT YOU GET:
TOP signals (red triangles) for potential bearish reversals
BOTTOM signals (green triangles) for potential bullish reversals
Alert conditions for automated notifications
Splash screen with setup guidance (can be toggled off)
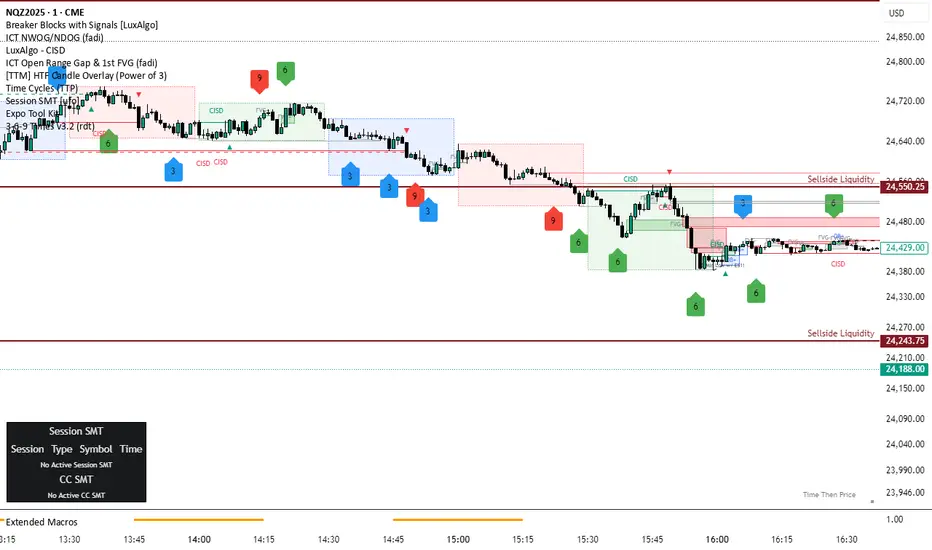
3-6-9 Times v3.2 (rdt)3-6-9 Times v3.1 Indicator Overview
Core Concept
This indicator identifies specific times/dates where the digital root (sum of digits reduced to a single number) equals 3, 6, or 9, which are considered significant in numerology and certain trading methodologies.
How It Calculates Roots:
For Intraday Timeframes (minutes, hours):
Formula: Hour + First Minute Digit + Last Minute Digit → Reduce to single digit
For Daily/Weekly/Monthly Timeframes:
Uses Month + Day calculations with similar digit reduction logic.
Key Features:
1. Break Filter (Default: ON)
Only displays labels after a swing high/low is broken
Prevents clutter by filtering out times that don't coincide with price action
Configurable pivot length (default: 2 bars)
Optional directional filter: green candles must break highs, red candles must break lows
2. Root Selection
Toggle individual roots (3, 6, or 9) on/off
Each root has customizable color
Default colors: Blue (3), Green (6), Red (9)
3. Display Options
Marking Style: Labels, Vertical Lines, or Both
Label Text Format:
Root Only (default) - shows just "3", "6", or "9"
Time/Date Only - shows the actual time/date
Root + Time/Date (separate lines) - shows both
Label Background: Toggle colored box behind text (default: OFF)
Chart Background: Toggle colored background highlight (default: OFF)
Text Color: Customizable (default: black)
4. Session Filter:
Set specific hours/minutes for when to display signals
Default: 00:00 to 23:59 (all day)
Useful for focusing on specific trading sessions
5. Hour Offset
Manual adjustment for timezone/DST issues
Range: -12 to +12 hours
Helps align calculations with your preferred timezone
6. Label Placement
Green candles: Label appears above the bar
Red candles: Label appears below the bar
7. Alerts
Four alert conditions available:
Any 3-6-9 root hit
Specific Root 3 hit
Specific Root 6 hit
Specific Root 9 hit
Typical Use Case
Traders use this to identify potential reversal or continuation points when:
A 3/6/9 time occurs
Price breaks a recent swing high/low
Combining this timing signal with other technical analysis
The indicator helps identify "energetic" time windows that may correlate with increased volatility or directional moves.
Outside the Bollinger Bands Alerting Indicator Overview
The Outside the Bollinger Bands Alerting Indicator is a comprehensive technical analysis tool that combines multiple proven
indicators into a single, powerful system designed to identify high-probability reversal patterns at Bollinger Band extremes. This
indicator goes beyond simple band touches to detect sophisticated pattern formations that often signal strong directional moves.
Key Features & Capabilities
🎯 Advanced Pattern Recognition
Bollinger Band Breakout Patterns
- Detects "pierce-and-reject" formations where price breaks through a Bollinger Band but immediately reverses back inside
- Identifies failed breakouts that often lead to strong moves in the opposite direction
- Combines multiple confirmation signals: engulfing candle patterns, MACD momentum, and ATR volatility filters
- Visual alerts with symbols positioned below (bullish) or above (bearish) candles
Tweezer Top & Bottom Patterns
- Identifies consecutive candles with nearly identical highs (tweezer tops) or lows (tweezer bottoms)
- Requires at least one candle to breach the respective Bollinger Band
- Confirms reversal with directional close requirements
- Customizable tolerance settings for pattern sensitivity
- Visual alerts with ❙❙ symbols for easy identification
📊 Multi-Indicator Integration
Bollinger Bands Indicator
- Dual-band configuration with outer (2.0 std dev) and inner (1.5 std dev) bands that can be adjusted to suit your own parameters
- Configurable MA types: SMA, EMA, SMMA (RMA), WMA, VWMA
- Customizable length, source, and offset parameters
- Color-coded band fills for visual clarity
Moving Average Suite
- EMA 9, 21, 50, and 200 (individually toggleable)
- Special "SMA 3 High" for help visualizing and detecting Bollinger Band break-outs
- Dynamic color coding based on price relationship
Optional Ichimoku Cloud overlay
- Complete Ichimoku implementation with customizable periods
- Dynamic cloud coloring based on trend direction
- Toggleable overlay that doesn't interfere with other indicators
🚨 Comprehensive Alert System
Real-Time JSON Alerts
- Sends structured data on every confirmed bar close
- Includes all indicator values: BB levels, EMAs, MACD, RSI
- Contains signal states and crossover conditions
- Perfect for automated trading systems and webhooks
{"timestamp":1753118700000,"symbol":"ETHUSD","timeframe":"5","price":3773.3,"bollinger_bands":{"upper":3826.95,"basis":3788.32,"lower":3749.68},"emas":{"ema_9":3780.45,"ema_21":3788.92,"ema_50":3800.79,"ema_200":3787.74,"sma_3_high":3789.45},"macd":{"macd":-10.1932,"signal":-11.3266,"histogram":1.1334},"rsi":{"rsi":40.5,"rsi_ma":39.32,"level":"neutral"}}
Specific Alert Conditions
- MACD histogram state changes (rising to falling, falling to rising)
- RSI overbought/oversold crossovers
- All pattern detections (BB Bounce, Tweezer patterns)
- Bollinger Band breakout alerts
🎨 Visual Elements
Pattern Identification
- ♻ symbols for Bollinger Band breakout patterns (green for bullish, red for bearish)
- ❙❙ symbols for tweezer patterns (green below for bottoms, red above for tops)
- Color-coded band fills for trend visualization
Chart Overlay Options
- All moving averages with distinct colors
- Bollinger Bands with inner and outer boundaries
- Optional Ichimoku cloud with trend-based coloring
Trading Applications
Reversal Trading
- Identify high-probability reversal points at extreme price levels
- Use failed breakout patterns for entry signals
- Combine multiple timeframes for enhanced accuracy
Trend Analysis
- Monitor moving average relationships for trend direction
- Use Ichimoku cloud for trend strength assessment
- Track momentum with MACD and RSI integration
Risk Management
- ATR-based volatility filtering reduces false signals
- Multiple confirmation requirements improve signal quality
- Real-time alerts enable prompt decision making
Suggested Use
- Use on multiple timeframes for confluence
- Combine with support/resistance levels for enhanced accuracy
- Set up alerts for hands-free monitoring
- Customize settings based on market volatility and trading style
- Consider volume confirmation for stronger signals

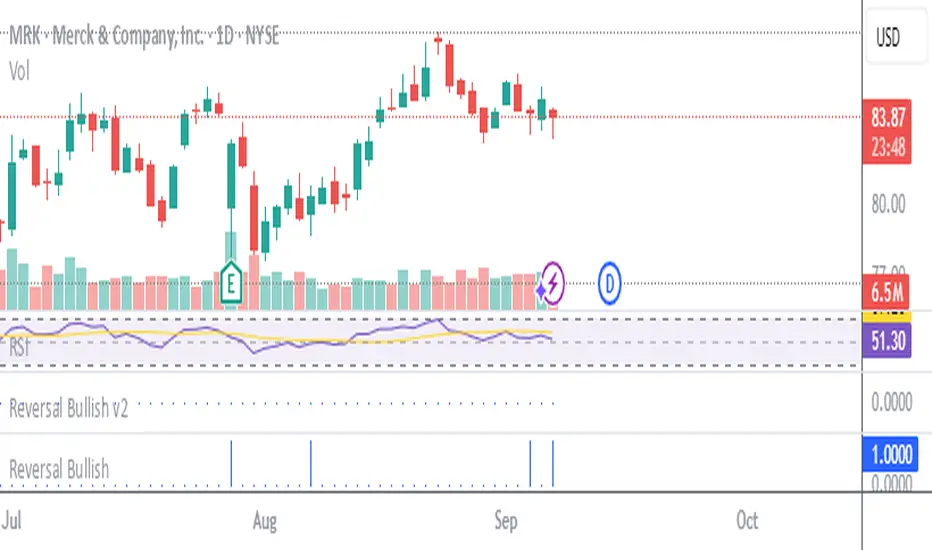
Stockbee Reversal Bullish v2Custom indicator for identifying stocks that meet the Stockbee's Reversal Bullish New criteria. This can be used as a standalone indicator or use it to screen for stocks in Pine Screener.

Stockbee Reversal BullishCustom indicator for identifying stocks that meet the Stockbee's Reversal Bullish criteria. This can be used as a standalone indicator or use it to screen for stocks in Pine Screener.
3 Bar Reversal3 Bar Reversal
This pattern is described in John Carter's "Mastering the Trade"
The 3 Bar Reversal indicator is a simple but effective price action tool designed to highlight potential short-term reversals in market direction. It monitors consecutive bar behavior and identifies turning points based on a three-bar pattern. This tool can assist traders in spotting trend exhaustion or early signs of a reversal, particularly in scalping or short-term trading strategies.
How It Works
This indicator analyzes the relationship between consecutive bar closes:
It counts how many bars have passed since the price closed higher than the previous close (barssince(close >= close )) — referred to as an "up streak".
It also counts how many bars have passed since the price closed lower than the previous close (barssince(close <= close )) — known as a "down streak".
A reversal condition is met when:
There have been exactly 3 bars in a row moving in one direction (up or down), and
The 4th bar closes in the opposite direction.
When this condition is detected, the script performs two actions:
Plots a triangle on the chart to signal the potential reversal:
A green triangle below the bar for a possible long (buy) opportunity.
A red triangle above the bar for a possible short (sell) opportunity.
Triggers an alert condition so users can set notifications for when a reversal is detected.
Interpretation
Long Signal: The market has printed 3 consecutive lower closes, followed by a higher close — suggesting bullish momentum may be emerging.
Short Signal: The market has printed 3 consecutive higher closes, followed by a lower close — indicating possible bearish momentum.
These patterns are common in market retracements and can act as confirmation signals when used with other indicators such as RSI, MACD, support/resistance, or volume analysis.
Usage Examples
Scalping: Use the reversal signal to quickly enter short-term trades after a short-term exhaustion move.
Swing Trading: Combine this with trend indicators (e.g., moving averages) to time pullbacks within larger trends.
Confirmation Tool: Use this indicator alongside candlestick patterns or support/resistance zones to validate entry or exit points.
Alert Setup: Enable alerts based on the built-in alertcondition to receive instant notifications for potential trade setups.
Limitations
The 3-bar reversal logic does not guarantee a trend change; it signals potential reversals, which may need confirmation.
Best used in conjunction with broader context such as trend direction, market structure, or other technical indicators.

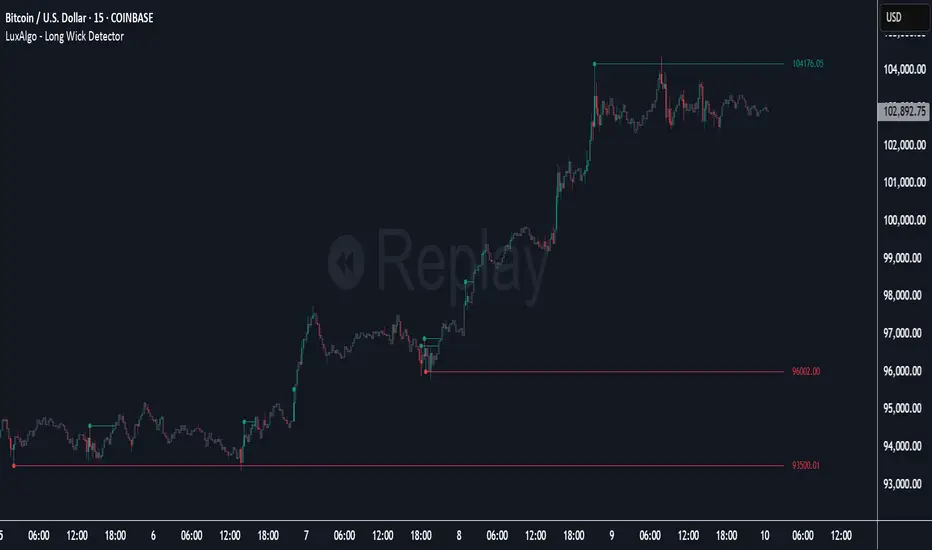
Long Wick Detector [LuxAlgo]The Long Wick Detector tool allows traders to identify candle wicks longer than a user-defined volatility threshold. This makes it useful for spotting zones with high supply or demand.
The tool displays mitigated and unmitigated levels and changes the color of the candles based on wick size and level breakouts.
🔶 USAGE
By default, the tool displays long mitigated and unmitigated candle wicks, with a maximum duration for an unmitigated long wick of 1,000 bars. What does all this mean?
🔹 Wick Threshold
Traders can adjust the volatility threshold to identify long wicks, with a higher threshold detecting more significant wicks.
As we can see in the image above, the tool detects more wicks with a smaller threshold compared to a higher one.
🔹 Level %
Traders can choose the percentage of the wick at which the level is located. By default, the level is displayed at the extremes of the wick. This parameter accepts values between 0 and 100.
100: extreme of the wick
50: middle of the wick
0: start of the wick
🔹 Max Duration
This parameter allows traders to specify the number of bars for the levels. The tool will only display mitigated or unmitigated levels up to the specified number of bars.
As shown in the above image, a longer duration allows more room for mitigation, displaying more levels.
🔹 Colored Candles
The tool allows for color customization using two parameters from the settings panel. The chart shows the different outputs.
The setting "Wick-Based Transparency" makes candles with smaller wicks less visible and candles with longer wicks more visible.
On the other hand, "Breakout-Based Color" changes the base color of the candles based on the mitigation of long wicks. When the price breaks above a detected top wick, the bullish color is used. When the price breaks below a detected bottom wick, the bearish color is used.
🔶 SETTINGS
Wick Threshold: The volatility threshold for wick detection. Use a smaller value to detect smaller wicks.
Level %: Placement of the plotted level relative to the wick.
Max Duration: The maximum duration in bars of mitigated wicks.
Mitigated Wicks: Enable or disable mitigated wicks.
🔹 Style
Wick Based Transparency: Make candles with smaller wicks more transparent and candles with longer wicks more solid.
Breakout Based Color: Change the base color based on wick mitigation.
Bullish & Bearish Colors
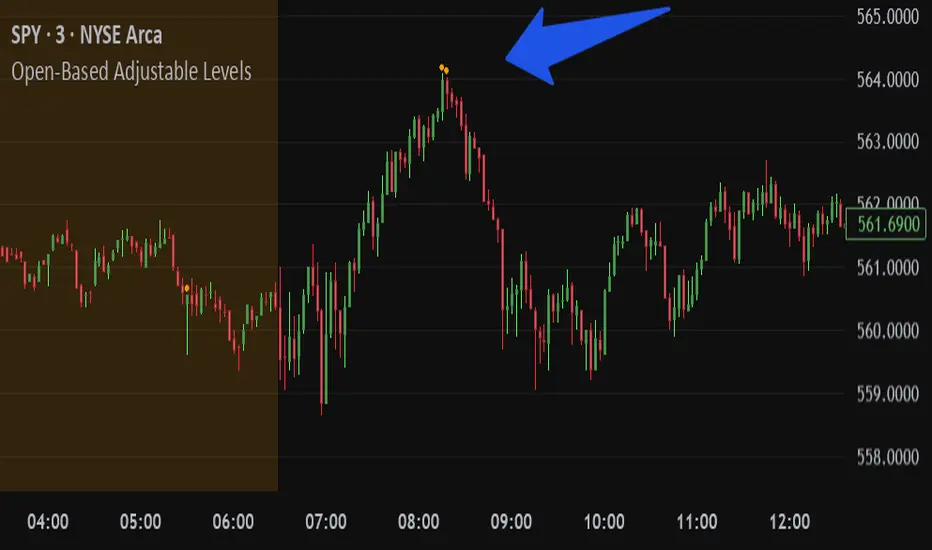
Open-Based Adjustable LevelsThis indicator gives signals for levels where the buy or sell volume is above adjustable levels (ex, volume at 100,000). And these levels will only signal after the price has gone above/below a certain 'adjustable' percentage of the stocks opening price.
Example: Signal sell when the price action is 0.7% above market opening price and when sell volume is above 120,000
or
Signal buy when buy volume is above 80,000 and the price is 0.5% below market opening price.
Great for day trading and detecting potential swings in the market. Above image is on a 3min chart.
Doesn't work as well on daily time frames or above.
Should be combined with other indicators like buy/sell channels, for the best confirmations
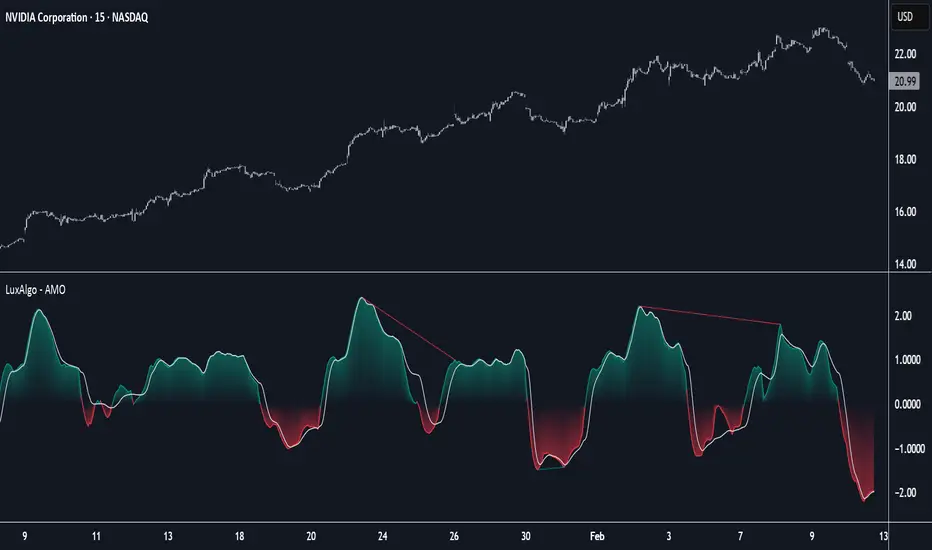
Adaptive Momentum Oscillator [LuxAlgo]The Adaptive Momentum Oscillator tool allows traders to measure the current relative momentum over a given period using the maximum delta in price.
It features a histogram with gradient color, divergences, and an adaptive moving average that allows traders to clearly see the smoothed trend direction.
🔶 USAGE
This unbounded oscillator has positive momentum when values are above 0 and negative momentum when values are below 0. The adaptive moving average is used as a minimum lag smoothing tool over the momentum histogram.
🔹 Signal Line
There are two main uses for the signal line drawn on the chart above.
Momentum crosses above or below the signal line: acceleration in momentum.
Signal line crosses the 0 value: positive or negative momentum.
🔹 Data Length
On the chart above, we can compare different length sizes and how the tool values change, allowing traders to get a shorter or longer-term view of current market strength.
🔹 Smoothing Length
In the previous figure, we can compare how different Smoothing Length values affect the oscillator output.
🔹 Divergences
The divergence detector is disabled by default. Traders can enable it and adjust the divergence length from the settings panel.
As we can see in the chart above, by changing the length of the divergences, traders can fine-tune their detection, a small number will detect smaller divergences, and use a larger number for larger divergences.
🔶 SETTINGS
Data: Select data source, close price by default
Data Length: Select the length for data gathering
Smoothing Length: Select the length for data smoothing
Divergences: Enable/Disable divergences detection and length
Altcoin Reversal or Correction DetectionINDICATOR OVERVIEW: Altcoin Reversal or Correction Detection
Altcoin Reversal or Correction Detection is a powerful crypto-specific indicator designed exclusively for altcoins by analyzing their RSI values across multiple timeframes alongside Bitcoin’s RSI. Since BTC's price movements have a strong influence on altcoins, this tool helps traders better understand whether a reversal or correction signal is truly reliable or just noise. Even if an altcoin appears oversold or overbought, it may continue trending with BTC—so this indicator gives you the full picture.
The indicator is optimized for CRYPTO MARKETS only. Not suitable for BTC itself—this is a precision tool built only for ALTCOINS only.
This indicator is not only for signals but also serves as a tool for observing all the information from different timeframes of BTC and altcoins collectively.
How the Calculation Works: Algorithm Overview
The Altcoin Reversal or Correction Detection indicator relies on an algorithm that compares the RSI values of the altcoin across multiple timeframes with Bitcoin's RSI values. This allows the indicator to identify key market moments where a reversal or correction might occur.
BTC-Altcoin RSI Correlation: The algorithm looks for the correlation between Bitcoin's price movements and the altcoin's price actions, as BTC often influences the direction of altcoins. When both Bitcoin and the altcoin show either overbought or oversold conditions in a significant number of timeframes, the indicator signals the potential for a reversal or correction.
Multi-Timeframe Confirmation: Unlike traditional indicators that may focus on a single timeframe, this tool checks multiple timeframes for both BTC and the altcoin. When the same overbought/oversold conditions are met across multiple timeframes, it confirms the likelihood of a trend reversal or correction, providing a more reliable signal. The more timeframes that align with this pattern, the stronger the signal becomes.
Overbought/Oversold Conditions & Extreme RSI Values: The algorithm also takes into account the size of the RSI values, especially focusing on extreme overbought and oversold levels. The greater the RSI values are in these extreme regions, the stronger the potential reversal or correction signal. This means that not only do multiple timeframes need to confirm the condition, but the magnitude of the overbought or oversold RSI level plays a crucial role in determining the strength of the signal.
Signal Strength Levels: The signals are classified into three levels:
Early Signal
Strong Signal
Very Strong Signal
By taking into account the multi-timeframe analysis of both BTC and the altcoin RSI values, along with the magnitude of these RSI values, the indicator offers a highly reliable method for detecting potential reversals and corrections.
Who Is This Indicator Suitable For?
This indicator can also be used to detect reversal points, but it is especially effective for scalping. It highlights potential correction points, making it perfect for quick entries during smaller market pullbacks or short-term trend shifts, which is more suitable for scalpers looking to capitalize on short-term movements
Integration with other tools
Use this tool alongside key Support and Resistance zones to further enhance your trade by filtering for even better quality entries and focusing only on high-quality reversal or correction setups. It can be also used with other indicators and suitable with other personalised strategies.

Reversals & PullbacksReversals & Pullbacks:
This indicator tries to predict Price reversals and pullbacks.
It works best on the higher timeframes (H4 and D) and was written for currencies but also shows some decent results on Crypto.
Inputs:
- Confirmation: When activated, the indicator waits to print the bullish/bearish signal untill price shows a clear sign of reversal. When not activated, it only looks if it thinks a pullback or reversal is likely to happen without waiting for confirmation. There will be more (false) signals when disabled
- Sensitivity: When set to 0, there will be more (false) signals printed, and when highering this value there will be less signals. The default value is 5 but you can experiment which value works best on what instrument.
- Arrow Distance: can be used to place the arrows further away from price if needed.

Triple Doji SequenceThe Triple Doji Sequence indicator helps traders identify consecutive Doji candlestick patterns, allowing them to choose between spotting single, double, or triple Dojis. A Doji is detected when the candle's body is small relative to its wicks, with either the upper or lower wick being significantly larger. Users can customize their own Doji criteria by adjusting the body size and wick dominance settings. The indicator ensures that consecutive Dojis align in the same direction before confirming a valid pattern, making it easier to identify market indecision or potential trend reversals.
When the chosen Doji sequence is detected, the indicator plots a star (*) above bearish Dojis (upper wick dominant) and below bullish Dojis (lower wick dominant). It also sends alerts when a valid sequence is confirmed at the close of the bar. This tool helps traders refine their strategy by spotting repeated Doji formations, which may indicate key turning points or continuation patterns in price action.
How to Use the Triple Doji Sequence Indicator?
Apply the Indicator:
Add the Triple Doji Sequence indicator to your TradingView chart.
It will automatically scan for Doji patterns based on your settings.
Customize Your Doji Criteria:
Adjust the body size and wick dominance settings to define what qualifies as a Doji.
Choose whether to detect single, double, or triple Doji sequences.
Interpret the Signals:
A star (*) above a candle signals a bearish Doji (upper wick dominant).
A star (*) below a candle signals a bullish Doji (lower wick dominant).
Set Up Alerts:
Enable alerts to receive notifications when a Doji sequence is confirmed at bar close.
Choose alert frequency based on your trading strategy (e.g., once per bar, once per bar close).
Use in Trading Strategy:
Doji sequences can indicate trend reversals or market indecision.
Combine this indicator with support/resistance levels, volume, or other indicators to confirm signals.
PS: Good luck in finding a Triple Doji :)

Wick Volume AlertThis indicator is intended to find a possible price reversal and is well suited for scalping in the smaller timeframes from 1 to 15min chart. It is important to use it in conjunction with other indicators such as order blocks or price levels.
The advantage over other Wick indicators is that volume is also taken into account.
Unfortunately, the markers on the chart do not work properly as they do not attach themselves when moving vertically. I would be happy if someone could fix the problem, as I am not a professional in Pine scripting.

TradingIQ - Reversal IQIntroducing "Reversal IQ" by TradingIQ
Reversal IQ is an exclusive trading algorithm developed by TradingIQ, designed to trade trend reversals in the market. By integrating artificial intelligence and IQ Technology, Reversal IQ analyzes historical and real-time price data to construct a dynamic trading system adaptable to various asset and timeframe combinations.
Philosophy of Reversal IQ
Reversal IQ integrates IQ Technology (AI) with the timeless concept of reversal trading. Markets follow trends that inevitably reverse at some point. Rather than relying on rigid settings or manual judgment to capture these reversals, Reversal IQ dynamically designs, creates, and executes reversal-based trading strategies.
Reversal IQ is designed to work straight out of the box. In fact, its simplicity requires just one user setting, making it incredibly straightforward to manage.
AI Aggressiveness is the only setting that controls how Reversal IQ works.
Traders don’t have to spend hours adjusting settings and trying to find what works best - Reversal IQ handles this on its own.
Key Features of Reversal IQ
Self-Learning Reversal Detection
Employs AI and IQ Technology to identify trend reversals in real-time.
AI-Generated Trading Signals
Provides reversal trading signals derived from self-learning algorithms.
Comprehensive Trading System
Offers clear entry and exit labels.
AI-Determined Profit Target and Stop Loss
Position exit levels are clearly defined and calculated by the AI once the trade is entered.
Performance Tracking
Records and presents trading performance data, easily accessible for user analysis.
Configurable AI Aggressiveness
Allows users to adjust the AI's aggressiveness to match their trading style and risk tolerance.
Long and Short Trading Capabilities
Supports both long and short positions to trade various market conditions.
IQ Channel
The IQ Channel represents what Reversal IQ considers a tradable long opportunity or a tradable short opportunity. The channel is dynamic and adjusts from chart to chart.
IQMA – Proprietary Moving Average
Introduces the IQ Moving Average (IQMA), designed to classify overarching market trends.
IQCandles – Trend Classification Tool
Complements IQMA with candlestick colors designed for trend identification and analysis.
How It Works
Reversal IQ operates on a straightforward heuristic: go long during an extended downside move and go short during an extended upside move.
What defines an "extended move" is determined by IQ Technology, TradingIQ's exclusive AI algorithm. For Reversal IQ, the algorithm assesses the extent to which historical high and low prices are breached. By learning from these price level violations, Reversal IQ adapts to trade future, similar violations in a recurring manner. It calculates a price area, distant from the current price, where a reversal is anticipated.
In simple terms, price peaks (tops) and troughs (bottoms) are stored for Reversal IQ to learn from. The degree to which these levels are violated by subsequent price movements is also recorded. Reversal IQ continuously evaluates this stored data, adapting to market volatility and raw price fluctuations to better capture price reversals.
What classifies as a price top or price bottom?
For Reversal IQ, price tops are considered the highest price attained before a significant downside reversal. Price bottoms are considered the lowest price attained before a significant upside reversal. The highest price achieved is continuously calculated before a significant counter trend price move renders the high price as a swing high. The lowest price achieved is continuously calculated before a significant counter trend price move renders the low price as a swing low.
The image above illustrates the IQ channel and explains the corresponding prices and levels
The blue lower line represents the Long Reversal Level, with the price highlighted in blue showing the Long Reversal Price.
The red upper line represents the Short Reversal Level, with the price highlighted in red showing the Short Reversal Price.
Limit orders are placed at both of these levels. As soon as either level is touched, a trade is immediately executed.
The image above shows a long position being entered after the Long Reversal Level was reached. The profit target and stop loss are calculated by Reversal IQ
The blue line indicates where the profit target is placed (acting as a limit order).
The red line shows where the stop loss is placed (acting as a stop loss order).
Green arrows indicate that the strategy entered a long position at the highlighted price level.
You can also hover over the trade labels to get more information about the trade—such as the entry price, profit target, and stop loss.
The image above demonstrates the profit target being hit for the trade. All profitable trades are marked by a blue arrow and blue line. Hover over the blue arrow to obtain more details about the trade exit.
The image above depicts a short position being entered after the Short Reversal Level was touched. The profit target and stop loss are calculated by the AI
The blue line indicates where the profit target is placed (acting as a limit order).
The red line shows where the stop loss is placed (acting as a stop loss order).
The image above shows the profit target being hit for the short trade. Profitable trades are indicated by a blue arrow and blue line. Hover over the blue arrow to access more information about the trade exit.
Long Entry: Green Arrow
Short Entry: Red Arrow
Profitable Trades: Blue Arrow
Losing Trades: Red Arrow
IQMA
The IQMA implements a dynamic moving average that adapts to market conditions by adjusting its smoothing factor based on its own slope. This makes it more responsive in volatile conditions (steeper slopes) and smoother in less volatile conditions.
The IQMA is not used by Reversal IQ as a trade condition; however, the IQMA can be used by traders to characterize the overarching trend and elect to trade only long positions during bullish conditions and only short positions during bearish conditions.
The IQMA is an adaptive smoothing function that applies a combination of multiple moving averages to reduce lag and noise in the data. The adaptiveness is achieved by dynamically adjusting the Volatility Factor (VF) based on the slope (derivative) of the price trend, making it more responsive to strong trends and smoother in consolidating markets.
This process effectively makes the moving average a self-adjusting filter, the IQMA attempts to track both trending and ranging market conditions by dynamically changing its sensitivity in response to price movements.
When IQMA is blue, an overarching uptrend is in place. When IQMA is red, an overarching downtrend is in place.
IQ Candles
IQ Candles are price candles color-coordinated with IQMA. IQ Candles help visualize the overarching trend and are not used by Reversal IQ to determine trade entries and trade exits.
AI Aggressiveness
Reversal IQ has only one setting that controls its functionality.
AI Aggressiveness controls the aggressiveness of the AI. This setting has three options: Sniper, Aggressive, and Very Aggressive.
Sniper Mode
In Sniper Mode, Reversal IQ will prioritize trading large deviations from established reversal levels and extracting the largest countertrend move possible from them.
Aggressive Mode
In Aggressive Mode, Reversal IQ still prioritizes quality but allows for strong, quantity-based signals. More trades will be executed in this mode with tighter stops and profit targets. Aggressive mode forces Reversal IQ to learn from narrower raw-dollar violations of historical levels.
Very Aggressive Mode
In Very Aggressive Mode, Reversal IQ still prioritizes the strongest quantity-based signals. Stop and target distances aren't inherently affected, but entries will be aggressive while prioritizing performance. Very Aggressive mode forces Reversal IQ to learn from narrower raw-dollar violations of historical levels and also forces it to embrace volatility more aggressively.
AI Direction
The AI Direction setting controls the trade direction Reversal IQ is allowed to take.
“Both” allows for both long and short trades.
“Long” allows for only long trades.
“Short” allows for only short trades.
Verifying Reversal IQ’s Effectiveness
Reversal IQ automatically tracks its performance and displays the profit factor for the long strategy and the short strategy it uses. This information can be found in a table located in the top-right corner of your chart.
The image above shows the long strategy profit factor and the short strategy profit factor for Reversal IQ.
A profit factor greater than 1 indicates a strategy profitably traded historical price data.
A profit factor less than 1 indicates a strategy unprofitably traded historical price data.
A profit factor equal to 1 indicates a strategy did not lose or gain money when trading historical price data.
Using Reversal IQ
While Reversal IQ is a full-fledged trading system with entries and exits, it was designed for the manual trader to take its trading signals and analysis indications to greater heights - offering numerous applications beyond its built-in trading system.
The hallmark feature of Reversal IQ is its sniper-like reversal signals. While exits are dynamically calculated as well, Reversal IQ simply has a knack for "sniping" price reversals.
When performing live analysis, you can use the IQ Channel to evaluate price reversal areas, whether price has extended too far in one direction, and whether price is likely to reverse soon.
Of course, in times of exuberance or panic, price may push through the reversal levels. While infrequent, it can happen to any indicator.
The deeper price moves into the bullish reversal area (blue) the better chance that price has extended too far and will reverse to the upside soon. The deeper price moves into the bearish reversal area (red) the better chance that price has extended too far and will reverse to the downside soon.
Of course, you can set alerts for all Reversal IQ entry and exit signals, effectively following along its systematic conquest of price movement.
Paid script

Cypher Harmonic Pattern [TradingFinder] Cypher Pattern Detector🔵 Introduction
The Cypher Pattern is one of the most accurate and advanced harmonic patterns, introduced by Darren Oglesbee. The Cypher pattern, utilizing Fibonacci ratios and geometric price analysis, helps traders identify price reversal points with high precision. This pattern consists of five key points (X, A, B, C, and D), each playing an important role in determining entry and exit points in the financial markets.
The reversal point typically occurs in the XD region, with the Fibonacci ratio ranging between 0.768 and 0.886. This zone is referred to as the Potential Reversal Zone (PRZ), where traders anticipate price changes to occur.
The Cypher harmonic pattern is popular among professional traders due to its high accuracy in identifying market trends and reversal points. The pattern appears in two forms: bullish Cypher pattern and bearish Cypher pattern.
In the bullish Cypher pattern, after a price correction, the price moves upward, while in the bearish Cypher pattern, the price moves downward after a temporary increase. These patterns help traders use technical analysis to identify strong reversal points in the PRZ and execute more optimal trades.
Bullish Cypher Pattern :
Bearish Cypher Pattern :
🔵 How to Use
The Cypher pattern is one of the most complex and precise harmonic patterns, leveraging Fibonacci ratios to help traders identify price reversals. This pattern is comprised of five key points, each playing a critical role in determining entry and exit points.
The Cypher pattern appears in two main types :
Bullish Cypher pattern : This pattern appears as an M shape on the chart and indicates a trend reversal to the upside after a price correction. Traders can prepare for buying after identifying this pattern in technical analysis.
Bearish Cypher pattern : This pattern appears as a W shape and signals the start of a downtrend after a temporary price increase. Traders can use this pattern to enter short positions.
🟣 How to Identify the Cypher Pattern on a Chart
Identifying the Cypher pattern requires precision and the use of advanced technical analysis tools. The pattern consists of four main legs, each identified using Fibonacci ratios and geometric analysis.
To spot the Cypher pattern on a chart, first, identify the five key points : X, A, B, C, and D.
XA leg : The initial move from point X to A.
AB leg : The first correction after the XA move, where the price moves to point B.
BC leg : After the correction, the price moves upwards to point C.
CD leg : The final price move that reaches point D, where a price reversal is expected.
In a bullish Cypher pattern, point D indicates the start of a new uptrend, while in a bearish Cypher pattern, point D signals the beginning of a downtrend. Correctly identifying these points helps traders determine the best time to enter a trade.
🟣 How to Trade Using the Cypher Pattern
Once the Cypher pattern is identified on the chart, traders can use it to set entry and exit points. Point D is the key point for trade entry. In the bullish Cypher pattern, the trader can enter a long position after point D forms, while in the bearish Cypher pattern, point D serves as the ideal point for entering a short position.
🟣 Entering a Buy Trade with the Bullish Cypher Pattern
In a bullish Cypher pattern, traders wait for the price to reach point D, after which they can enter a buy position. At this point, the price is expected to start rising.
🟣 Entering a Sell Trade with the Bearish Cypher Pattern
In a bearish Cypher pattern, the trader enters a sell position at point D, expecting the price to move downward after reaching this point. For additional confirmation, traders can use technical indicators such as RSI or MACD.
🟣 Risk Management in Cypher Pattern Trades
Risk management is one of the most critical aspects of any trade, and this holds true for trading the Cypher pattern. Traders should always use stop-loss orders to prevent larger losses in case the pattern fails.
In the bullish Cypher pattern, the stop-loss is usually placed slightly below point D to exit the trade if the price continues to drop.
In the bearish Cypher pattern, the stop-loss is placed above point D to limit losses if the price rises unexpectedly.
🟣 Combining the Cypher Pattern with Other Technical Tools
The Cypher pattern is a powerful tool in technical analysis, but combining it with other methods such as price action and technical indicators can improve trading accuracy.
🟣 Combining with Price Action
Traders can use price action to confirm the Cypher pattern. Candlestick patterns like reversal candlesticks can provide additional confirmation for price reversals at point D.
🟣 Using Technical Indicators
Incorporating technical indicators such as RSI and MACD can also help traders receive stronger signals for entering trades based on the Cypher pattern. These indicators help identify overbought or oversold conditions, allowing traders to make more informed decisions.
🟣 Advantages and Disadvantages of the Cypher Pattern in Technical Analysis
Advantages :
High accuracy : The Cypher pattern, using Fibonacci ratios and geometric analysis, provides high precision in identifying reversal points.
Applicable in various markets : This pattern can be used in a wide range of financial markets, including forex, stocks, and cryptocurrencies.
Disadvantages :
Rarit y: The Cypher pattern appears less frequently on charts compared to other harmonic patterns.
Complexity : Accurately identifying this pattern requires significant experience, which may be challenging for novice traders.
🔵 Setting
🟣 Logical Setting
ZigZag Pivot Period : You can adjust the period so that the harmonic patterns are adjusted according to the pivot period you want. This factor is the most important parameter in pattern recognition.
Show Valid Forma t: If this parameter is on "On" mode, only patterns will be displayed that they have exact format and no noise can be seen in them. If "Off" is, the patterns displayed that maybe are noisy and do not exactly correspond to the original pattern.
Show Formation Last Pivot Confirm : if Turned on, you can see this ability of patterns when their last pivot is formed. If this feature is off, it will see the patterns as soon as they are formed. The advantage of this option being clear is less formation of fielded patterns, and it is accompanied by the latest pattern seeing and a sharp reduction in reward to risk.
Period of Formation Last Pivot : Using this parameter you can determine that the last pivot is based on Pivot period.
🟣 Genaral Setting
Show : Enter "On" to display the template and "Off" to not display the template.
Color : Enter the desired color to draw the pattern in this parameter.
LineWidth : You can enter the number 1 or numbers higher than one to adjust the thickness of the drawing lines. This number must be an integer and increases with increasing thickness.
LabelSize : You can adjust the size of the labels by using the "size.auto", "size.tiny", "size.smal", "size.normal", "size.large" or "size.huge" entries.
🟣 Alert Setting
Alert : On / Off
Message Frequency : This string parameter defines the announcement frequency. Choices include: "All" (activates the alert every time the function is called), "Once Per Bar" (activates the alert only on the first call within the bar), and "Once Per Bar Close" (the alert is activated only by a call at the last script execution of the real-time bar upon closing). The default setting is "Once per Bar".
Show Alert Time by Time Zone : The date, hour, and minute you receive in alert messages can be based on any time zone you choose. For example, if you want New York time, you should enter "UTC-4". This input is set to the time zone "UTC" by default.
🔵 Conclusion
The Cypher harmonic pattern is one of the most powerful and accurate patterns used in technical analysis. Its high precision in identifying price reversal points, particularly within the Potential Reversal Zone (PRZ), has made it a popular tool among professional traders. The PRZ, located between the Fibonacci ratios of 0.768 and 0.886 in the XD region, offers traders a clear indication of where price reversals are likely to occur.
However, to use this pattern successfully, traders must employ proper risk management and combine it with supplementary tools like technical indicators and price action. By understanding how to utilize the PRZ, traders can enhance the accuracy of their trade entries and exits.
Ultimately, the Cypher pattern, when used in conjunction with the PRZ, helps traders make more precise decisions in the financial markets, leading to more successful and well-informed trades.

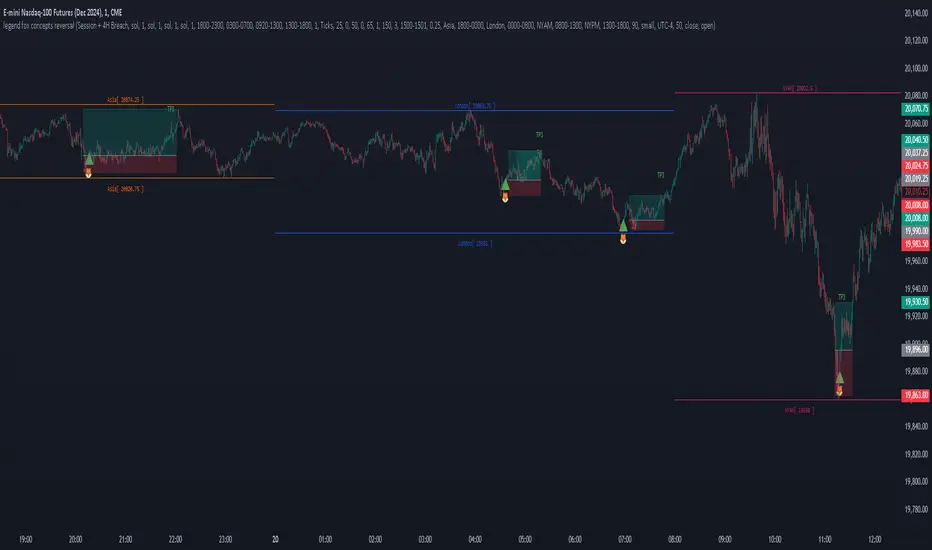
legend fox concepts reversal 2.0
The Legend Fox Concepts Reversal is a comprehensive tool that integrates multiple trading elements, including Trading Sessions, Previous Daily and 4-Hour Levels, and the Imbalance Concept, into a single system designed to help traders identify potential reversal points. The indicator visually highlights these opportunities by generating clear signals, such as green arrows for bullish setups and red arrows for bearish setups. It is particularly effective when applied on shorter timeframes and works best in conjunction with trading futures products, helping traders anticipate market turning points with greater precision.
The indicator is comprised of four essential components, each designed to enhance the trader’s experience and adaptability:
1. Preset Method:
◦ Includes presets that plot Previous Daily and 4-Hour High/Low Levels on the chart, visually distinguished by orange and yellow colors. These levels can be configured in four distinct combinations to suit various trading styles, helping users identify key support and resistance zones. Traders have the option to enable or disable these levels based on their strategy, offering enhanced flexibility and clarity for analyzing potential price reactions.
2. Time Parameters:
◦ Allows users to define specific trading hours based on different financial market sessions worldwide. This component is segmented into four distinct parts, enabling users to customize session times to align with their preferred trading windows. Each segment is color-coded for visual clarity and can be independently enabled or disabled, offering precision in tracking session-specific price action and highlighting relevant market activity.
3. Profit Method:
◦ Supports up to four target price levels, defined in either Ticks or Standard Deviations. This feature is especially useful when trading multiple contracts, allowing for a structured approach to taking profits. Users can customize settings such as Distribution Width, Source of Mean, and Price Reference to standard deviations, tailoring the take-profit strategy to fit unique trading goals.
4. Imbalance Setup:
◦ Refers to the size of gaps between candles, an important factor in anticipating potential reversal signals. Depicted as gray for bullish and blue for bearish imbalances, users can modify the gap width, helping to fine-tune the timing of signals to detect reversals earlier or later depending on market conditions.
Use Case:
• Trading Session Setup:
The trading session is defined by the user as Asia (represented by yellow lines on the chart, with time set between 18:00 - 24:00) and London (depicted by blue lines, with time set between 24:00 - 7:00). This segmentation helps to visually differentiate and track the activity within each session.
• Daily Breach preset:
Next, the Daily Breach preset is applied by enabling the Previous Daily Candle High and Low levels to be displayed on the chart (marked by orange dashed lines). These levels serve as key reference points for potential breakouts or reversals.
• Contract Allocation and Take Profit Setup:
We have input the number of contracts to trade: using 4 contracts for the NQ (Nasdaq Futures). The take-profit levels are defined using ticks. For example, once TP1 is reached at 50 ticks, 2 contracts are closed, leaving the remaining 2 contracts to be closed at TP2, which is set at 100 ticks.
• No Trade Signal Detected:
In this instance, price did not hit any of the Previous Daily High or Low levels, so no trade signal was generated.
• Price Action During the London Session:
Price rallied during the London session, forming bullish imbalances marked by blue areas. It then hit a Previous Daily Level, reversed, and crossed back through the bullish imbalance, indicating a potential reversal. A sell signal was generated, shown as a red arrow, along with a pre-determined stop-loss and two take-profit levels. Additionally, a red dot below indicated a possible downward reversal.
• Successful Take Profit Execution:
Price reached both Target Price 1 and Target Price 2, completing the trade as expected.
By seamlessly integrating these components, the tool empowers users to customize their trading strategies by combining different elements to create unique setups that suit their individual trading styles. Additionally, various presets are available, along with comprehensive guidance on how to leverage the tool to its fullest potential.
N Bar Reversal Detector [LuxAlgo]The N Bar Reversal Detector is designed to detect and highlight N-bar reversal patterns in user charts, where N represents the length of the candle sequence used to detect the patterns. The script incorporates various trend indicators to filter out detected signals and offers a range of customizable settings to fit different trading strategies.
🔶 USAGE
The N-bar reversal pattern extends the popular 3-bar reversal pattern. While the 3-bar reversal pattern involves identifying a sequence of three bars signaling a potential trend reversal, the N-bar reversal pattern builds on this concept by incorporating additional bars based on user settings. This provides a more comprehensive indication of potential trend reversals. The script automates the identification of these patterns and generates clear, visually distinct signals to highlight potential trend changes.
When a reversal chart pattern is confirmed and aligns with the price action, the pattern's boundaries are extended to create levels. The upper boundary serves as resistance, while the lower boundary acts as support.
The script allows users to filter patterns based on the trend direction identified by various trend indicators. Users can choose to view patterns that align with the detected trend or those that are contrary to it.
🔶 DETAILS
🔹 The N-bar Reversal Pattern
The N-bar reversal pattern is a technical analysis tool designed to signal potential trend reversals in the market. It consists of N consecutive bars, with the first N-1 bars used to identify the prevailing trend and the Nth bar confirming the reversal. Here’s a detailed look at the pattern:
Bullish Reversal : In a bullish reversal setup, the first bar is the highest among the first N-1 bars, indicating a prevailing downtrend. Most of the remaining bars in this sequence should be bearish (closing lower than where they opened), reinforcing the existing downward momentum. The Nth (most recent) bar confirms a bullish reversal if its high price is higher than the high of the first bar in the sequence (standard pattern). For a stronger signal, the closing price of the Nth bar should also be higher than the high of the first bar.
Bearish Reversal : In a bearish reversal setup, the first bar is the lowest among the first N-1 bars, indicating a prevailing uptrend. Most of the remaining bars in this sequence should be bullish (closing higher than where they opened), reinforcing the existing upward momentum. The Nth bar confirms a bearish reversal if its low price is lower than the low of the first bar in the sequence (standard pattern). For a stronger signal, the closing price of the Nth bar should also be lower than the low of the first bar.
🔹 Min Percentage of Required Candles
This parameter specifies the minimum percentage of candles that must be bullish (for a bearish reversal) or bearish (for a bullish reversal) among the first N-1 candles in a pattern. For higher values of N, it becomes more challenging for all of the first N-1 candles to be consistently bullish or bearish. By setting a percentage value, P, users can adjust the requirement so that only a minimum of P percent of the first N-1 candles need to meet the bullish or bearish condition. This allows for greater flexibility in pattern recognition, accommodating variations in market conditions.
🔶 SETTINGS
Pattern Type: Users can choose the type of the N-bar reversal patterns to detect: Normal, Enhanced, or All. "Normal" detects patterns that do not necessarily surpass the high/low of the first bar. "Enhanced" detects patterns where the last bar surpasses the high/low of the first bar. "All" detects both Normal and Enhanced patterns.
Reversal Pattern Sequence Length: Specifies the number of candles (N) in the sequence used to identify a reversal pattern.
Min Percentage of Required Candles: Sets the minimum percentage of the first N-1 candles that must be bullish (for a bearish reversal) or bearish (for a bullish reversal) to qualify as a valid reversal pattern.
Derived Support and Resistance: Toggles the visibility of the support and resistance levels/zones.
🔹 Trend Filtering
Filtering: Allows users to filter patterns based on the trend indicators: Moving Average Cloud, Supertrend, and Donchian Channels. The "Aligned" option only detects patterns that align with the trend and conversely, the "Opposite" option detects patterns that go against the trend.
🔹 Trend Indicator Settings
Moving Average Cloud: Allows traders to choose the type of moving averages (SMA, EMA, HMA, etc.) and set the lengths for fast and slow moving averages.
Supertrend: Options to set the ATR length and factor for Supertrend.
Donchian Channels: Option to set the length for the channel calculation.
🔶 RELATED SCRIPTS
Reversal-Candlestick-Structure.
Reversal-Signals.

D-Shape Breakout Signals [LuxAlgo]The D-Shape Breakout Signals indicator uses a unique and novel technique to provide support/resistance curves, a trailing stop loss line, and visual breakout signals from semi-circular shapes.
🔶 USAGE
D-shape is a new concept where the distance between two Swing points is used to create a semi-circle/arc, where the width is expressed as a user-defined percentage of the radius. The resulting arc can be used as a potential support/resistance as well as a source of breakouts.
Users can adjust this percentage (width of the D-shape) in the settings ( "D-Width" ), which will influence breakouts and the Stop-Loss line.
🔹 Breakouts of D-Shape
The arc of this D-shape is used for detecting breakout signals between the price and the curve. Only one breakout per D-shape can occur.
A breakout is highlighted with a colored dot, signifying its location, with a green dot being used when the top part of the arc is exceeded, and red when the bottom part of the arc is surpassed.
When the price reaches the right side of the arc without breaking the arc top/bottom, a blue-colored dot is highlighted, signaling a "Neutral Breakout".
🔹 Trailing Stop-Loss Line
The script includes a Trailing Stop-Loss line (TSL), which is only updated when a breakout of the D-Shape occurs. The TSL will return the midline of the D-Shape subject to a breakout.
The TSL can be used as a stop-loss or entry-level but can also act as a potential support/resistance level or trend visualization.
🔶 DETAILS
A D-shape will initially be colored green when a Swing Low is followed by a Swing High, and red when a Swing Low is followed by a Swing High.
A breakout of the upper side of the D-shape will always update the color to green or to red when the breakout occurs in the lower part. A Neutral Breakout will result in a blue-colored D-shape. The transparency is lowered in the event of a breakout.
In the event of a D-shape breakout, the shape will be removed when the total number of visible D-Shapes exceeds the user set "Minimum Patterns" setting. Any D-shape whose boundaries have not been exceeded (and therefore still active) will remain visible.
🔹 Trailing Stop-Loss Line
Only when a breakout occurs will the midline of the D-shape closest to the closing price potentially become the new Trailing Stop value.
The script will only consider middle lines below the closing price on an upward breakout or middle lines above the closing price when it concerns a downward breakout.
In an uptrend, with an already available green TSL, the potential new Stop-Loss value must be higher than the previous TSL value; while in a downtrend, the new TSL value must be lower.
The Stop-Loss line won't be updated when a "Neutral Breakout" occurs.
🔶 SETTINGS
Swing Length: Period used for the swing detection, with higher values returning longer-term Swing Levels.
🔹 D-Patterns
Minimum Patterns: Minimum amount of visible D-Shape patterns.
D-Width: Width of the D-Shape as a percentage of the distance between both Swing Points.
Included Swings: Include "Swing High" (followed by a Swing Low), "Swing Low" (followed by a Swing High), or "Both"
Style Historical Patterns: Show the "Arc", "Midline" or "Both" of historical patterns.
🔹 Style
Label Size/Colors
Connecting Swing Level: Shows a line connecting the first Swing Point.
Color Fill: colorfill of Trailing Stop-Loss
