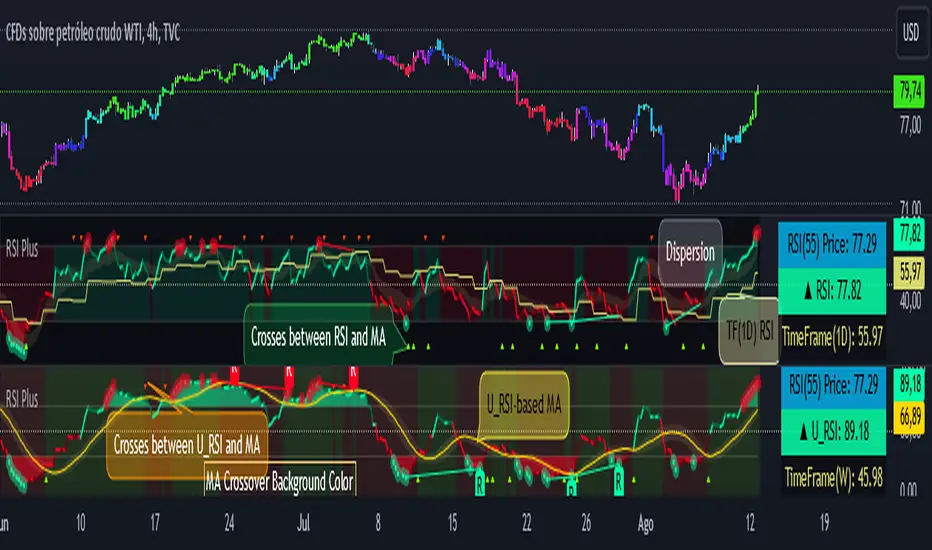
RSI PlusRSI Plus:
☑️ Show the divergences.
☑️ Shows the approximate price of an RSI level (by default it is level 55 but it can be changed for any other level).
☑️ Shows the bulls and bears zones, in green when crossing level 50 up and red when crossing down.
☑️ Circle the highest and lowest levels as possible purchases and sales.
☑️ Includes a smoothed RSI.
RSI Plus:
☑️ Muestra las divergencias.
☑️ Muestra el precio aproximado de un nivel del RSI (por defecto viene el nivel 55 pero se lo puede cambiar por cualquier otro nivel).
☑️ Muestra la zonas de toros y osos, en verde cuando cruza hacia arriba el nivel 50 y rojo cuando cruza hacia abajo.
☑️ Marca con un circulo los niveles mas alto y mas bajos como posibles compras y ventas.
☑️ Incluye un RSI suavizado.
Rsi_oversold
RSI_OverValue with Engulfing candleThis script detects potential trend reverse and Buy or Sell spots.
It works with finding overvalued RSI and Engulfing candle after that and plotting "Buy" or "Sell" signal on price chart.
* Users can change RSI values easily from setting.
Enjoy

Optimized RSI Strategy - Buy The Dips (by Coinrule)Buy low and sell high is every trader's mantra. While this approach looks straightforward in theory, it's sometimes challenging to put into practice. That requires stress-management to buy when price drops and resolution in selling when the price is rising. RSI is a useful tool to implement long-term and effective trading strategies. The script presents an optimized RSI trading strategy that uses a Moving average to spot the best time to buy the dip.
The strategy buys when the RSI is lower than 35, and at the same time, the price is below the MA100. In this way, the approach helps avoid catching early dips, increasing buying when the bottom approaches.
The position closes when the RSI value is above 65 . Depending on the volatility of the coins that the strategy will trade, it's possible to adjust the RSI exit value to chase larger profits.
The setup is optimized on a 15-minutes time frame and trading cryptocurrencies versus USD or stable coins.
The strategies was backtested over 150 times with multiple setups and coin to assess the best long-term system.
The strategy assumes each order to trade 30% of the available capital. A trading fee of 0.1% is taken into account. The fee is aligned to the base fee applied on Binance, which is the largest cryptocurrency exchange.

RSI Support and Resistance Finder [JV] V1Hi Traders.
In my never ending obsession with Support and Resistance , I built an indicator to show the last Support and Resistance Lines based on RSI .
The indicator draws a new Support Line when RSI comes out of oversold and a new Resistance Line when RSI comes out of overbought.
It also shows a panel with the current Support and Resistance Levels.
It's a pretty decent indicator to detect Entry / Exit / Take Profit levels.
This indicator is not to be used as a stand-alone indicator. Add your favourite indicator to get confirmations.
RSI length and overbought / oversold levels can be adjusted in Settings.
Any suggestions or remarks are more than welcome!

RSI on VWAP Upgraded strategyFirst of all, the idea of apply RSI to VWAP was inspired by XaviZ; at least, that where I first saw that.
I simply applied the idea and searched for apply this on lower timeframe (M15) to increase the number of positions and improve the profit factor.
The conditions to enter are the same :
long : enter on RSI crossover oversold level
short : enter on RSI crossunder oversell level
To close position, I found a little change to apply :
long : close position when RSI(VWAP) went in overbought zone and crossunder the overbought level OR after being at least x bars in the overbought zone (parameter is 28 by default) => when the first condition happens
short : close position when RSI(VWAP) went in oversold zone and crossover the oversold level OR after being at least x bars in the oversell zone (parameter is 28 by default) => when the first condition happens
With this change, I got better results specially on BTCUSDTPERP (M15) where I reach a 6.8 profit factor with 119 trades closed. Not BAD !
The defaults parameters are the best found for BTCUSDTPERP (M15), but the strategy works fine for other pairs if you take time to find the rights combinations.
In this strategy you can change (with defaults in () ):
RSI length (28)
RSI overbought level (85)
RSI oversell level (30)
Number of bars before leaving as explain above (28)
The choice to take longs only, shorts only or both
The number of coin/token by position
The start date for backtesting
Please note that the script use a pyramiding parameter of 3 (can be changed in the first line of the script); that means that you can take up to 3 positions before closing. It lets you improve average enter price but increase the risk. 3 is the best I found to improve profit factor without expose myself too much.
This script would be better if automated because of the conditions of buy and sell.
It's only for educative purpose, not an advice to invest.
All my free scripts here : fr.tradingview.com
Leave a message and don't forget to follow me ;) !

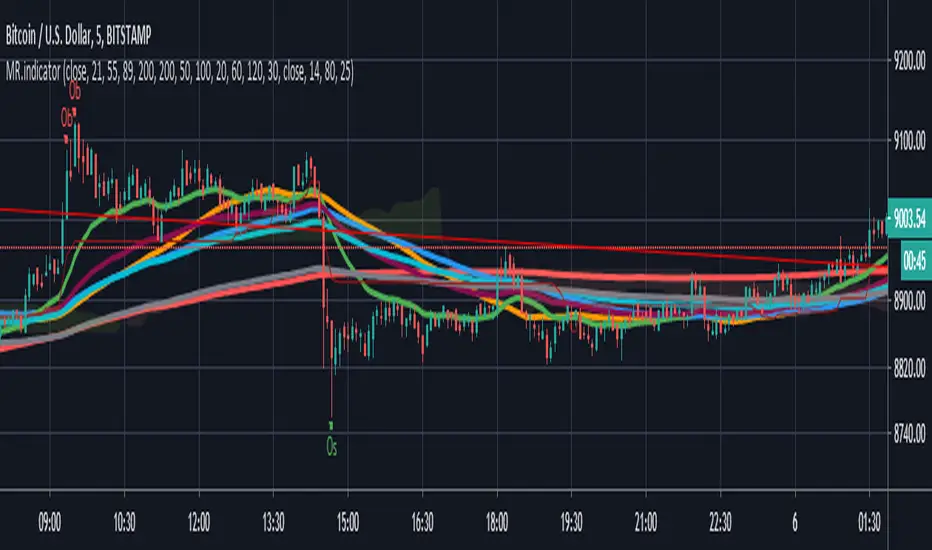
PT RSx RSIVersion 1.0 of our RSx RSI indicator was developed initially as a scalper. It helps determine a possible top/bottom for a specified time frame. The indicator is a modified version of the original RSI . We added a second line to help give you a visual on a bull/bear cross.
Bull crosses at the bottom of the range indicate that the current trend is trying to reverse & vice versa.
We also added a series of Fibonacci levels that act as pivotal areas. We have two highlighted areas that offer volatility . Our Red zone (upper fibs) should prompt you to look for short entries & our Grey zone (mid fibs), which acts as a neutral/range area.
This Oscillator was built around our buy sell indicator & it is used on all time frames for swinging & scalping. It is included as part of the library. Just message us for access!

HM_RSI [By Nitish Sir]Concept by NITISH Sir;
Hilega Milega System;
LONG Entry when RSI is GREEN & Above "dash" line
SHORT Entry when RSI is RED & Below "dash" line
LONG Exit when RSI turns to RED from GREEN
SHORT Exit when RSI turns to GREEN from RED
SIDEWAYS movement when RSI line is BLACK; Wait for pullback or reversals here.
Use on Higher Timeframes only.

[Antipanic] RSI Relative Strength Index EnhancedRSI Enhanced Version
- Additional settings
- Middle line
- Bars coloring
- Overbought/oversold highlighting
- Divergence detection (SOON)
- Use it with other signals
RSI Length = 7 (twice faster than original indicator, change to 14 for default settings).
Simple signals
Blue: buy and don't sell.
Orange: sell and don't buy.
Gray: stay calm.
It is not an investment recommendation. Your use is at your own risk.
Cheers.
Share.
Like.
🤝

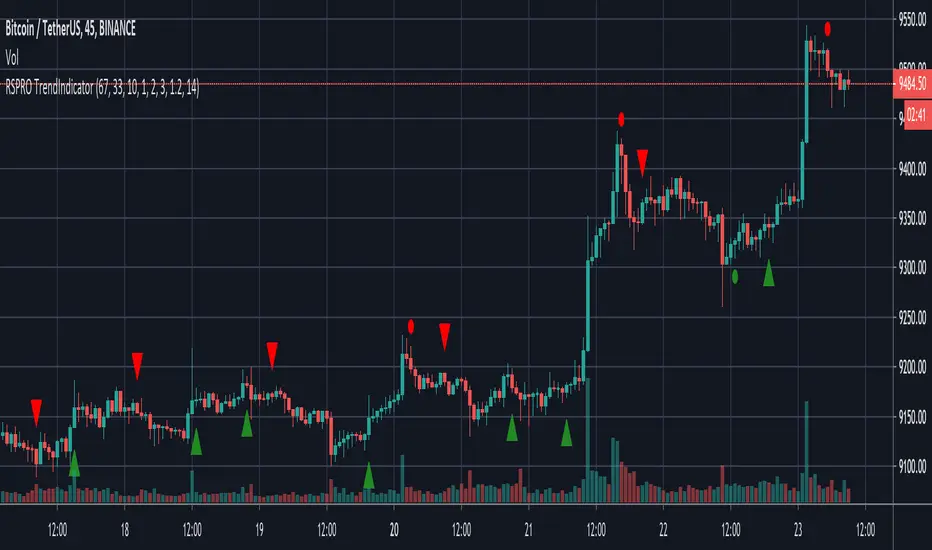
RSPRO TrendIndicatorBased on resistance/support and bollinger band fluctuations this indicator also has filter with x bars after RSI overbought/oversell zones from settings.
Indicator has alerts for LONG(BUY)/SHORT(SELL) signals with green/red squares/triangles. You can setup alerts to use different types of entries.
There are two types of entries and signals: early (usually before trend changes) and main (when trend started to reverse)
Fits for BTC and any altcoins. And any assets. Good for both scalping and position trading (depends on timeframe that you use)
Best use it with big timeframes: 45 and 90min, 2 and 4 hours for position trading.
For scalping 5-30min timeframes are good too.
In Script settings you can specify:
1) RSI period, 14 by default.
2) Show early entries (squares), enabled by defaults.
3) Show main entries (triangles), enabled by defaults.
4) Enable/Disable filter to show main entries only after RSI overbought/oversell regions
Disabled by defaults and RSI is 67 for upper zone and 33 for lower zone.
You can also specify how many bars back before current bar this filter must do. It's 10 by default, you can vary it up to 90.
You can also use only early entries (squares)
Or only main entries (triangles)
Or both (by defaults and i recommend)
This is invite only script. PM me if you want to test it.
Horus RSI Stoch BTC - SPX EMA SpreadHello Traders,
Horus RSI Stoch BTC - SPX EMA Spread is an oscillator based on BITSTAMP:BTC and the SPX500USD EMA spread and may indicate Bitcoin oversold / overbought conditions compared to SPX. You can also setup an other time frame.
How it works?
- Like an RSI but only for BTC
- Setup any time frame you want
- Display Stochastic
- Display StochRSI
- Display Crosses for potential breakout / breakdown
If its indicated overbought, this does not mean it can't go higher. Same the other way around.
Use other indicators and PA for more confluence.
Wuuzzaa

VWAP Relative Strength Index [CC]This is a custom indicator of mine that uses the volume weighted average price instead of the close price as the source for calculations of the relative strength index. Buy when the indicator line is green and sell when it is red.
This was a custom request so let me know if there are any other scripts you would like to see me do or if you want something custom done!

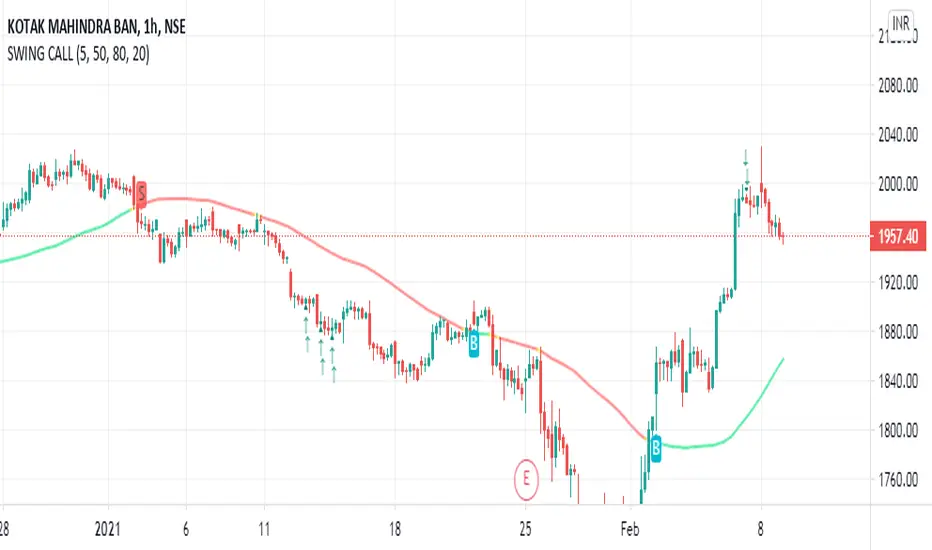
SWING TRADE SIGNALSBUY & SELL Signals for higher timeframes based on Ema & Sma with RSI overbought/oversold dots for possible reversal indication.
It can be used for booking profit in the existing trade and take fresh position once the new candle breaks the high/low of alert candle depending upon the side.
Best work with 1h+ timeframes.
Moving Average With Ichimoku and Rsi hey guys
i post this indicator for who like Ma-Wma-Ichi-Rsi
i used most important Ma on it .
you can see overbuy or oversold on Rsi with a Ob-Os alarm on candel
ichimoku cloud is based on crypto setup
Enjoy
Dont forget to leave a like
~~~~~~~~~~~~~~~~~~~~~~~~~~~~~~~~~~~~~~~~~~~~~~~~~~~~~~~~~~~~~~~~~~~~~
RSi :
Rsi Signals its based on Rsi oscillator that mean you can see when market is overbuy or oversell
note : its not Buy or Sell Signal indicator (please dont use it for finding entry or exit )
~~~~~~~~~~~~~~~~~~~~~~~~~~~~~~~~~~~~~~~~~~~~~~~~~~~~~~~~~~~~~~~~~~~~
Ema-Sma-Wma :
An exponential moving average (EMA) is a type of moving average (MA) that places a greater weight and significance on the most recent data points. The exponential moving average is also referred to as the exponentially weighted moving average. An exponentially weighted moving average reacts more significantly to recent price changes than a simple moving average (SMA), which applies an equal weight to all observations in the period.
~~~~~~~~~~~~~~~~~~~~~~~~~~~~~~~~~~~~~~~~~~~~~~~~~~~~~~~~~~~~~~~~~~~~~~
ichimoku cloud :
My setup on this is different with default setup . which mean i used best setup for crypto to allow you take best result from it .
note : default setup is 9-26-52-26 and my setup is 20-60-120-30
dont forget to follow me and like this post !
Double Smoothed Relative Strength IndexThe Double Smoothed RSI Indicator was created by William Blau (Stocks & Commodities V. 9:5 (202-205)) and is a variation of the classic RSI using his Momenta Indicator and his Momenta RSI formula. I have color coded everything to make it very easy to determine buy and sell signals.
Let me know if you would like to see me write scripts for other indicators!

Momenta Relative Strength IndexThe Momenta RSI Indicator was created by William Blau (Stocks & Commodities V. 9:5 (202-205)) and is a variation of the classic RSI using his Momenta Indicator formula. I have color coded everything to make it very easy to determine buy and sell signals.
Let me know if you would like to see me write scripts for other indicators!

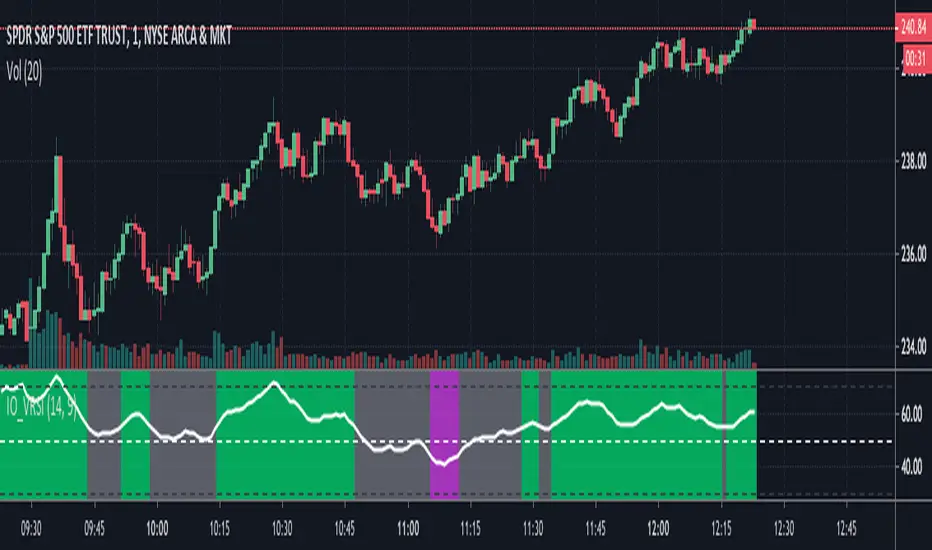
IO_VRSIOriginal Idea by Invsto
In this indicator, I explore the core concepts of RSI and extend it with smoothening to determine volatility.
Usage:
LIME/GREEN : High Volatility and BULLISH trend
RED/FUCHSIA : High Volatility and BEARISH trend
GRAY: Low volatility/Potential Chop Zone
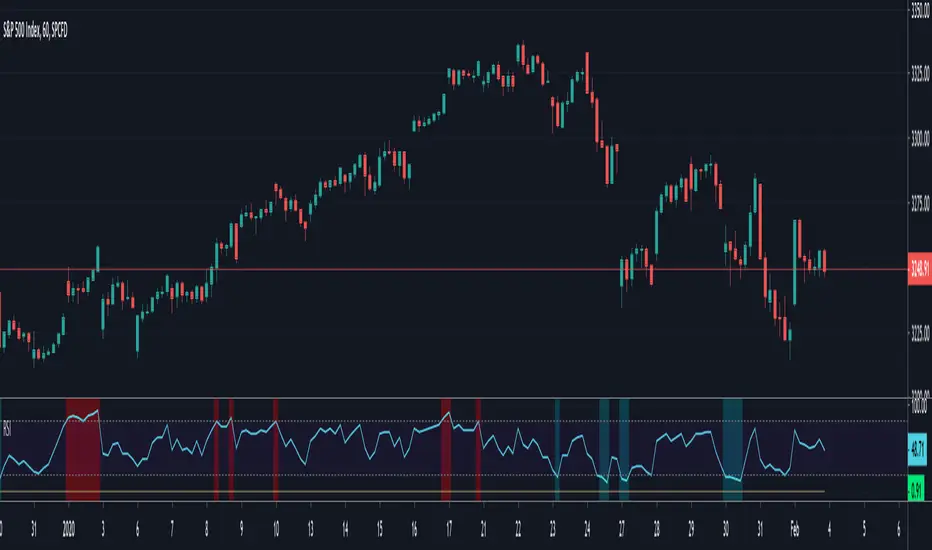
Relative Strength Index with Highlights and Success TestThis script does two things:
1- Highlights extreme levels on RSI
2- Calculates what % of the time, price closed higher (lower) with some minimum threshold when RSI was below oversold (overbought) level in a predefined number of bars.
I use this to understand if buying the dip/selling the rip works for a security and on what time frame and if it could be a profitable strategy that can generate large enough moves.
No guarantees on the accuracy of the code. Let me know if you see anything wrong
Relative Strength Index with HighlightsThis script highlights the indicator background when the RSI exceeds oversold and overbought thresholds making it easier to spot them.
Good for strategies that rely on extreme RSI readings

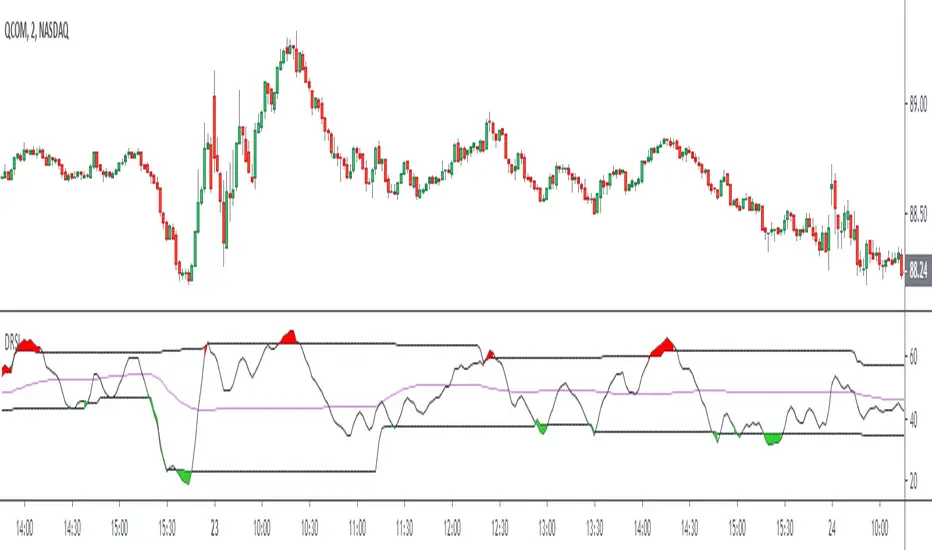
Dynamic RSIThe Dynamic RSI indicator is a kind of exponential RSI. The overbought and oversold levels (respectively HiLine and LoLine) are calculated according to the recent highest and lowest values of the Dynamic RSI line.
Swing Trade Pros - Oversold/Overbought CandlesThe STP Oversold/Overbought Candles is a momentum indicator that measures the magnitude of recent price changes to evaluate overbought or oversold conditions in the price of a stock or other asset. The indicator will turn the candles White on extreme downside or upside volume . When this occurs it’s best to trade in the same direction as momentum. Once the next candle is no longer white a big move in the other direction usually follows.

Ori Visual RSI BandsVisual Representation of Relative Strength Index on price side instead of oscillator. Levels can be adjusted.

RSI with Moving Averages[UO]This RSI indicator is one of my favorite indicators. This powerful indicator is implemented by Phi-Deltalytics. I modified the drawing so that it is easier (at least for me) to see the signals and trends (it would not matter if you're doing algorithmic trading).
Trends and signals. For detailed instructions and tutorial see Phi-Deltalytics page

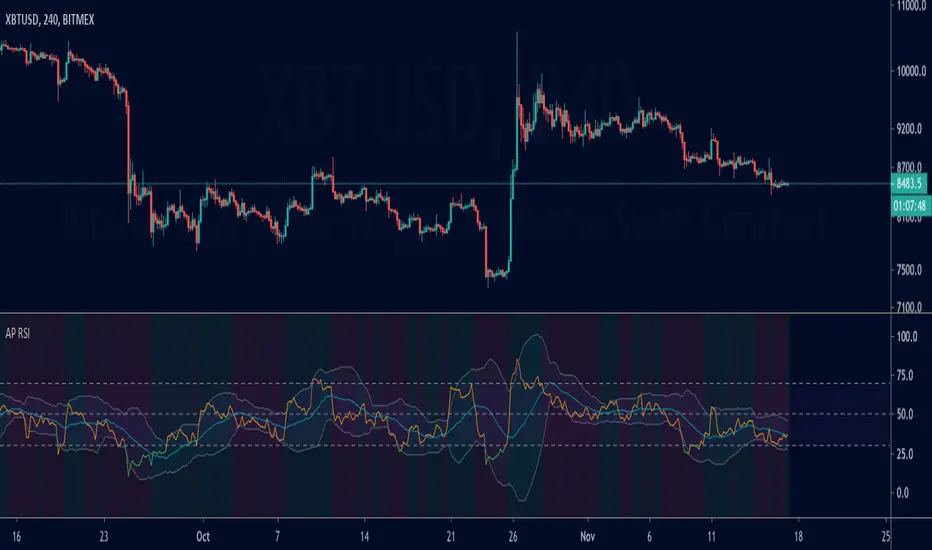
AP RSI-colourd rsi and ris's ema: with the help of this indicator it is more convenient to detect overbought and oversold areas .
OB= rsi > 70
OS= rsi < 30
customisable ema make it easier to find the right ema length for the instrument you are trading on.
hope this indicator helps the community at it's best,
good luck :)
Elliott Surfer