Search in scripts for "天铭科技RSI指标状态"

RSI with small Take Profit - Long-onlyThis script open a long position when RSI < 30 and close the position after a small take profit. No stop loss but if you analyse List of Trades then you'll see that several position are closed for unknow reason.

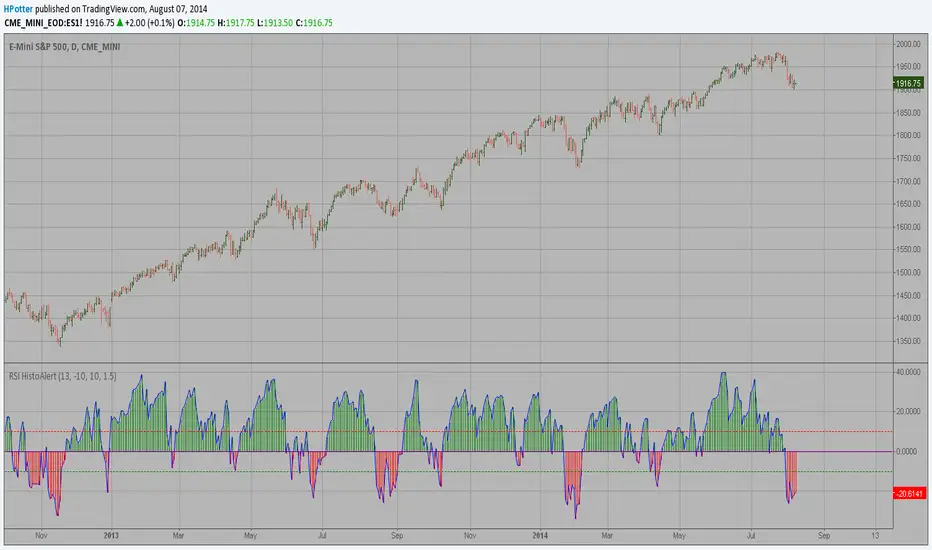
RSI HistoAlert Strategy This simple indicator modified RSI
You can use in the xPrice any series: Open, High, Low, Close, HL2, HLC3, OHLC4 and ect...
You can change long to short in the Input Settings
Please, use it only for learning or paper trading. Do not for real trading.

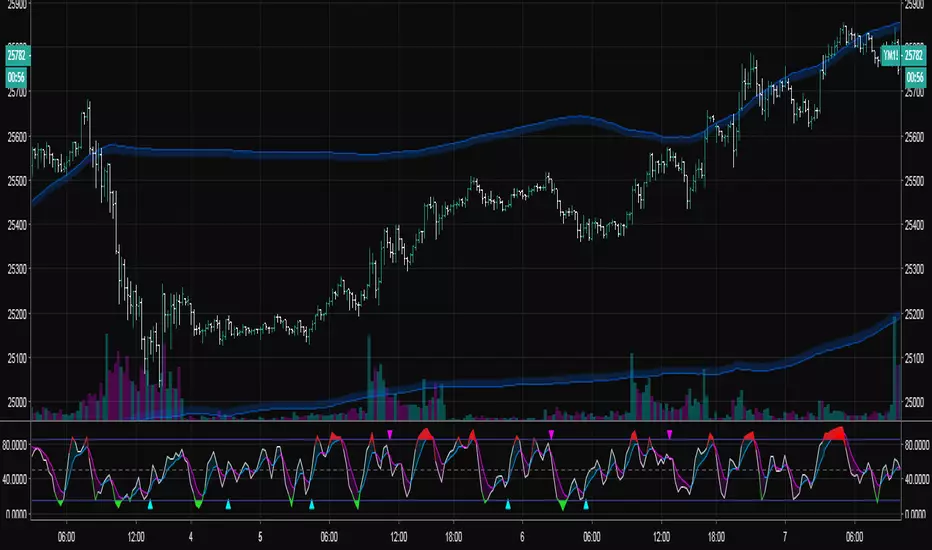
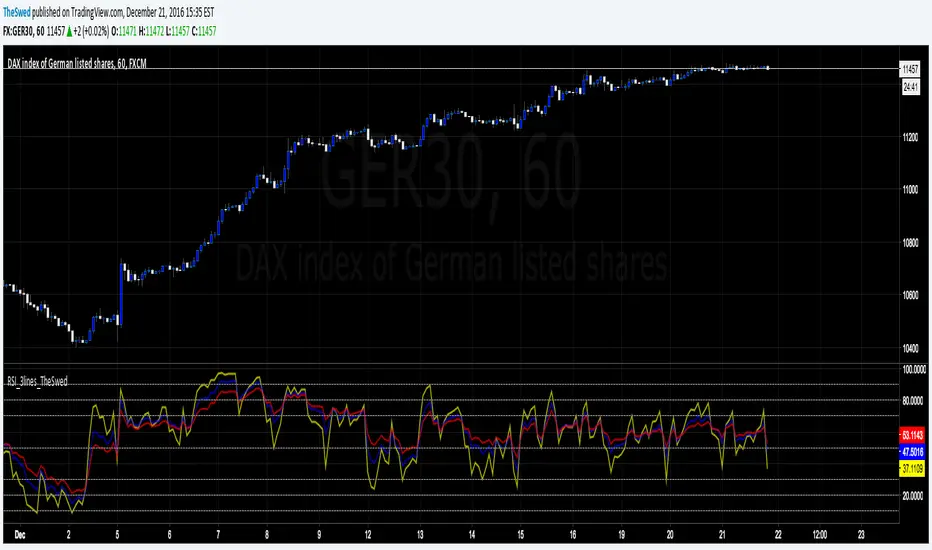
RSI_3lines_TheSwedRSI script with 3 lines. Also added lines: 90, 80, 20 and 10 to the script as I use this for trading.
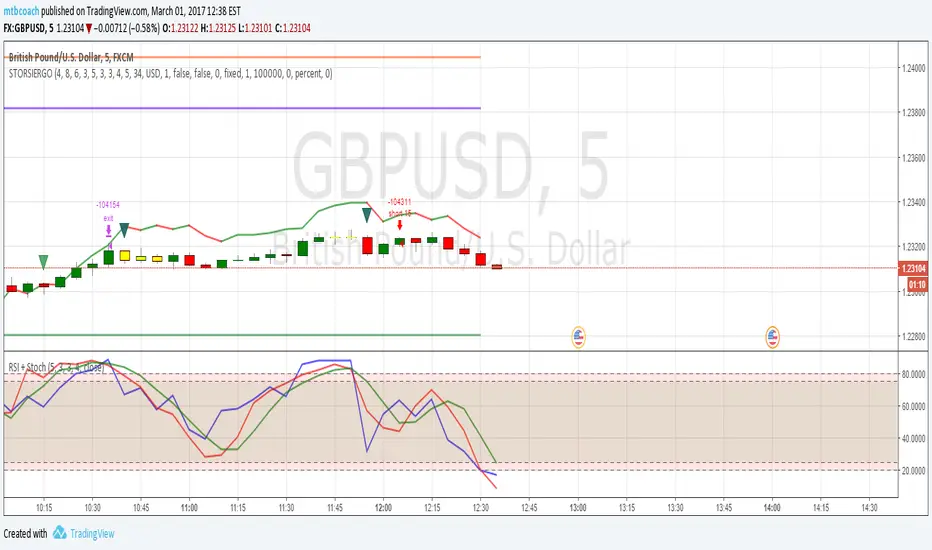
RSI(2) Buy/Sell SignalLong/Short entry signaling based on extreme RSI-2 values. The modeling indicates this a good strategy. It's possible to improve profitability by using discretion to enter trades at a more optimal price (i.e. close of the signaled day rather than the open of the following day) and to let the trades run a little longer, but I have not been successful in scripting those scenarios.

RSI Oversold/UndersoldThe study script will place GREEN BUY arrows BELOW oversold conditions and RED SHORT arrows ABOVE overbought conditions. You can configure the period
Most RSI(14) indicators use a 14-period, I prefer a 5-period. The period, overbought and oversold periods are settings that can easily be changed by adding this study to your chart and clicking the "gear" icon next to the study inside your chart.

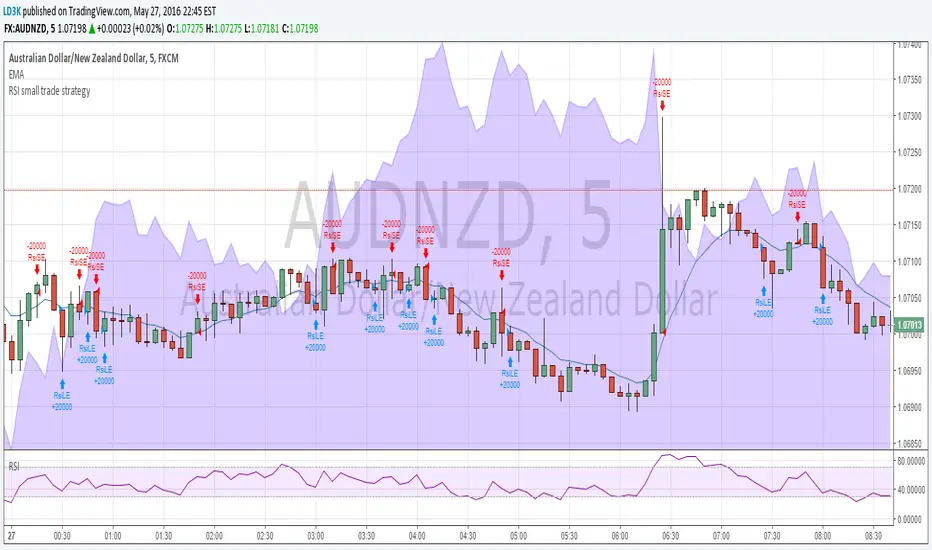
RSI small trade strategyTrialling a small gains strategy.
Unfortunately it caps out at 2000 trades otherwise I would be improving the maximum loss of stopping out trades once the RSI entered an overbought or oversold region
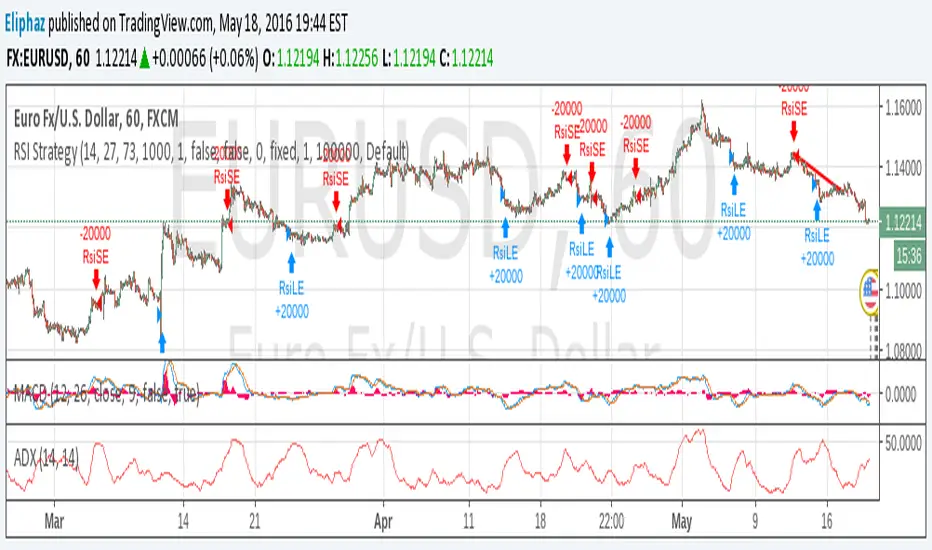
RSI Strategy EUR/USD 1H 700%A rsi strategy that has potential to do over 700% annually on the EURUSD 1h


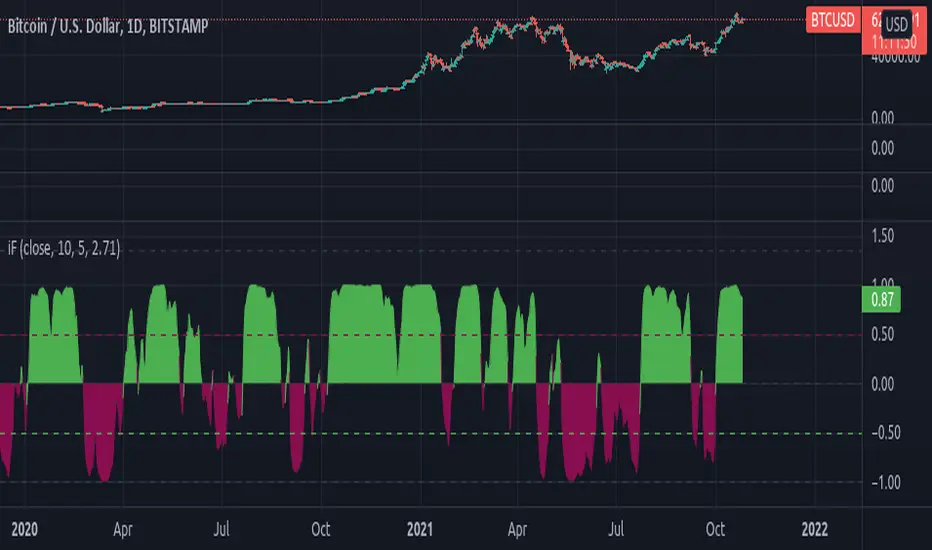
[RS]RSI Inverse Fisher Transform V1RSI inverse fisher transform (fishy turbo) as described here:
autotradingstrategy.wordpress.com
forexsb.com
update:
added color conditional.
[RS]RSI Inverse Fisher Transform V0RSI inverse fisher transform (fishy turbo) as described here:
autotradingstrategy.wordpress.com
forexsb.com

RSI InertiaRedline - vanilla RSI (where are we now)
Aqua - first difference/moment (how fast are we going)
Grey/Green - Second difference/moment (are we speeding up / slowing down?) aka Inertia

RSI-EMA IndicatorThis indicator calculates and plots 2 separate EMAs of the RSI. The default settings below work great on SPX/SPY daily chart. General rule is if an EMA is above 50, the stock's near term outlook is bullish. If an EMA is below 50, the near term outlook is bearish. Personally, I like to use a fast EMA as a buy signal and a slow EMA as a sell signal.
Default settings:
RSI = 50
EMA1 = 100
EMA2 = 200


RSI HistoAlert StrategyThis is simple indicator modified RSI Strategy
You can use in the xPrice any series: Open, High, Low, Close, HL2, HLC3, OHLC4 and ect...

RSI HistoAlertThis is simple indicator modified RSI
You can use in the xPrice any series: Open, High, Low, Close, HL2, HLC3, OHLC4 and ect...
RSI CandlesCan be used as a 50 level cross by rsi or as overbought/oversold by setting the levels accordingly eg 70/30

AI-Weighted RSI (Zeiierman)█ Overview
AI-Weighted RSI (Zeiierman) is an adaptive oscillator that enhances classic RSI by applying a correlation-weighted prediction layer. Instead of looking only at RSI values directly, this indicator continuously evaluates how other price- and volume-based features (returns, volatility, volume shifts) correlate with RSI, and then weights them accordingly to project the next RSI state.
The result is a smoother, forward-looking RSI framework that adapts to market conditions in real time.
By leveraging feature correlation instead of static formulas, AI-Weighted RSI behaves like a lightweight learning model, adjusting its emphasis depending on which features are most aligned with RSI behavior during the current regime.
█ How It Works
⚪ Feature Extraction
Each bar, the script computes features: log returns, RSI itself, ATR% (volatility), volume, and volume log-change.
⚪ Correlation Screening
Over a rolling learning window, it measures the correlation of each feature against RSI. The strongest relationships are ranked and selected.
⚪ Adaptive Weighting
Features are standardized (z-scored), then combined using their signed correlations as weights, building a rolling, adaptive prediction of RSI.
⚪ Prediction to RSI Weight
The predicted RSI is mapped back into a “weight” scale (±2 by default). Above 0 = bullish bias, below 0 = bearish bias, with color-graded fills to visualize overbought/oversold pressure.
⚪ Signal Line
A smoothing option (signal length) overlays a moving average of the AI-Weighted RSI for clearer trend confirmation.
█ Why AI-Weighted RSI
⚪ Adaptive to Market Regime
Because the model re-evaluates correlations continuously, it naturally shifts which features dominate, sometimes volatility explains RSI best, sometimes volume, sometimes returns.
⚪ Forward-Looking Bias
Instead of simply reflecting RSI, the model provides a projection, helping anticipate shifts in momentum before RSI itself flips.
█ How to Use
⚪ Directional Bias
Read the RSI relative to 0. Above = bullish momentum bias, below = bearish.
⚪ Overbought / Oversold Zones
Shaded fills beyond +0.5 or -0.5 highlight extremes where RSI pressure often exhausts.
⚪ Divergences
When price makes new highs/lows but AI-Weighted RSI fails to confirm, it often signals weakening momentum.
█ Settings
RSI Length: Lookback for the core RSI calculation.
Signal Length: Smoothing applied to the AI-Weighted RSI output.
Learning Window: Bars used for correlation learning and z-scoring.
-----------------
Disclaimer
The content provided in my scripts, indicators, ideas, algorithms, and systems is for educational and informational purposes only. It does not constitute financial advice, investment recommendations, or a solicitation to buy or sell any financial instruments. I will not accept liability for any loss or damage, including without limitation any loss of profit, which may arise directly or indirectly from the use of or reliance on such information.
All investments involve risk, and the past performance of a security, industry, sector, market, financial product, trading strategy, backtest, or individual's trading does not guarantee future results or returns. Investors are fully responsible for any investment decisions they make. Such decisions should be based solely on an evaluation of their financial circumstances, investment objectives, risk tolerance, and liquidity needs.

3-Bar Break + Momentum (RSI + 1:3 Lines) - Sharad v2📖 Description
This indicator is designed to detect 3-Bar Breakout + Momentum patterns with additional RSI confirmation and 1:3 risk-to-reward targets.
🔹 Features
Signal Detection (Long & Short)
Visual Elements
Boxes around the last 3 bars when a valid setup occurs
Arrows for Long/Short entry markers
Checklist table showing which conditions were satisfied
Stop Loss & Target lines (1:3 R:R):
For Long:
Red SL line at Low
Green TP line at High + 3 × (High − Low )
For Short:
Red SL line at High
Green TP line at Low − 3 × (High − Low )
Lines are only drawn for the current active trade (not past signals)
Alerts
Long Signal
Short Signal
Either Signal
📊 How to Use
Add the indicator to your chart.
Enable alerts from the "Alerts" menu to be notified when Long/Short conditions are met.
Use the 1:3 SL/TP lines for trade planning and risk management.
Combine with higher timeframe context, trend filters (EMA/200, ATR, etc.), and volume analysis for stronger results.
⚠️ Disclaimer
This indicator is a technical analysis tool, not financial advice.
Trading involves substantial risk and may result in loss of capital.
Do your own research, backtest strategies thoroughly, and always apply proper risk management.
The author of this script is not responsible for any trading losses.
Use at your own risk.
👉 This tool is ideal if you want clear breakout entries, RSI-filtered confirmation, and built-in SL/TP visualization in one clean package.
