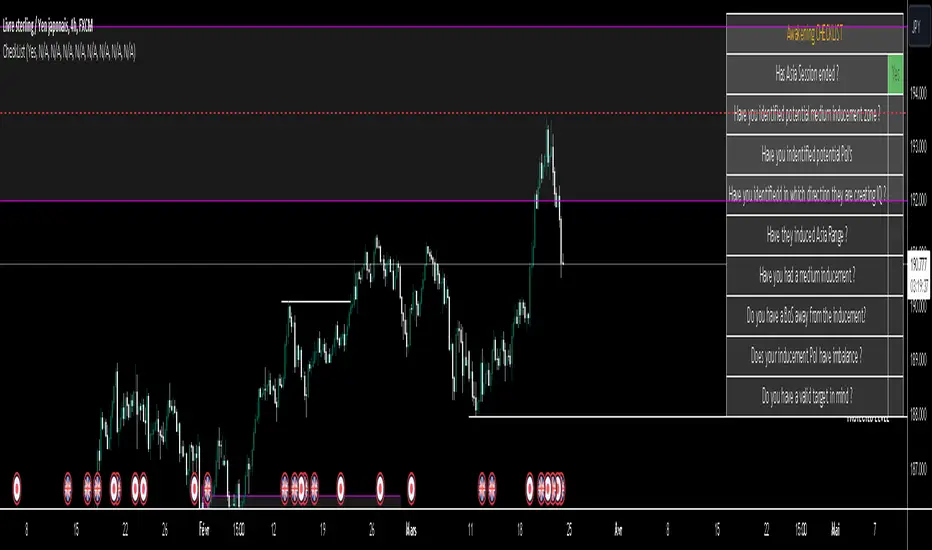
LIT - Awakening CheckList v.1The Awakening Checklist indicator is a tool designed to help traders evaluate certain key market conditions and elements before making trading decisions. It consists of a series of questions that the trader must answer using the options "Yes", "No" or "N/A" (not applicable).
“Has Asia Session ended?” : This question aims to determine if the Asian trading session has ended. The answer to this question can influence trading strategies depending on market conditions.
“Have you identified potential medium induction?” : This question concerns the identification of potential average inductions on the market. Recognizing these inductions can help traders anticipate future price movements.
"Have you identified potential PoI's": This question asks about the identification of potential points of interest on the market. These points of interest can indicate areas of significant support or resistance.
"Have you identified in which direction they are creating lQ?" : This question aims to determine in which direction market participants create liquidity (lQ). Understanding this dynamic can help make informed trade decisions.
“Have they induced Asia Range”: This question concerns the induction of the Asian range by market participants. Recognizing this induction can be important in assessing future price movements.
“Have you had a medium induction”: This question asks about the presence of a medium induction on the market. The answer to this question can influence trading prospects.
“Do you have a BoS away from the induction”: This question aims to find out if the trader has an offer (BoS) far from the identified induction. This can be a risk management strategy.
"Doas your induction PoI have imbalance": This question concerns the imbalance of points of interest (PoI) linked to induction. Recognizing this imbalance can help anticipate price movements.
“Do you have a valid target in mind”: This question aims to find out if the trader has a clear trading objective in mind. Having a goal can help guide trading decisions and manage risk.
Release Notes
The Awakening Checklist indicator is a tool designed to help traders evaluate certain key market conditions and elements before making trading decisions. It consists of a series of questions that the trader must answer using the options "Yes", "No" or "N/A" (not applicable).
Search in scripts for "BOS"

DTFX Algo Zones [LuxAlgo]DTFX Algo Zones are auto-generated Fibonacci Retracements based on market structure shifts.
These retracement levels are intended to be used as support and resistance levels to look for price to bounce off of to confirm direction.
🔶 USAGE
Due to the retracement levels only being generated from identified market structure shifts, the retracements are confined to only draw from areas considered more important due to the technical Break of Structure (BOS) or Change of Character (CHoCH).
The simple action that causes a market structure shift occurs is price breaking above or below a specific swing point. When a market structure shift happens, a retracement is drawn from the point of break to the highest or lowest point since that point. Due to the price action necessary for a market structure shift, these retracements will not always be immediately actionable.
These retracement levels are intended to be used as points to watch for price to retrace to and bounce from, confirming the current direction of price.
In the example below, after the retracement is initiated, by bouncing off of the retracement levels formed from the previous market structure shift it would further confirm the bias of the market structure shift. A break going through these levels would display a weakness from the current market structure shift, implying that it could simply be noise.
🔶 DETAILS
The script uses standard SMC Market structure identification to determine Break of Structures (BOS) and Change of Characters (CHoCH). The specific swing points can be identified by the shapes placed above or below the specific swing high/low candle.
By unchecking the "Display All Zones" setting, users are able to specify the exact number of retracement zones to display using the "Show Last" parameter. This is handy for cleaning up the chart to stay focused on the most recent retracements.
Additionally, when displaying multiple zones, the "Clean-Up Level Overlap" setting may be helpful for decluttering as well. This option optimizes the display of retracement levels to minimize their overlap on other adjacent zones.
The script allows for up to 5 Fib levels to be displayed from each zone, with options for display, value, line style, and color for each of the 5.
The calculation for Fib Levels changes depending on the direction of market structure shifts. When an upwards (Bullish) zone is generated, the retracement is drawn with the bottom of the zone being 0 and the top of the zone being 1. This is reversed for downwards (Bearish) zones.
🔶 SETTINGS
Structure Length: Sets the SMC structure length to use for finding MMS.
Show Last: Displays this number of retracement zones. (Display All Zones Must be Unchecked)
Display All Zones: Ignores "Show Last" number and displays all historical MMS Retracement Zones.
Zone Display: Choose which zones to display, only bearish, only bullish, or both.
Clean-Up Level Overlap: Minimizes overlap between adjacent zones and levels.
Fib Levels: Settings to display and customize up to 5 Fib levels for each zone.

Smart Money Concepts by WeloTradesThe "Smart Money Concepts by WeloTrades" indicator is designed to offer traders a comprehensive tool that integrates multiple advanced features to aid in market analysis. By combining order blocks, liquidity levels, fair value gaps, trendlines, and market structure analysis, the indicator provides a holistic approach to understanding market dynamics and making informed trading decisions.
Components and Their Integration:
Order Blocks and Breaker Blocks Detection
Functionality: Order blocks represent areas where significant buying or selling occurred, creating potential support or resistance zones. Breaker blocks signal potential reversals.
Integration: By detecting and visualizing these blocks, the indicator helps traders identify key levels where price might react, aiding in entry and exit decisions. The customizable settings allow traders to adjust the visibility and parameters to suit their specific trading strategy.
Liquidity Levels Analysis
Functionality: Liquidity levels indicate zones where significant price movements can occur due to the presence of large orders. These are areas where smart money might be executing trades.
Integration: By tracking these high-probability liquidity areas, traders can anticipate potential price movements. Customizable display limits and mitigation strategies ensure that the information is tailored to the trader’s needs, providing precise and actionable insights.
Fair Value Gaps (FVG)
Functionality: Fair value gaps highlight areas where there is an imbalance between buyers and sellers. These gaps often represent potential trading opportunities.
Integration: The ability to identify and analyze FVGs helps traders spot potential entries based on market inefficiencies. The touch and break detection functionalities provide further refinement, enhancing the precision of trading signals.
Trendlines
Functionality: Trendlines help in identifying the direction of the market and potential reversal points. The additional trendline adds a layer of confirmation for breaks or retests.
Integration: Automatically drawn trendlines assist traders in visualizing market trends and making decisions about potential entries and exits. The additional trendline for stronger confirmation reduces the risk of false signals, providing more reliable trading opportunities.
Market Structure Analysis
Functionality: Understanding market structure is crucial for identifying key support and resistance levels and overall market dynamics. This component displays internal, external, and composite market structures.
Integration: By automatically highlighting shifts in market structure, the indicator helps traders recognize important levels and potential changes in market direction. This analysis is critical for strategic planning and execution in trading.
Customizable Alerts
Functionality: Alerts ensure that traders do not miss significant market events, such as the formation or breach of order blocks, liquidity levels, and trendline interactions.
Integration: Customizable alerts enhance the user experience by providing timely notifications of key events. This feature ensures that traders can act quickly and efficiently, leveraging the insights provided by the indicator.
Interactive Visualization
Functionality: Customizable visual aspects of the indicator allow traders to tailor the display to their preferences and trading style.
Integration: This feature enhances user engagement and usability, making it easier for traders to interpret the data and make informed decisions. Personalization options like colors, styles, and display formats improve the overall effectiveness of the indicator.
How Components Work Together
Comprehensive Market Analysis
Each component of the indicator addresses a different aspect of market analysis. Order blocks and liquidity levels highlight potential support and resistance zones, while fair value gaps and trendlines provide additional context for potential entries and exits. Market structure analysis ties everything together by offering a broad view of market dynamics.
Synergistic Insights
The integration of multiple features allows for cross-validation of trading signals. For instance, an order block coinciding with a high-probability liquidity level and a fair value gap can provide a stronger signal than any of these features alone. This synergy enhances the reliability of the insights and trading signals generated by the indicator.
Enhanced Decision Making
By combining these advanced features into a single tool, traders are equipped with a powerful resource for making informed decisions. The customizable alerts and interactive visualization further support this by ensuring that traders can act quickly on the insights provided.
Order Blocks ( OB) & Breaker Blocks (BB) Visuals:
📝 OB Input Settings
📊 Timeframe #1
TF #1🕑: Enable or disable Timeframe 1.
What it is: A boolean input to toggle the use of the first timeframe.
What it does: Enables or disables Timeframe 1 for the OB settings.
How to use it: Check or uncheck the box to enable or disable.
📊 Timeframe 1 Selection
Timeframe #1🕑: Select the timeframe for Timeframe 1.
What it is: A dropdown to select the desired timeframe.
What it does: Sets the timeframe for Timeframe 1.
How to use it: Choose a timeframe from the dropdown list.
📊 Timeframe #2
TF #2🕑: Enable or disable Timeframe 2.
What it is: A boolean input to toggle the use of the second timeframe.
What it does: Enables or disables Timeframe 2 for the OB settings.
How to use it: Check or uncheck the box to enable or disable.
📊 Timeframe 2 Selection
Timeframe #2🕑: Select the timeframe for Timeframe 2.
What it is: A dropdown to select the desired timeframe.
What it does: Sets the timeframe for Timeframe 2.
How to use it: Choose a timeframe from the dropdown list.
Additional Info: Higher TF Chart & Lower TF Setting / Lower TF Chart & Higher TF Setting.
📏 Show OBs
OB (Length)📏: Toggle the display of Order Blocks.
What it is: A boolean input to enable or disable the display of Order Blocks.
What it does: Shows or hides Order Blocks based on the selected swing length.
How to use it: Check or uncheck the box to enable or disable.
📏 Swing Length Option
Swing Length Option: Select the swing length option.
What it is: A dropdown to choose between SHORT, MID, LONG, or CUSTOM.
What it does: Sets the length of swings for Order Blocks.
How to use it: Choose an option from the dropdown.
Additional Info: Default lengths are SHORT=10, MID=28, LONG=50.
🔧 Custom Swing Length
🔧custom: Specify a custom swing length.
What it is: An integer input for setting a custom swing length.
What it does: Overrides the default swing lengths if set to CUSTOM.
How to use it: Enter a custom integer value (only shown when CUSTOM is selected).
📛 Show BBs
BB (Method)📛: Toggle the display of Breaker Blocks.
What it is: A boolean input to enable or disable the display of Breaker Blocks.
What it does: Shows or hides Breaker Blocks.
How to use it: Check or uncheck the box to enable or disable.
📛 OB End Method
OB End Method: Select the method for determining the end of a Breaker Block.
What it is: A dropdown to choose between Wick and Close.
What it does: Sets the criteria for when a Breaker Block is considered mitigated.
How to use it: Choose an option from the dropdown.
Additional Info: Wicks: OB is mitigated when the price wicks through the OB Level. Close: OB is mitigated when the closing price is within the OB Level.
🔍 Max Bullish Zones
🔍Max Bullish: Set the maximum number of Bullish Order Blocks to display.
What it is: A dropdown to select the maximum number of Bullish Order Blocks.
What it does: Limits the number of Bullish Order Blocks shown on the chart.
How to use it: Choose a value from the dropdown (1-10).
🔍 Max Bearish Zones
🔍Max Bearish: Set the maximum number of Bearish Order Blocks to display.
What it is: A dropdown to select the maximum number of Bearish Order Blocks.
What it does: Limits the number of Bearish Order Blocks shown on the chart.
How to use it: Choose a value from the dropdown (1-10).
🟩 Bullish OB Color
Bullish OB Color: Set the color for Bullish Order Blocks.
What it is: A color picker to set the color of Bullish Order Blocks.
What it does: Changes the color of Bullish Order Blocks on the chart.
How to use it: Select a color from the color picker.
🟥 Bearish OB Color
Bearish OB Color: Set the color for Bearish Order Blocks.
What it is: A color picker to set the color of Bearish Order Blocks.
What it does: Changes the color of Bearish Order Blocks on the chart.
How to use it: Select a color from the color picker.
🔧 OB & BB Range
↔ OB & BB Range: Select the range option for OB and BB.
What it is: A dropdown to choose between RANGE and CUSTOM.
What it does: Sets how far the OB or BB should extend.
How to use it: Choose an option from the dropdown.
Additional Info: RANGE = Current price, CUSTOM = Adjustable Range.
🔧 Custom OB & BB Range
🔧Custom: Specify a custom range for OB and BB.
What it is: An integer input for setting a custom range.
What it does: Defines how far the OB or BB should go, based on a custom value.
How to use it: Enter a custom integer value (range: 1000-500000).
💬 Text Options
💬Text Options: Set text size and color for OB and BB.
What it is: A dropdown to select text size and a color picker to choose text color.
What it does: Changes the size and color of the text displayed for OB and BB.
How to use it: Select a size from the dropdown and a color from the color picker.
💬 Show Timeframe OB
Text: Toggle to display the timeframe of OB.
What it is: A boolean input to show or hide the timeframe text for OB.
What it does: Displays the timeframe information for Order Blocks on the chart.
How to use it: Check or uncheck the box to enable or disable.
💬 Show Volume
Volume: Toggle to display the volume of OB.
What it is: A boolean input to show or hide the volume information for Order Blocks.
What it does: Displays the volume information for Order Blocks on the chart.
How to use it: Check or uncheck the box to enable or disable.
Additional Info:
What it represents: The volume displayed represents the total trading volume that occurred during the formation of the Order Block. This can indicate the level of participation or interest in that price level.
How it's calculated: The volume is the sum of all traded volumes within the candles that form the Order Block.
What it means: Higher volume at an Order Block level may suggest stronger support or resistance. It shows the amount of trading activity and can be an indicator of the potential strength or validity of the Order Block.
Why it's shown: To give traders an idea of the market participation and to help assess the strength of the Order Block.
💬 Show Percentage
%: Toggle to display the percentage of OB.
What it is: A boolean input to show or hide the percentage information for Order Blocks.
What it does: Displays the percentage information for Order Blocks on the chart.
How to use it: Check or uncheck the box to enable or disable.
Additional Info:
What it represents: The percentage displayed usually represents the proportion of price movement relative to the Order Block.
How it's calculated: This can be the percentage move from the start to the end of the Order Block or the retracement level that price has reached relative to the Order Block's range.
What it means: It helps traders understand the extent of price movement within the Order Block and can indicate the significance of the price level.
Why it's shown: To provide a clearer understanding of the price dynamics and the importance of the Order Block within the overall price movement.
Additional Information
Volume Example: If an Order Block forms over three candles with volumes of 100, 150, and 200, the total volume displayed for that Order Block would be 450.
Percentage Example: If the price moves from 100 to 110 within an Order Block, and the total range of the Order Block is from 100 to 120, the percentage shown might be 50% (since the price has moved halfway through the Order Block's range).
Liquidity Levels visuals:
📊 Liquidity Levels Input Settings
📊 Current Timeframe
TF #1🕑: Enable or disable the current timeframe.
What it is: A boolean input to toggle the use of the current timeframe.
What it does: Enables or disables the display of liquidity levels for the current timeframe.
How to use it: Check or uncheck the box to enable or disable.
📊 Higher Timeframe
Higher Timeframe: Select the higher timeframe for liquidity levels.
What it is: A dropdown to select the desired higher timeframe.
What it does: Sets the higher timeframe for liquidity levels.
How to use it: Choose a timeframe from the dropdown list.
📏 Liquidity Length Option
📏Liquidity Length: Select the length for liquidity levels.
What it is: A dropdown to choose between SHORT, MID, LONG, or CUSTOM.
What it does: Sets the length of swings for liquidity levels.
How to use it: Choose an option from the dropdown.
Additional Info: Default lengths are SHORT=10, MID=28, LONG=50.
🔧 Custom Liquidity Length
🔧custom: Specify a custom length for liquidity levels.
What it is: An integer input for setting a custom swing length.
What it does: Overrides the default liquidity lengths if set to CUSTOM.
How to use it: Enter a custom integer value (only shown when CUSTOM is selected).
📛 Mitigation Method
📛Mitigation (Method): Select the method for determining the mitigation of liquidity levels.
What it is: A dropdown to choose between Close and Wick.
What it does: Sets the criteria for when a liquidity level is considered mitigated.
How to use it: Choose an option from the dropdown.
Additional Info:
Wick: Level is mitigated when the price wicks through the level.
Close: Level is mitigated when the closing price is within the level.
📛 Display Mitigated Levels
-: Select to display or hide mitigated levels.
What it is: A dropdown to choose between Remove and Show.
What it does: Displays or hides mitigated liquidity levels.
How to use it: Choose an option from the dropdown.
Additional Info:
Remove: Hide mitigated levels.
Show: Display mitigated levels.
🔍 Max Buy Side Liquidity
🔍Max Buy Side Liquidity: Set the maximum number of Buy Side Liquidity Levels to display.
What it is: An integer input to set the maximum number of Buy Side Liquidity Levels.
What it does: Limits the number of Buy Side Liquidity Levels shown on the chart.
How to use it: Enter a value between 0 and 50.
🟦 Buy Side Liquidity Color
Buy Side Liquidity Color: Set the color for Buy Side Liquidity Levels.
What it is: A color picker to set the color of Buy Side Liquidity Levels.
What it does: Changes the color of Buy Side Liquidity Levels on the chart.
How to use it: Select a color from the color picker.
Additional Info:
Tooltip: Set the maximum number of Buy Side Liquidity Levels to display. Default: 5, Min: 1, Max: 50.
If liquidity levels are not displayed as expected, try increasing the max count.
🔍 Max Sell Side Liquidity
🔍Max Sell Side Liquidity: Set the maximum number of Sell Side Liquidity Levels to display.
What it is: An integer input to set the maximum number of Sell Side Liquidity Levels.
What it does: Limits the number of Sell Side Liquidity Levels shown on the chart.
How to use it: Enter a value between 0 and 50.
🟥 Sell Side Liquidity Color
Sell Side Liquidity Color: Set the color for Sell Side Liquidity Levels.
What it is: A color picker to set the color of Sell Side Liquidity Levels.
What it does: Changes the color of Sell Side Liquidity Levels on the chart.
How to use it: Select a color from the color picker.
Additional Info:
Tooltip: Set the maximum number of Sell Side Liquidity Levels to display. Default: 5, Min: 1, Max: 50.
If liquidity levels are not displayed as expected, try increasing the max count.
✂ Box Style (Height)
✂ Box Style (↕): Set the box height style for liquidity levels.
What it is: A float input to set the height of the boxes.
What it does: Adjusts the height of the boxes displaying liquidity levels.
How to use it: Enter a value between -50 and 50.
Additional Info: Default value is -5.
📏 Box Length
b: Set the box length of liquidity levels.
What it is: An integer input to set the length of the boxes.
What it does: Adjusts the length of the boxes displaying liquidity levels.
How to use it: Enter a value between 0 and 500.
Additional Info: Default value is 20.
⏭ Extend Liquidity Levels
Extend ⏭: Toggle to extend liquidity levels beyond the current range.
What it is: A boolean input to enable or disable the extension of liquidity levels.
What it does: Extends liquidity levels beyond their default range.
How to use it: Check or uncheck the box to enable or disable.
Additional Info: Extend liquidity levels beyond the current range.
💬 Text Options
💬 Text Options: Set text size and color for liquidity levels.
What it is: A dropdown to select text size and a color picker to choose text color.
What it does: Changes the size and color of the text displayed for liquidity levels.
How to use it: Select a size from the dropdown and a color from the color picker.
💬 Show Text
Text: Toggle to display text for liquidity levels.
What it is: A boolean input to show or hide the text for liquidity levels.
What it does: Displays the text information for liquidity levels on the chart.
How to use it: Check or uncheck the box to enable or disable.
💬 Show Volume
Volume: Toggle to display the volume of liquidity levels.
What it is: A boolean input to show or hide the volume information for liquidity levels.
What it does: Displays the volume information for liquidity levels on the chart.
How to use it: Check or uncheck the box to enable or disable.
Additional Info:
What it represents: The volume displayed represents the total trading volume that occurred during the formation of the liquidity level. This can indicate the level of participation or interest in that price level.
How it's calculated: The volume is the sum of all traded volumes within the candles that form the liquidity level.
What it means: Higher volume at a liquidity level may suggest stronger support or resistance. It shows the amount of trading activity and can be an indicator of the potential strength or validity of the liquidity level.
Why it's shown: To give traders an idea of the market participation and to help assess the strength of the liquidity level.
💬 Show Percentage
%: Toggle to display the percentage of liquidity levels.
What it is: A boolean input to show or hide the percentage information for liquidity levels.
What it does: Displays the percentage information for liquidity levels on the chart.
How to use it: Check or uncheck the box to enable or disable.
Additional Info:
What it represents: The percentage displayed usually represents the proportion of price movement relative to the liquidity level.
How it's calculated: This can be the percentage move from the start to the end of the liquidity level or the retracement level that price has reached relative to the liquidity level's range.
What it means: It helps traders understand the extent of price movement within the liquidity level and can indicate the significance of the price level.
Why it's shown: To provide a clearer understanding of the price dynamics and the importance of the liquidity level within the overall price movement.
Fair Value Gaps visuals:
📊 Fair Value Gaps Input Settings
📊 Show FVG
TF #1🕑: Enable or disable Fair Value Gaps for Timeframe 1.
What it is: A boolean input to toggle the display of Fair Value Gaps.
What it does: Shows or hides Fair Value Gaps on the chart.
How to use it: Check or uncheck the box to enable or disable.
📊 Select Timeframe
Timeframe: Select the timeframe for Fair Value Gaps.
What it is: A dropdown to select the desired timeframe.
What it does: Sets the timeframe for Fair Value Gaps.
How to use it: Choose a timeframe from the dropdown list.
Additional Info: Higher TF Chart & Lower TF Setting or Lower TF Chart & Higher TF Setting.
📛 FVG Break Method
📛FVG Break (Method): Select the method for determining when an FVG is mitigated.
What it is: A dropdown to choose between Touch, Wicks, Close, or Average.
What it does: Sets the criteria for when a Fair Value Gap is considered mitigated.
How to use it: Choose an option from the dropdown.
Additional Info:
Touch: FVG is mitigated when the price touches the gap.
Wicks: FVG is mitigated when the price wicks through the gap.
Close: FVG is mitigated when the closing price is within the gap.
Average: FVG is mitigated when the average price (average of high and low) is within the gap.
📛 Show Mitigated FVG
show: Toggle to display mitigated FVGs.
What it is: A boolean input to show or hide mitigated Fair Value Gaps.
What it does: Displays or hides mitigated Fair Value Gaps.
How to use it: Check or uncheck the box to enable or disable.
📛 Fill FVG
Fill: Toggle to fill Fair Value Gaps.
What it is: A boolean input to fill the Fair Value Gaps with color.
What it does: Adds a color fill to the Fair Value Gaps.
How to use it: Check or uncheck the box to enable or disable.
📛 Shade FVG
Shade: Toggle to shade Fair Value Gaps.
What it is: A boolean input to shade the Fair Value Gaps.
What it does: Adds a shade effect to the Fair Value Gaps.
How to use it: Check or uncheck the box to enable or disable.
Additional Info: Select the method to break FVGs and toggle the visibility of FVG Breaks (fill FVG and/or shade FVG).
🔍 Max Bullish FVG
🔍Max Bullish FVG: Set the maximum number of Bullish Fair Value Gaps to display.
What it is: An integer input to set the maximum number of Bullish Fair Value Gaps.
What it does: Limits the number of Bullish Fair Value Gaps shown on the chart.
How to use it: Enter a value between 0 and 50.
🔍 Max Bearish FVG
🔍Max Bearish FVG: Set the maximum number of Bearish Fair Value Gaps to display.
What it is: An integer input to set the maximum number of Bearish Fair Value Gaps.
What it does: Limits the number of Bearish Fair Value Gaps shown on the chart.
How to use it: Enter a value between 0 and 50.
🟥 Bearish FVG Color
Bearish FVG Color: Set the color for Bearish Fair Value Gaps.
What it is: A color picker to set the color of Bearish Fair Value Gaps.
What it does: Changes the color of Bearish Fair Value Gaps on the chart.
How to use it: Select a color from the color picker.
Additional Info:
Tooltip: Set the maximum number of Bearish Fair Value Gaps to display. Default: 5, Min: 1, Max: 50.
If Fair Value Gaps are not displayed as expected, try increasing the max count.
🟦 Bullish FVG Color
Bullish FVG Color: Set the color for Bullish Fair Value Gaps.
What it is: A color picker to set the color of Bullish Fair Value Gaps.
What it does: Changes the color of Bullish Fair Value Gaps on the chart.
How to use it: Select a color from the color picker.
Additional Info:
Tooltip: Set the maximum number of Bullish Fair Value Gaps to display. Default: 5, Min: 1, Max: 50.
If Fair Value Gaps are not displayed as expected, try increasing the max count.
📏 FVG Range
↔ FVG Range: Set the range for Fair Value Gaps.
What it is: An integer input to set the range of the Fair Value Gaps.
What it does: Adjusts the range of the Fair Value Gaps displayed.
How to use it: Enter a value between 0 and 100.
Additional Info: Adjustable length only works when both RANGE & EXTEND display OFF. Range=current price, Extend=Full Range.
⏭ Extend FVG
Extend⏭: Toggle to extend Fair Value Gaps beyond the current range.
What it is: A boolean input to enable or disable the extension of Fair Value Gaps.
What it does: Extends Fair Value Gaps beyond their default range.
How to use it: Check or uncheck the box to enable or disable.
⏯ FVG Range
Range⏯: Toggle the range of Fair Value Gaps.
What it is: A boolean input to enable or disable the range display for Fair Value Gaps.
What it does: Sets the range of Fair Value Gaps displayed.
How to use it: Check or uncheck the box to enable or disable.
↕ Max Width
↕ Max Width: Set the maximum width of Fair Value Gaps.
What it is: A float input to set the maximum width of Fair Value Gaps.
What it does: Limits the width of Fair Value Gaps as a percentage of the price range.
How to use it: Enter a value between 0 and 5.0.
Additional Info: FVGs wider than this value will be ignored.
♻ Filter FVG
Filter FVG ♻: Toggle to filter out small Fair Value Gaps.
What it is: A boolean input to filter out small Fair Value Gaps.
What it does: Ignores Fair Value Gaps smaller than the specified max width.
How to use it: Check or uncheck the box to enable or disable.
➖ Mid Line Style
➖Mid Line Style: Select the style of the mid line for Fair Value Gaps.
What it is: A dropdown to choose between Solid, Dashed, or Dotted.
What it does: Sets the style of the mid line within Fair Value Gaps.
How to use it: Choose an option from the dropdown.
🎨 Mid Line Color
Mid Line Color: Set the color for the mid line within Fair Value Gaps.
What it is: A color picker to set the color of the mid line.
What it does: Changes the color of the mid line within Fair Value Gaps.
How to use it: Select a color from the color picker.
Additional Information
Mitigation Methods: Each method (Touch, Wicks, Close, Average) provides different criteria for when a Fair Value Gap is considered mitigated, helping traders to understand the dynamics of price movements within gaps.
Volume and Percentage: Displaying volume and percentage information for Fair Value Gaps helps traders gauge the strength and significance of these gaps in relation to trading activity and price movements.
Trendlines visuals:
📊 Trendlines Input Settings
📊 Show Trendlines
Trendlines & Trendlines Difference(%) ↕: Enable or disable trendlines and set the percentage difference from the first trendline.
What it is: A boolean input to toggle the display of trendlines.
What it does: Shows or hides trendlines on the chart and allows setting a percentage difference from the first trendline.
How to use it: Check or uncheck the box to enable or disable.
Additional Info: The percentage difference determines the distance of the second trendline from the first one.
📏 Trendline Length Option
📏Trendline Length: Select the length for trendlines.
What it is: A dropdown to choose between SHORT, MID, LONG, or CUSTOM.
What it does: Sets the length of trendlines.
How to use it: Choose an option from the dropdown.
Additional Info: Default lengths are SHORT=50, MID=100, LONG=200.
🔧 Custom Trendline Length
🔧custom: Specify a custom length for trendlines.
What it is: An integer input for setting a custom trendline length.
What it does: Overrides the default trendline lengths if set to CUSTOM.
How to use it: Enter a custom integer value (only shown when CUSTOM is selected).
🔍 Max Bearish Trendlines
🔍Max Trendlines Bearish: Set the maximum number of bearish trendlines to display.
What it is: A dropdown to select the maximum number of bearish trendlines.
What it does: Limits the number of bearish trendlines shown on the chart.
How to use it: Choose a value from the dropdown (2-20).
🟩 Bearish Trendline Color
Bearish Trendline Color: Set the color for bearish trendlines.
What it is: A color picker to set the color of bearish trendlines.
What it does: Changes the color of bearish trendlines on the chart.
How to use it: Select a color from the color picker.
Additional Info: Adjust to control how many bearish trendlines are displayed.
🔍 Max Bullish Trendlines
🔍Max Trendlines Bullish: Set the maximum number of bullish trendlines to display.
What it is: A dropdown to select the maximum number of bullish trendlines.
What it does: Limits the number of bullish trendlines shown on the chart.
How to use it: Choose a value from the dropdown (2-20).
🟥 Bullish Trendline Color
Bullish Trendline Color: Set the color for bullish trendlines.
What it is: A color picker to set the color of bullish trendlines.
What it does: Changes the color of bullish trendlines on the chart.
How to use it: Select a color from the color picker.
Additional Info: Adjust to control how many bullish trendlines are displayed.
📐 Degrees Text
📐Degrees ° (💬 Size): Enable or disable degrees text and set its size and color.
What it is: A boolean input to show or hide the degrees text for trendlines.
What it does: Displays the degrees text for trendlines.
How to use it: Check or uncheck the box to enable or disable.
📏 Text Size for Degrees
Text Size: Set the text size for degrees on trendlines.
What it is: A dropdown to select the size of the degrees text.
What it does: Changes the size of the degrees text displayed for trendlines.
How to use it: Choose a size from the dropdown (XS, S, M, L, XL).
🎨 Degrees Text Color
Degrees Text Color: Set the color for the degrees text on trendlines.
What it is: A color picker to set the color of the degrees text.
What it does: Changes the color of the degrees text on the chart.
How to use it: Select a color from the color picker.
♻ Filter Degrees
♻ Filter Degrees °: Enable or disable angle filtering and set the angle range.
What it is: A boolean input to filter trendlines by their angle.
What it does: Shows only trendlines within a specified angle range.
How to use it: Check or uncheck the box to enable or disable.
Additional Info: Angles outside this range will be filtered out.
🔢 Angle Range
Angle Range: Set the angle range for filtering trendlines.
What it is: Two float inputs to set the minimum and maximum angle for trendlines.
What it does: Defines the range of angles for which trendlines will be shown.
How to use it: Enter values for the minimum and maximum angles.
➖ Line Style
➖Style #1 & #2: Select the style of the primary and secondary trendlines.
What it is: Two dropdowns to choose between Solid, Dashed, or Dotted for the trendlines.
What it does: Sets the style of the primary and secondary trendlines.
How to use it: Choose a style from each dropdown.
📏 Line Thickness
: Set the thickness for the trendlines.
What it is: An integer input to set the thickness of the trendlines.
What it does: Adjusts the thickness of the trendlines displayed on the chart.
How to use it: Enter a value between 1 and 5.
Additional Information
Trendline Percentage Difference: Setting a percentage difference helps in analyzing the relative position and angle of trendlines.
Filtering by Angle: This feature allows focusing on trendlines within a specific angle range, enhancing the clarity of trend analysis.
BOS & CHOCH Market Structure visuals:
📊 BOS & CHOCH Market Structure Input Settings
📏 Market Structure Length Option
📏Market Structure: Select the market structure length option.
What it is: A dropdown to choose between INTERNAL, EXTERNAL, ALL, CUSTOM, or NONE.
What it does: Sets the type of market structure to be displayed.
How to use it: Choose an option from the dropdown.
Additional Info:
INTERNAL: Only internal structure.
EXTERNAL: Only external structure.
ALL: Both internal and external structures.
CUSTOM: Custom lengths.
NONE: No structure.
🔧 Custom Internal Length
🔧Custom Internal: Specify a custom length for internal market structure.
What it is: An integer input for setting a custom internal length.
What it does: Defines the length of internal market structures if CUSTOM is selected.
How to use it: Enter a custom integer value (only shown when CUSTOM is selected).
💬 Internal Label Size
💬Internal Label Size: Set the label size for internal market structures.
What it is: A dropdown to select the size of the labels.
What it does: Changes the size of the labels for internal market structures.
How to use it: Choose a size from the dropdown (XS, S, M, L, XL).
🟩 Internal Bullish Color
Internal Bullish Color: Set the color for bullish internal market structures.
What it is: A color picker to set the color of bullish internal market structures.
What it does: Changes the color of bullish internal market structures on the chart.
How to use it: Select a color from the color picker.
🟥 Internal Bearish Color
Internal Bearish Color: Set the color for bearish internal market structures.
What it is: A color picker to set the color of bearish internal market structures.
What it does: Changes the color of bearish internal market structures on the chart.
How to use it: Select a color from the color picker.
🔧 Custom External Length
🔧Custom External: Specify a custom length for external market structure.
What it is: An integer input for setting a custom external length.
What it does: Defines the length of external market structures if CUSTOM is selected.
How to use it: Enter a custom integer value (only shown when CUSTOM is selected).
💬 External Label Size
💬External Label Size: Set the label size for external market structures.
What it is: A dropdown to select the size of the labels.
What it does: Changes the size of the labels for external market structures.
How to use it: Choose a size from the dropdown (XS, S, M, L, XL).
🟩 External Bullish Color
External Bullish Color: Set the color for bullish external market structures.
What it is: A color picker to set the color of bullish external market structures.
What it does: Changes the color of bullish external market structures on the chart.
How to use it: Select a color from the color picker.
🟥 External Bearish Color
External Bearish Color: Set the color for bearish external market structures.
What it is: A color picker to set the color of bearish external market structures.
What it does: Changes the color of bearish external market structures on the chart.
How to use it: Select a color from the color picker.
📐 Show Equal Highs and Lows
EQL & EQH📐: Toggle visibility for equal highs and lows.
What it is: A boolean input to show or hide equal highs and lows.
What it does: Displays or hides equal highs and lows on the chart.
How to use it: Check or uncheck the box to enable or disable.
📏 Equal Highs and Lows Threshold
Equal Highs and Lows Threshold: Set the threshold for equal highs and lows.
What it is: A float input to set the threshold for equal highs and lows.
What it does: Defines the range within which highs and lows are considered equal.
How to use it: Enter a value between 0 and 10.
💬 Label Size for Equal Highs and Lows
💬Label Size for Equal Highs and Lows: Set the label size for equal highs and lows.
What it is: A dropdown to select the size of the labels.
What it does: Changes the size of the labels for equal highs and lows.
How to use it: Choose a size from the dropdown (XS, S, M, L, XL).
🟩 Bullish Color for Equal Highs and Lows
Bullish Color for Equal Highs and Lows: Set the color for bullish equal highs and lows.
What it is: A color picker to set the color of bullish equal highs and lows.
What it does: Changes the color of bullish equal highs and lows on the chart.
How to use it: Select a color from the color picker.
🟥 Bearish Color for Equal Highs and Lows
Bearish Color for Equal Highs and Lows: Set the color for bearish equal highs and lows.
What it is: A color picker to set the color of bearish equal highs and lows.
What it does: Changes the color of bearish equal highs and lows on the chart.
How to use it: Select a color from the color picker.
📏 Show Swing Points
Swing Points📏: Toggle visibility for swing points.
What it is: A boolean input to show or hide swing points.
What it does: Displays or hides swing points on the chart.
How to use it: Check or uncheck the box to enable or disable.
📏 Swing Points Length Option
Swing Points Length Option: Select the length for swing points.
What it is: A dropdown to choose between SHORT, MID, LONG, or CUSTOM.
What it does: Sets the length of swing points.
How to use it: Choose an option from the dropdown.
Additional Info: Default lengths are SHORT=10, MID=28, LONG=50.
💬 Swing Points Label Size
💬Swing Points Label Size: Set the label size for swing points.
What it is: A dropdown to select the size of the labels.
What it does: Changes the size of the labels for swing points.
How to use it: Choose a size from the dropdown (XS, S, M, L, XL).
🎨 Swing Points Color
Swing Points Color: Set the color for swing points.
What it is: A color picker to set the color of swing points.
What it does: Changes the color of swing points on the chart.
How to use it: Select a color from the color picker.
🔧 Custom Swing Points Length
🔧Custom Swings: Specify a custom length for swing points.
What it is: An integer input for setting a custom length for swing points.
What it does: Defines the length of swing points if CUSTOM is selected.
How to use it: Enter a custom integer value (only shown when CUSTOM is selected).
Additional Information
Market Structure Types: Understanding internal and external structures helps in analyzing different market behaviors.
Equal Highs and Lows: This feature identifies areas where price action is balanced, which can be significant for trading strategies.
Swing Points: Highlighting swing points aids in recognizing significant market reversals or continuations.
Benefits
Enhance your trading strategy by visualizing smart money's influence on price movements.
Make informed decisions with real-time data on significant market structures.
Reduce manual analysis with automated detection of key trading signals.
Ideal For
Traders looking for an edge in forex, equities, and cryptocurrency markets by understanding the underlying forces driving market dynamics.
Acknowledgements
Special thanks to these amazing creators for inspiration and their creations:
I want to thank these amazing creators for creating there amazing indicators , that inspired me and also gave me a head start by making this indicator! Without their amazing indicators it wouldn't be possible!
Flux Charts: Volumized Order Blocks
LuxAlgo: Trend Lines
UAlgo: Fair Value Gaps (FVG)
By Leviathan: Market Structure
Sonarlab: Liquidity Levels
Note
Remember to always backtest the indicator first before integrating it into your strategy! For any questions about the indicator, please feel free to ask for assistance.

Engulfing with Fibonacci LevelsIndicator Explanation
The indicator identifies bullish and bearish engulfing patterns and plots Fibonacci levels based on these patterns. Here's a detailed explanation of the script:
1. Bullish Engulfing Pattern
A bullish engulfing pattern is identified when:
- The previous candle is bearish (`close < open `).
- The current candle is bullish (`close > open`).
- The low of the current candle is lower than the low of the previous candle (`low < low `).
- The current candle's close is higher than the previous candle's open (`close > open `).
When a bullish engulfing pattern is identified:
- Fibonacci levels are plotted from the low (0%) to the high (100%) of the bullish candle.
- A green dot is plotted below the bullish candle to indicate a buy signal.
2. Bearish Engulfing Pattern
A bearish engulfing pattern is identified when:
- The previous candle is bullish (`close > open `).
- The current candle is bearish (`close < open`).
- The high of the current candle is higher than the high of the previous candle (`high > high `).
- The current candle's close is lower than the previous candle's open (`close < open `).
When a bearish engulfing pattern is identified:
- Fibonacci levels are plotted from the high (0%) to the low (100%) of the bearish candle.
- A red dot is plotted above the bearish candle to indicate a sell signal.
3. Plotting Fibonacci Levels
For both bullish and bearish patterns, Fibonacci levels are plotted at:
- 0% (high for bullish, low for bearish)
- 50%
- 61.8%
- 79%
- 100% (low for bullish, high for bearish)
Smart Money Concept (SMC) Explanation
Bearish Signal
In the context of Smart Money Concepts (SMC), a bearish engulfing pattern can indicate:
- **Buy Side Liquidity Grab**: The high of the current bearish candle goes above the high of the previous bullish candle, potentially grabbing buy-side liquidity (stop losses of short positions or buy stops).
- **Break of Structure (BoS)**: The close of the bearish candle below the open of the previous bullish candle indicates a shift in market structure.
After identifying this bearish engulfing pattern, a smart money trader might:
1. Wait for the market to retrace 50% of the bearish candle.
2. Enter a sell trade around the 50% retracement level, anticipating a continuation of the downward move.
#### Bullish Signal
Similarly, a bullish engulfing pattern can indicate:
- **Sell Side Liquidity Grab**: The low of the current bullish candle goes below the low of the previous bearish candle, potentially grabbing sell-side liquidity (stop losses of long positions or sell stops).
- **Break of Structure (BoS)**: The close of the bullish candle above the open of the previous bearish candle indicates a shift in market structure.
After identifying this bullish engulfing pattern, a smart money trader might:
1. Wait for the market to retrace 50% of the bullish candle.
2. Enter a buy trade around the 50% retracement level, anticipating a continuation of the upward move.
The indicator helps traders identify key engulfing patterns that align with smart money concepts of liquidity grabs and breaks of structure. By plotting Fibonacci levels, it visually aids traders in waiting for optimal retracement levels (50%) to enter trades in the direction of the anticipated move. This approach leverages the idea that significant market participants often seek liquidity and cause structural shifts, providing entry opportunities for informed traders.

Awakening CHECHLISTThe Awakening Checklist indicator is a tool designed to help traders evaluate certain key market conditions and elements before making trading decisions. It consists of a series of questions that the trader must answer using the options "Yes", "No" or "N/A" (not applicable).
“Has Asia Session ended?” : This question aims to determine if the Asian trading session has ended. The answer to this question can influence trading strategies depending on market conditions.
“Have you identified potential medium induction?” : This question concerns the identification of potential average inductions on the market. Recognizing these inductions can help traders anticipate future price movements.
"Have you identified potential PoI's": This question asks about the identification of potential points of interest on the market. These points of interest can indicate areas of significant support or resistance.
"Have you identified in which direction they are creating lQ?" : This question aims to determine in which direction market participants create liquidity (lQ). Understanding this dynamic can help make informed trade decisions.
“Have they induced Asia Range”: This question concerns the induction of the Asian range by market participants. Recognizing this induction can be important in assessing future price movements.
“Have you had a medium induction”: This question asks about the presence of a medium induction on the market. The answer to this question can influence trading prospects.
“Do you have a BoS away from the induction”: This question aims to find out if the trader has an offer (BoS) far from the identified induction. This can be a risk management strategy.
"Doas your induction PoI have imbalance": This question concerns the imbalance of points of interest (PoI) linked to induction. Recognizing this imbalance can help anticipate price movements.
“Do you have a valid target in mind”: This question aims to find out if the trader has a clear trading objective in mind. Having a goal can help guide trading decisions and manage risk.
Smart Money Setup 02 [TradingFinder] Mitigated Major OB Proof🔵 Introduction
"Smart money" is money invested by knowledgeable individuals at the right time, and this investment can yield the highest returns.
The concept we focus on in this indicator is whether the market is in an uptrend or downtrend. The market briefly takes a weak and reversal trend with "Minor BoS" without being able to break the major pivot.
In the next step, it returns to its main trend with a strong bullish move and continues its trend with a "Major BoS". The "order block" behind this rapid and powerful movement can be a valid order block for trading.
To better understand this setup, please refer to the explanations in the two images below.
Bullish Setup Details :
Bearish Setup Details :
🔵 How to Use
After adding the indicator to the chart, you should wait for trading opportunities to form. By changing the "Time Frame" and "Period Pivot", you can see different trading positions. In general, the lower the "Time Frame" and "Period Pivot", the higher the likelihood of forming trading opportunities.
Bullish Setup Details on Chart :
Bearish Setup Details on Chart :
You can access "Period Pivot" via settings as an input.

Liquidity Engulfing & Displacement [MsF]Japanese below / 日本語説明は英文の後にあります。
-------------------------
*This indicator is based on upslidedown's "Liquidity Engulfing Candles ". It's a very cool indicator. thank you.
It has 2 functions: show the Liquidity Engulfing on HTF and candle color change when displacement occurs.
=== Function description ===
1. Liquidity Engulfing on HTF
This indicator gives Liquidity Engulfing signals not only for the current candle, but also for H4 and H1 on HTF.
You can use that a bullish engulfing on H1 is a BOS on m5 and on H4 is a BOS on m15. It uses the theory of stop hunt from ICT.
Also, It's possible to fire alert.
2. Displacement
Change the color display of the candlesticks when a bullish candleStick or bearish candleStick is attached. Furthermore, by enabling the "Require FVG" option, you can easily discover the FVG (Fair Value Gap). It is a very useful function for ICT trading.
When H1 candle takes liquidity from one side and moves with an explosive move to the other side of the previous candle (displacement), it creates break of market structure on M5. Entry on discount FVG or OTE with stop loss at or below the stop hunt wick.
=== Parameter description ===
- Liquidity engulfing candles(LEC) SETTING
- Show H1 LEC … Whether to show LEC for H1
- Show H4 LEC … Whether to show LEC for H4
- Show Current LEC … Whether to show LEC for current timeframe
- Apply Stop Hunt Wick Filter … Require candle wick into prior candle retracement zone
- Apply Close Filter … Require LL/HH on candle in order to print a valid engulfing signal
- DISPLACEMENT SETTING
- Require FVG … Draw only when FVG occurs
- Displacement Type … Displacement from open to close? or from high to low?
- Displacement Length … Period over which to calculate the standard deviation
- Displacement Strength … The larger the number, the stronger the displacement detected
-------------------------
2つの機能があります: 上位足のLiquidity engulfing(流動性獲得)を表示することと、大きな変位が発生したときにローソク足の色を変更することです。
=== 機能説明 ===
1. 上位足のLiquidity engulfing
このインジケーターは、現在のローソク足だけでなく、上位足の H4 および H1 に対してもLiquidity engulfingシグナルを提供します。
H1はm5、H4はm15での使用を推奨します。これはICTのストップハント理論を活用しています。また、アラートを発することも可能です。
2. 変位(DISPLACEMENT)
大きな陽線、陰線を付けた場合に、そのローソク足をカラー表示を変更します。
さらに"Require FVG"オプションを有効にすることで、FVG(Fair Value Gap)を容易に発見することができます。ICTトレードにを行うにあたり大変有用な機能となっています。
=== パラメータの説明 ===
- Liquidity engulfing candles(LEC) SETTING
- Show H1 LEC … H1のLECを表示するかどうか
- Show H4 LEC … H4のLECを表示するかどうか
- Show Current LEC … 現在の期間の LEC を表示するかどうか
- Apply Stop Hunt Wick Filter … ハラミ足、もしくは包み足になっている場合のみに検知させる
- Apply Close Filter … 1つ前のローソクよりも終値で超えていた場合のみに検知させる
- DISPLACEMENT SETTING
- Require FVG … FVG発生時のみ描画する
- Displacement Type … openからcloseまでの変位か?highからlowまでの変位か?
- Displacement Length … 標準偏差を計算する期間
- Displacement Strength … 変位の強さ(数字が大きいほど強い変位を検出)

ICT HTF Liquidity Levels /w Alert [MsF]Japanese below / 日本語説明は英文の後にあります。
-------------------------
*This indicator is based on sbtnc's "HTF Liquidity Levels". It's a very cool indicator. thank you.
It has 3 functions: visualization of HTF liquidity (with alert), candle color change when displacement occurs, and MSB (market structure break) line display.
=== Function description ===
1. HTF liquidity (with alert)
Lines visualize the liquidity pools on the HTF bars. Alerts can be set for each TF's line.
Once the price reaches the line, the line is repaint.
To put it plainly, the old line disappears and a new line appears. The line that disappeared remains as a purged line. (It is also possible to hide the purged line with a parameter)
The alert will be triggered at the moment the line disappears. An alert will be issued when you touch the HTF's liquid pools where the loss is accumulated, so you can notice the stop hunting with the alert.
This alert is an original feature of this indicator.
The timeframe of the HTF can't modify. You can get Monthly, weekly, daily and H1 and H4.
Each timeframe displays the 3 most recent lines. By narrowing it down to 3, it is devised to make it easier to see visually. (This indicator original)
2. Displacement
Change the color display of the candlesticks when a bullish candle stick or bearish candle stick is attached. Furthermore, by enabling the "Require FVG" option, you can easily discover the FVG (Fair Value Gap). It is a very useful function for ICT trading.
3. MSB (market structure break)
Displays High/Low lines for the period specified by the parameter. It is useful for discovering BoS & CHoCH/MSS, which are important in ICT trading.
=== Parameter description ===
- HTF LIQUIDITY
- Daily … Daily line display settings (color, line width)
- Weekly … Weekly line display settings (color, line width)
- Monthly … Monthly line display settings (color, line width)
- INTRADAY LIQUIDITY
- 1H … 1H line display settings (color, line width)
- 4H … 4H line display settings (color, line width)
- PURGED LIQUIDITY … Display setting of the line once the candle reaches
- Show Purge Daily … Daily purged line display/non-display setting
- Show Purge Weekly … Weekly purged line display/non-display setting
- Show Purge Monthly … Monthly purged line display/non-display setting
- Show Purge 1H … 1H purged line display/non-display setting
- Show Purge 4H … 4H purged line display/non-display setting
- MARKET STRUCTURE BREAK - MBS
- Loopback … Period for searching High/Low
- DISPLACEMENT FOR FVG
- Require FVG … Draw only when FVG occurs
- Displacement Type … Displacement from open to close? or from high to low?
- Displacement Length … Period over which to calculate the standard deviation
- Displacement Strength … The larger the number, the stronger the displacement detected
-------------------------
このインジケータはsbtncさんの"HTF Liquidity Levels"をベースに作成しています。
上位足流動性の可視化(アラート付き)、変位発生時のローソク色変更、MSB(market structure break)ライン表示の3つの機能を有します。
<機能説明>
■上位足流動性の可視化
上位足の流動性の吹き溜まり(ストップが溜まっているところ)をラインで可視化します。ラインにはアラートを設定することが可能です。
一度価格がラインに到達するとそのラインは再描画されます。
平たく言うと、今までのラインが消えて新しいラインが出現する。という事です。
消えたラインはpurgeラインとして残ります。(パラメータでpurgeラインを非表示にすることも可能です)
アラートはラインが消える瞬間に発報します。上位足の損切り溜まってるところにタッチするとアラートを発報するので、アラートにてストップ狩りに気づくことができます。
このアラート発報については本インジケータオリジナルの機能となります。
表示可能な上位足のタイムフレームは固定です。月足、週足、日足およびH1とH4を表示することができます。
各タイムフレーム、直近から3つのラインを表示します。3つに絞ることで視覚的に見やすく工夫しています。(本インジケータオリジナル)
■変位発生時のローソク色変更
大きな陽線、陰線を付けた場合に、そのローソク足をカラー表示を変更します。
さらに"Require FVG"オプションを有効にすることで、FVG(Fair Value Gap)を容易に発見することができます。ICTトレードにを行うにあたり大変有用な機能となっています。
■MSB(market structure break)ライン表示
パラメータで指定した期間のHigh/Lowをライン表示します。ICTトレードで重要視しているBoS & CHoCH/MSSの発見に役立ちます。
<パラメータ説明>
- HTF LIQUIDITY
- Daily … 日足ライン表示設定(色、線幅)
- Weekly … 週足ライン表示設定(色、線幅)
- Monthly … 月足ライン表示設定(色、線幅)
- INTRADAY LIQUIDITY
- 1H … 1時間足ライン表示設定(色、線幅)
- 4H … 4時間足ライン表示設定(色、線幅)
- PURGED LIQUIDITY … 一度到達したラインの表示設定
- Show Purge Daily … 日足ライン表示/非表示設定
- Show Purge Weekly … 週足ライン表示/非表示設定
- Show Purge Monthly … 月足ライン表示/非表示設定
- Show Purge 1H … 1時間足ライン表示/非表示設定
- Show Purge 4H … 4時間足ライン表示/非表示設定
- MARKET STRUCTURE BREAK - MBS
- Loopback … High/Lowを探索する期間
- DISPLACEMENT FOR FVG
- Require FVG … FVG発生時のみ描画する
- Displacement Type … openからcloseまでの変位か?highからlowまでの変位か?
- Displacement Length … 標準偏差を計算する期間
- Displacement Strength … 変位の強さ(数字が大きいほど強い変位を検出)

Strategy: Range BreakoutWhat?
In the price action, levels have a significant role to play. Based on the price moving above/below the levels - the underlying instrument shows some price-action in the direction of breakout/breakdown.
There are plenty of ways level can be determined. Levels are the decision point to take a trade or not. But if we make the level derivation complex, then the execution may get hamper.
This strategy script, developed in PineScript v5, is our attempt at solving this problem at the core by providing this simple, yet elegant solution to this problem.
It's essentially an attempt to Trade Simple by drawing logical (horizontal) lines in the chart and take actions, after multiple associated parameters confirmation, on the breakout / breakdown of the levels.
How?
Let us explain how we are drawing the levels.
We are depending on some of the parameters as described below:
Open Range : During intraday movement, often if prices move beyond a particular level, it exibits more movement in the same swing in same direction. We found out, through our back testing for Indian Indices like NSE:NIFTY , NSE:BANKNIFTY or NSE:CNXFINANCE the first 15m (i.e 09:15 AM to 09:30 AM, IST) is one of such range. For Indian stocks, it is 9:15 to 9:45. And for MCX MCX:CRUDEOIL1! it's 5:00 pm to 6:00 pm. There are our first levels.
PDHCL : Previous Day High, Close, Low. This is our next level
VWAP : The rolling VWAP (volume weighted average price)
In the breakout/breakdown of the Open Range and Previous Day High/Low, we are taking the trade decisions as follows using CEST principle:
C onditions :
If current bar's (say you are in 5m timeframe) closing is broken out the Open Range High or Previous Day High, taken a Buy/Long decision (let's say buying a Call Option CE or selling a Put Option PE or buying the future or cash).
If current bar's (say you are in 5m timeframe) closing is broken down the Open Range Low or Previous Day Low, taken a Sell/Short decision (let's say buying a Put Option CE or selling a Call Option PE or selling the future or cash).
Additionally, and optionally (default ON, one can turn off): we are checking various other associated multiple confirmations as follows:
1. Momentum : Checking 14-period RSI value is more than 50 or less than 50 (all parameters like period, OB, OS ranges are configurable through settings)
2. Current bar's volume is more than the last 20 bars volume average. How much more - that multiplier is also configurable. (default is 1)
3. The breakout candle is bullish (green) or bearish (red).
E ntry :
All of these happens only on the closing of the candle . Means: Non Repainting! .
Clearly in the chart we are showing as green up arrow BO (breakout for buy) and red down arrow BD (breakdown for sell) to take your decision process smooth.
So, on the closing of the decision BO/BD candle we are entering the trade (with a thumping heart and nail biting ...)
S top Loss :
We are relying on the time tasted (last 40 years) mechanism of Average True Range (ATR) of default 14 period. This default period is also configurable.
So for Long trades: the 14 period ATR low band is the SL.
For Short trades: the 14 period ATR high band is the SL.
T arget :
We are depending on the thump rule of 1:2 Risk Reward. It's simple and effective. No fancy thing. We are closing the trade on double the favorable price movement compared to the SL placed. Of course, this RR ratio is confiurable from the settings, as usual.
What's Unqiue in it?
The utter simplicity of this trading mechanism. No fancy things like complex chart pattern, OI data, multiple candlestick patterns, Order flow analysis etc.
Simple level determination,
Marking clearly in the chart.
Making each parameter configurable in Settings and showing tooltip adjacent to the parameter to make you understand it better for your customization,
Wait for the candle close, thus eliminating the chances of repainting menace (as much as possible)
Additional momentum and volume check to trade entry confirmation.
Works with normal candlestick (nothing special ones like HA ...)
Showing everything as a Summary Table (which, again can be turned off optionally) overlaying at the bottom-right corner of the chart,
Optionally the Summary Table can be configured to alert you back (say you get it notified in your email or SMS).
That way, a single, simple, effective trade setup will ease your journey as smooth sail as possible.
Mentions
There are plenty of friends from whom time to time we borrowed some of the ideas while working closely together over last one year.
From tradingview community, we took the spirit of @zzzcrypto123 awesome work done long back (in 2020) as the indicator "ORB - Opening Range Breakout". (We tried to reach him for his explicit consent, unable to catch hold of him).
Some other publicly available materials we have consulted to get the additional checks (like RSI, volume).
Lat word
Use it please and thank you for your constant patronage in following us in this awesome platform. Let's keep growing together.
Disclaimer :
This piece of software does not come up with any warrantee or any rights of not changing it over the future course of time.
We are not responsible for any trading/investment decision you are taking out of the outcome of this indicator.

Forex Midpoint Stratejisi For Nasdaq English Knowledge:
Midpoint Strategy;
The general calculation method is a strategy that helps determine direction by the intersection of a MA line and the value obtained by dividing the lowest and highest price in the specified length range.
Başlangıç Periyodu: The data length of the Midpoint Line.
Kaydırma Seviyesi: The number of steps forward or backward of the Midpoint Line.
Yüzde Seviyesi: the amount of vertical scrolling.
Uzunluk: The length of the MA line
represents.
This strategy is prepared for the Nasdaq 5-minute period. It needs to be optimized for use on other instruments.
There are take profit and stop loss levels within the codes. Friends who want to use it can remove the invisibility from the relevant sections. Also, I removed the midpoint and the MA line so that it does not crowd the image, you can add it if you want.
Thank you.
Turkish Knowledge:
Midpoint Stratejisi;
Genel hesaplama yöntemi, belirlenen uzunluk aralığındaki en düşük ve en yüksek fiyatın ikiye bölümü ile elde edilen değer ve bir ortalama çizgisinin kesişimleriyle yön belirlemeye yardımcı bir stratejidir.
Başlangıç Period: Midpoint Çizgisinin veri uzunluğunu.
Kaydırma Seviyesi: Midpoint Çizgisinin ileri veya geri adım sayısını.
Yüzde Seviyesi: dikey kaydırma miktarını.
Uzunluk: Ortalama çizgisinin uzunluğunu
temsil etmektedir.
Bu strateji Nasdaq 5 dakikalık periot için hazırlanmıştır. Diğer enstrümanlarda kullanılması için optimize edilmesi gerekir.
Kodların içinde Kar alma , zarar durdurma seviyeleri mevcuttur. Kullanmak isteyen arkadaşlar ilgili bölümlerden görünmezliği kaldırabilirler. ayrıca midpoint ve ortalama çizgisinide görüntü kalabalığı yapmaması için ben kaldırdım isterseniz siz ekleyebilirsiniz.
Teşekkürler.

VXD SupercycleVXD is a brand new indicator and still developing. to minimize stop losses and overcome sideways market conditions, Higher Timeframe are recommended
Trend lines
-using Rolling VWAP as trend line to determined if Volume related to a certain price.
-you can switch RVWAP to EMA in the setting
ATR
-trailing 12*ATR and 2.4 Mutiplier
Pivot point and Rejected Block
Pivot show last High and low of a price in past bars
Rejected Block show when that High or Low price are important level to determined if it's Hidden Divergence or Divergence
Symbols on chart show Premium and Discount Prices
X-Cross - show potential reversal trend with weak volume .
O-circle - show potential reversal trend with strong volume .
Setting
Momentum: RSI = 25 , RSI MA = 14
Trend: Rolling VWAP and ATR and Subhag
Trailing STOP: ATR 12 x 2.4
Highlight Bars color when volume is above SMA 6
SMA200 act as TP Line
Risk:Reward Calculation
if Buy your Stoploss will be previous Pivot low
if Sell your Stoploss will be previous Pivot high and will be calculated form there, then show TP in Orange color line
VXD เป็นระบบเทรดที่ผมทดลองเอาหลาย ๆ ไอเดีย ทั้งจาก Youtube facebook และกลุ่มคนต่าง ๆ มารวบรวมไว้ แล้วตกผลึกขึ้นมาเป็นระบบนี้ ใน Timeframe ใหญ่ ๆ สามารถลากได้ทั้ง Cycle กันเลย
Trend lines
-ใช้ Rolling VWAP ของแอพ Tradingview (สามารถตั้งแค่าเป็น EMA ได้)
ATR
-ใช้ค่า ATR 12 Mutiplier 2.4
Pivot point and Rejected Block
Pivot โชว์เส้น High low และมีผลกับออเดอร์ หากแท่งเทียนปิดทะลุเส้นนี้
Rejected Block วาดแนวรับ-ต้าน อัตโนมัติ ใช้ประกอบ RSI ว่ามี Divergence หรือไม่
สัญลักษณ์ต่าง ๆ
X-Cross - แท่งกลืนกิน วอลุ่มน้อย
O-circle - แท่งกลืนกิน มีวอลุ่ม
Setting
Momentum: RSI = 25 , RSI MA = 14
Trend: Rolling VWAP and ATR and Subhag
Trailing STOP: ATR 12 x 2.4
Highlight Bars color when volume is above SMA 6
SMA200 act as TP Line
Risk:Reward Calculation
หาก Buy จุด SL จะอยู่ที่ Pivot low
หาก Sell จุด SL จะอยู่ที่ Pivot high และระบบจะคำนวณจากตรงนั้น จากนั้นแสดงเป็นเส้น TP สีส้ม
This Strategy Combined the following indicators and conditioning by me
ATR , RSI , EMA , SMA
Rolling VWAP - /script/ZU2UUu9T-Rolling-VWAP/
Regression Lines - Subhag form Subhag Ghosh /script/LHHBVpQu-Subhag-Ghosh-Algo-Version-for-banknifty/
Rejection Block , Pivots , High Volume Bars and PPDD form Super OrderBlock / FVG / BoS Tools by makuchaku & eFe /script/aZACDmTC-Super-OrderBlock-FVG-BoS-Tools-by-makuchaku-eFe/
ขอให้รวยครับ.

StocksDeveloper_AutoTraderWebLibrary "StocksDeveloper_AutoTraderWeb"
AutoTrader Web trading API functions implementation for Trading View.
preparePlaceOrderJson(account, symbol, group, variety) Prepare a place order json
Parameters:
account : Pseudo or group account number
symbol : AutoTrader Web's stock/derivative symbol
group : Set it to true to use group account (Default: false)
variety : Variety (Default: REGULAR)
Returns: A json message for the given order data
preparePlaceOrderAlertUsingOrderJson(orderJsonArray) Prepare a place order alert message using order json array
Parameters:
orderJsonArray : Order json can contain one or more orders
Returns: A complete alert message to place orders
preparePlaceOrderAlertMessage(account, symbol, group, variety, validity) Prepare a place order alert json message
Parameters:
account : Pseudo or group account number
symbol : AutoTrader Web's stock/derivative symbol
group : Set it to true to use group account (Default: false)
variety : Variety (Default: REGULAR)
validity : Validity (Default: DAY)
Returns: A complete alert message to place orders
Super EMA PrismThis script implements the Binary Trade Logic (BTL) algorithm to calculate two distinct scores that range from 0 to 7. One score is calculated assigning a power of 2 weight to the positive sign of 3 Phi^3 distant Moving Average (MA) slopes. The other score is calculated assigning a power of 2 weight to the sign of the difference between the price and the value of 3 Phi^3 distant Moving Average (MA).
For the first score, hereafter called as the angle score (AS), the largest MA slope positive sign receives weight 4, the middle length MA slope positive sign receives weight 2 and the shortest MA slope positive sign receives weight 1. The positive sign of an MA is defined as 1 if the slope of the MA is positive and 0, otherwise. Therefore, for MAs 305, 72 and 17, if slope(MA305) > 0, slope(MA72) < 0 and slope(MA17) > 0, then score will be 4*1 + 2*0 + 1*1 = 5. Up to my knowledge, this score was first proposed by Bo Williams and named by him as Prisma.
For the second score, hereafter called as the value score (VS), if the price > largest MA, it receives weight 4. If the price > the middle length MA, it receives weight 2 and if the price > the the shortest MA, it receives weight 1. Therefore, for MAs 305, 72 and 17, if price < MA305, price > MA72 and price > MA17, then score will be 4*0 + 2*1 + 1*1 = 3. Up to my knowledge, this score was first proposed by Bo Williams and named by him as Prisma.
Both AS and VS are calculated for Phi^3 lengths (610, 144, 34) and for Phi^3/2 lengths (305, 72, 17). The scores of the same kind calculated for each set of length are combined multiplying the Phi^3 length score by 10 and adding with with the Phi^3/2 score, therefore providing a 2 digit score ranging from 0 to 77. For instance, if we have AS(610, 144, 34) = 7 and AS(305, 72, 17) = 5, we have AS=75. At the same time, if we have VS(610, 144, 34) = 6 and VS(305, 72, 17) = 4, we have VS=64.
VS score is plotted by default in black, but it can be on white for dark themes. AS is plotted with the color of the longest MA used.
Chart background is colored according to the range of values for AS and VS, checked in the following order:
if AS >= 13 and VS <= 13 then back color = red
if AS >= 13 or VS <= 13 then back color = orange
if AS >= 64 and VS >= 64 then back color = green
if AS >= 64 or VS >= 64 then back color = blue
otherwise back color = none (white o black)

Phicube EMASAR ( EMA Support and Resistance )Indicator based on the Concept created by Bo Williams. But unlike the original that uses MIMAs, EMAs are used here.
Exponential moving averages will be shown according to fractal alignment, in order to show the important support and resistance levels ( SAR ).
When the fractals are aligned to become support,
we will have the EMA in the graph with a bright color.
When the fractals are aligned to become resistance, we will have EMA in the graph with a matte color.
Available exponential moving averages: 17,34,72,144,305,610,1292 and 2584
____________________________________________________//_____________________________________________________________________
Indicador baseado no Conceito criado pelo Bo Williams. Mas diferente do original que utiliza MIMAs, aqui é utilizado EMAs.
As médias móveis exponenciais serão mostradas de acordo com o alinhamento dos fractais, com objetivo de mostrar os níveis importantes
de suporte e resistência( SAR ).
Quando estiver com os fractais alinhados virando suporte, teremos no gráfico a EMA com uma cor em tom brilhante.
Quando estiver com os fractais alinhados virando resistência, teremos no gráfico a EMA com uma cor em tom fosco.
Médias móveis exponenciais disponíveis: 17,34,72,144,305,610,1292 e 2584

Custom EMA + FIBOThis script combines 6 EMAs with 3 Donchian Channel 78.6% and 21.4% intermediary level lines to perform trade analysis. The 6 EMAs (I, II, III , IV, V and VI ) default lengthes come from one of the Fibonacci Phi^3 and Phi^3/2 sub series (17, 34, 72, 144, 305 and 610), but can be changed to any values, particularly to the traditionally used 20, 40, 50, 100, 200 and 300. Up to my knowledge, Fibonacci Phi^3 and Phi^3/2 sub series lengthes were first proposed by Bo Williams.
The 3 Donchian Channels used have default lengthes 72, 305 and 1292, calculated after the first length default value of 72. For each of the 3 Donchian Channels only an upper line, set by default at 78.6%, is plotted in green and its complement, set to 21.4%, is plotted in red. When the closing price is above 3 green lines, we say it is Forbidden to Sell ( PV ), and when the closing price is below 3 red lines, we say it is Forbidden to Buy ( PC ). Those conditions are flagged on the chart. These PV-PC conditions were, up to my knowledge, first proposed by Bo Williams.

Trend Line & Delta Montosca [English v33.7]This indicator, Trend Line & Delta Montosca , is a high-precision tool designed to identify institutional entry points by combining price action structure with real-time volume sentiment (Order Flow).
Here is a breakdown of its core logic and operational flow:
1. Market Structure & Trendline Analysis
The indicator starts by identifying "Pivot Highs" and "Pivot Lows" based on the Sensitivity settings you chose.
Pivot Connect Method: It draws trendlines connecting these key structural points. A "Long" bias is established when a trendline is broken to the upside, and a "Short" bias when broken to the downside.
BOS (Break of Structure): It monitors when the price closes above the previous high or below the previous low to confirm the current market phase (Bullish or Bearish).
2. Intermarket Synchronization (ES + NQ)
This is a unique "Institutional" filter. The script checks a secondary symbol (e.g., NQ if you are trading ES) to ensure the move is happening across the entire market.
If both instruments hit a pivot at the same time, the trendline is drawn thicker, indicating higher institutional conviction.
3. Order Flow Validation (Delta)
Breaking a trendline is not enough; it must be backed by "Smart Money" volume. The indicator uses Lower Timeframe (LTF) Intrabar Data to calculate the Delta:
Strength Filter: It checks if the buying/selling volume in a single candle exceeds a specific percentage (set to 75% by default).
Efficiency Filter: It identifies "Absorption" where the price moves aggressively with lower volume, suggesting a lack of resistance.
4. Inverted FVG (Fair Value Gap) Reaction
The final "trigger" is often the reaction to a Fair Value Gap.
The script tracks bearish and bullish FVGs.
The Inversion Logic: A "Long" signal is only validated if the price "inverts" a bearish FVG (closes above it), treating the old resistance as new institutional support.
5. Blue Sky Filter (ATH)
When the price is at an All-Time High (ATH), traditional FVG reactions might not exist. The script includes an optional "Blue Sky" logic that allows for trend-following entries even if there is no previous FVG to invert, as long as the structural breakout and Delta are present.
Visualization Summary
Labels: Clearly mark "LONG" or "SHORT" at the exact candle of entry.
Snapshots: To help you review your trades, the script leaves a "visual footprint" (the trendline and the FVG box) that caused the signal, so you can see the exact institutional context after the trade has moved.

The Vector Alignment Matrix (VAM) - Pivot ExitIndicator Description: The Vector Alignment Matrix (VAM) – Pivot Exit Edition
The Vector Alignment Matrix (VAM) is an institutional-grade technical analysis tool designed for TradingView. It operates as a trend-following confluence engine, ensuring that lower-timeframe execution only occurs when supported by the "Weight of the Market"—the high-timeframe trend.
By automating the "Top-Down Analysis" methodology, VAM removes trader subjectivity and provides a clear, mechanical framework for entries and exits based on market structure.
Core Mechanics
1. The Global Matrix (HTF Alignment)
The indicator continuously monitors three critical timeframes: the Weekly (W), Daily (D), and 4-Hour (4H).
It uses a price-relative-to-range calculation to determine if the trend is Bullish or Bearish.
A "Matrix Bias" is established only when at least two of these timeframes agree.
This bias acts as a safety switch: if the Matrix is BULLISH, the indicator will ignore all sell signals, and vice versa.
2. Vector Execution (Break of Structure)
Once a bias is confirmed, the VAM looks for a Break of Structure (BOS) on the chart you are actively viewing.
It identifies significant Pivot Highs and Pivot Lows.
A signal is generated when price closes beyond a pivot in the direction of the Matrix Bias. This represents the moment the market "reveals its hand," confirming that the high-timeframe momentum is being absorbed by the lower timeframe.
3. Dynamic Pivot-Targeting (The Exit)
Unlike standard indicators that use arbitrary math for targets, the VAM uses Organic Exits.
Take Profit (TP): The indicator identifies the previous significant pivot level (resistance for longs, support for shorts) and sets it as the target.
Stop Loss (SL): The protective stop is anchored to the most recent opposing pivot, protecting the trade behind a structural barrier.

VSA Trading SystemMaster Reference Guide
📚 TABLE OF CONTENTS
PART 1: Core VSA Framework & Philosophy
PART 2: Volume Analysis Deep Dive
PART 3: Key VSA Setups (Complete)
PART 4: Wyckoff Accumulation & Distribution
PART 5: Multi-Timeframe Analysis
PART 6: Candle & Spread Analysis
PART 7: Entry, Stop Loss & Take Profit Rules
PART 8: Position Sizing & Risk Management
PART 9: Complete Trade Checklists
PART 10: Common Mistakes & Quick Reference
PART 11: Trade Journal Template
PART 1: CORE VSA FRAMEWORK & PHILOSOPHY
The Foundation Principle
╔════════════════════════════════════════════════════════════════╗
║ VSA FOUNDATION PRINCIPLE ║
╠════════════════════════════════════════════════════════════════╣
║ ║
║ "Smart Money leaves footprints in VOLUME" ║
║ ║
║ • Institutions cannot hide their activity ║
║ • Large orders create volume anomalies ║
║ • Price can lie, but volume confirms truth ║
║ • Volume is the FUEL, Price is the VEHICLE ║
║ • No fuel = No real move ║
║ ║
╚════════════════════════════════════════════════════════════════╝
The Golden Rule: Effort vs. Result
┌─────────────────────────────────────────────────────────────┐
│ HARMONY = TREND CONTINUATION │
│ ANOMALY = TREND REVERSAL │
└─────────────────────────────────────────────────────────────┘
Volume-Price Harmony Matrix
Price Action Volume Signal Interpretation
Rising ↑ Rising ↑ ✅ STRONG BULLISH Healthy uptrend, buyers in control
Rising ↑ Falling ↓ ⚠️ WEAK BULLISH Fuel running out, reversal near
Falling ↓ Rising ↑ ✅ STRONG BEARISH Aggressive selling, downtrend healthy
Falling ↓ Falling ↓ ⚠️ WEAK BEARISH Sellers exhausted, bottom forming
Effort vs. Result Complete Matrix
╔══════════════════════════════════════════════════════════════════╗
║ EFFORT VS RESULT MATRIX ║
╠═══════════════╦══════════════════╦════════════════════════════════╣
║ EFFORT ║ RESULT ║ INTERPRETATION ║
║ (Volume) ║ (Price Move) ║ ║
╠═══════════════╬══════════════════╬════════════════════════════════╣
║ ║ ║ ║
║ HIGH Volume ║ WIDE Spread ║ ✅ Normal - Trend healthy ║
║ ║ ║ ║
╠═══════════════╬══════════════════╬════════════════════════════════╣
║ ║ ║ ║
║ HIGH Volume ║ NARROW Spread ║ ⚠️ Absorption - Reversal soon ║
║ ║ ║ ║
╠═══════════════╬══════════════════╬════════════════════════════════╣
║ ║ ║ ║
║ LOW Volume ║ WIDE Spread ║ ⚠️ Fake move - Will reverse ║
║ ║ ║ ║
╠═══════════════╬══════════════════╬════════════════════════════════╣
║ ║ ║ ║
║ LOW Volume ║ NARROW Spread ║ 😐 No interest - Wait ║
║ ║ ║ ║
╚═══════════════╩══════════════════╩════════════════════════════════╝
PART 2: VOLUME ANALYSIS DEEP DIVE
Volume Classification (Compare to 20-period MA):
━━━━━━━━━━━━━━━━━━━━━━━━━━━━━━━━━━━━━━━━━━━━━━━━━━━
ULTRA HIGH ▓▓▓▓▓▓▓▓▓▓▓▓▓▓▓▓ (>200% of 20-period average)
→ Major institutional activity
→ Potential climax or absorption
HIGH ▓▓▓▓▓▓▓▓▓▓▓▓ (150-200% of average)
→ Significant interest
→ Breakout/breakdown confirmation
ABOVE AVERAGE ▓▓▓▓▓▓▓▓▓ (100-150% of average)
→ Healthy trend participation
→ Normal directional moves
AVERAGE ▓▓▓▓▓▓ (80-120% of average)
→ Baseline activity
→ Consolidation periods
LOW ▓▓▓ (50-80% of average)
→ Lack of interest
→ Test bars, pullbacks
ULTRA LOW ▓ (<50% of average)
→ No participation
→ Holiday/pre-news quiet
Volume Bar Colors & Meanings
┌─────────────────────────────────────────────────────────────┐
│ VOLUME BAR ANALYSIS │
├─────────────────────────────────────────────────────────────┤
│ │
│ GREEN Volume Bar (Buying Volume Dominant) │
│ ▓▓▓▓▓▓▓▓▓ │
│ + Green Candle = Healthy Buying │
│ + Red Candle = Possible Accumulation (watch for reversal) │
│ │
├─────────────────────────────────────────────────────────────┤
│ │
│ RED Volume Bar (Selling Volume Dominant) │
│ ░░░░░░░░░ │
│ + Red Candle = Healthy Selling │
│ + Green Candle = Possible Distribution (watch for drop) │
│ │
└─────────────────────────────────────────────────────────────┘
Volume Context Analysis
┌─────────────────────────────────────────────────────────────────┐
│ CONTEXT IS EVERYTHING │
├─────────────────────────────────────────────────────────────────┤
│ │
│ Same high volume candle means DIFFERENT things: │
│ │
│ AT SUPPORT: AT RESISTANCE: │
│ ┌─────────────┐ ┌─────────────┐ │
│ │ High Volume │ │ High Volume │ │
│ │ Small Body │ │ Small Body │ │
│ │ = BUYING │ │ = SELLING │ │
│ │ (Bullish) │ │ (Bearish) │ │
│ └─────────────┘ └─────────────┘ │
│ │
│ IN UPTREND: IN DOWNTREND: │
│ ┌─────────────┐ ┌─────────────┐ │
│ │ High Volume │ │ High Volume │ │
│ │ Small Body │ │ Small Body │ │
│ │ = Potential │ │ = Potential │ │
│ │ TOP │ │ BOTTOM │ │
│ └─────────────┘ └─────────────┘ │
│ │
└─────────────────────────────────────────────────────────────────┘
Volume Spike Interpretation
SCENARIO 1: Volume Spike at Support
─────────────────────────────────────
│
↓ ← Price drops to support
═════════════ Support Line
▼
▓▓▓▓▓▓▓▓▓▓▓▓ ← ULTRA HIGH Volume
→ INTERPRETATION: Absorption/Accumulation
→ ACTION: Prepare for LONG entry after confirmation
─────────────────────────────────────
SCENARIO 2: Volume Spike at Resistance
─────────────────────────────────────
▓▓▓▓▓▓▓▓▓▓▓▓ ← ULTRA HIGH Volume
▲
═════════════ Resistance Line
↑ ← Price rises to resistance
│
→ INTERPRETATION: Churning/Distribution
→ ACTION: Prepare for SHORT entry OR exit longs
─────────────────────────────────────
SCENARIO 3: Volume Spike on Breakout
─────────────────────────────────────
↗ ← Price breaks out
═════════════════════════════ Resistance
│
▓▓▓▓▓▓▓▓▓ ← HIGH Volume on breakout
→ INTERPRETATION: Valid Breakout
→ ACTION: ENTER in breakout direction
─────────────────────────────────────
SCENARIO 4: Low Volume on Breakout
─────────────────────────────────────
↗ ← Price breaks out
═════════════════════════════ Resistance
│
▓▓ ← LOW Volume on breakout
→ INTERPRETATION: FAKE Breakout
→ ACTION: DO NOT ENTER, wait for failure
─────────────────────────────────────
Recommended Volume Indicators
ESSENTIAL INDICATORS:
━━━━━━━━━━━━━━━━━━━━━━━━━━━━━━━━━━━━━━━
1. STANDARD VOLUME
└─ Basic but essential
└─ Color-coded by candle direction
2. VOLUME MOVING AVERAGE (20-period)
└─ Shows average volume
└─ Helps identify "high" vs "low" volume
└─ CRITICAL: Only consider signals where Volume > 1.5x MA
└─ Ultra High = Volume > 2x MA
3. VOLUME WEIGHTED AVERAGE PRICE (VWAP)
└─ Intraday fair value
└─ Institutional reference point
OPTIONAL BUT USEFUL:
━━━━━━━━━━━━━━━━━━━━━
• On-Balance Volume (OBV) - Cumulative flow, good for divergences
• Accumulation/Distribution Line - Money flow direction
• Volume Profile - Price levels with most volume
• Money Flow Index - Volume-weighted RSI
PART 3: KEY VSA SETUPS (COMPLETE)
Setup 1: Test No Supply (Bullish)
VISUAL:
Prior Uptrend
↗
↗
↗
↗
↗
↗ ┌───┐
↗ │ R │ ← Small RED candle (Test)
↗ └───┘
↗ │
↗ │ LOW VOLUME
↗ │
↗ ══════╧══════
COMPLETE CHECKLIST:
□ Existing uptrend (HH + HL pattern)
□ Small pullback candle (red/bearish)
□ Volume BELOW average (ideally <70% of 20-MA)
□ Volume LESS than previous 2 bars
□ Spread (range) is NARROW
□ Candle closes near its high (upper half)
□ Doesn't break previous swing low
□ Wicks are small (no heavy selling)
ENTRY TRIGGER:
→ Next candle closes green above test candle high
→ Volume on entry candle is average or above
STOP LOSS:
→ Below the test candle low
→ OR below the previous swing low
WHY IT WORKS:
Smart money "tests" to see if sellers remain.
Low volume = No sellers left = Safe to push higher
Setup 2: Test No Demand (Bearish)
VISUAL:
┌───┐
│ G │ ← Small GREEN candle (Test)
└───┘
│ LOW VOLUME
↗ │
↗ ══════════╧══════
↗ ↘
↗ ↘
↘
↘ Downtrend continues
COMPLETE CHECKLIST:
□ UP bar (close > open) - Green candle
□ Volume LESS than previous 2 bars
□ Volume BELOW average (ideally <70% of 20-MA)
□ Spread (range) is NARROW
□ Close in MIDDLE or LOW of bar
□ Located at resistance OR after uptrend
□ Price struggling to make new highs
ENTRY TRIGGER:
→ Next candle closes red below test candle low
STOP LOSS:
→ Above the test candle high
WHY IT WORKS:
Buyers tried but professionals not interested.
Low volume = No demand = Prepare for drop
Setup 3: Spring (Bull Trap Reversal)
VISUAL:
Support Line
═══════════════════════════════
↓↗ ← Spring (false breakdown + quick recovery)
Spring
(Bear Trap)
Price Chart:
════════════════════ Support
↓
↓ ← Break below support
▼
SPRING ← Ultra low point
↗
↗ ← Quick recovery above support
════════════════════
↗
↗ ← Uptrend begins
Volume Pattern:
On Spring: ▓▓▓ (Can be high or low)
On Test: ▓ (Must be LOW)
On Breakout: ▓▓▓▓▓▓▓ (High)
CHECKLIST:
□ Price dipped below support (Spring)
□ Quickly reversed back above support
□ Pullback test shows LOW VOLUME
□ Test candle doesn't break spring low
ENTRY:
→ Enter LONG on low volume test after spring
→ OR enter when price closes above spring high
STOP LOSS:
→ Below the spring low
Setup 4: Upthrust (Bear Trap Reversal)
VISUAL:
↑ False breakout above resistance
═══════════════════════════════ Resistance
↗↓ ← Upthrust (break above + fail)
Upthrust
(Bull Trap)
Price Chart:
↗
↗ ← Price rises
════════════════════ Resistance
↗
UPTHRUST ← Ultra high point (false break)
↓
↓ ← Quick rejection below resistance
════════════════════
↓
↘ ← Downtrend begins
Volume Pattern:
On Upthrust: ▓▓▓▓▓ (Often high - sucking in buyers)
On Test: ▓ (Must be LOW)
On Breakdown: ▓▓▓▓▓▓▓ (High)
CHECKLIST:
□ Price broke ABOVE resistance
□ Quickly FAILED and fell back below
□ Pullback test (rally) shows LOW VOLUME
□ Test candle doesn't break upthrust high
ENTRY:
→ Enter SHORT on low volume test after upthrust
→ OR enter when price closes below upthrust low
STOP LOSS:
→ Above the upthrust high
Setup 5: Absorption (Churning)
BEARISH ABSORPTION (Distribution at Top):
━━━━━━━━━━━━━━━━━━━━━━━━━━━━━━━━━━━━━━━
Price: ──────────────── Resistance
│ ▲ │
│ █ │ ← Small GREEN body
│ ▼ │ (buyers trying to push up)
─────┴───┴─────
Volume: ▓▓▓▓▓▓▓▓▓▓▓▓▓▓▓▓ ← MASSIVE (>200% average)
COMPLETE CHECKLIST:
□ Small/Medium GREEN candle
□ Volume > 2x average
□ Close in MIDDLE or LOWER half of candle
□ Located at resistance OR after extended uptrend
□ Price NOT making significant new highs despite volume
INTERPRETATION:
• Price tries to go up
• Huge volume BUT small price movement
• Where did all that buying go?
• Answer: Institutions ABSORBED it by selling
CONFIRMATION:
□ Next candle should be RED
RESULT: Expect price drop
═══════════════════════════════════════════════════
BULLISH ABSORPTION (Accumulation at Bottom):
━━━━━━━━━━━━━━━━━━━━━━━━━━━━━━━━━━━━━━━━━━━
│ ▼ │
│ █ │ ← Small RED body
│ ▲ │ (sellers trying to push down)
─────┴───┴─────
Price: ──────────────── Support
Volume: ▓▓▓▓▓▓▓▓▓▓▓▓▓▓▓▓ ← MASSIVE (>200% average)
COMPLETE CHECKLIST:
□ Small/Medium RED candle
□ Volume > 2x average
□ Close in MIDDLE or UPPER half of candle
□ Located at support OR after extended downtrend
□ Price NOT making significant new lows despite volume
INTERPRETATION:
• Price tries to go down
• Huge volume BUT small price movement
• Where did all that selling go?
• Answer: Institutions ABSORBED it by buying
CONFIRMATION:
□ Next candle should be GREEN
RESULT: Expect price rise
Setup 6: Climactic Action
BUYING CLIMAX (Marks the TOP):
━━━━━━━━━━━━━━━━━━━━━━━━━━━━━━
▲
/│\ ← WIDEST candle in uptrend
/ │ \ + Close near HIGH
/ │ \
/ │ \
▓▓▓▓▓▓▓▓▓▓▓▓▓ ← HIGHEST volume in uptrend
CHARACTERISTICS:
□ Widest spread (range) in the trend
□ Highest volume in the trend
□ Usually closes near the high
□ Euphoria/FOMO buying
□ Professionals SELLING to public
→ Signals END of Uptrend
→ Distribution phase begins
→ DO NOT BUY - Wait for short setup
═══════════════════════════════════════════
SELLING CLIMAX (Marks the BOTTOM):
━━━━━━━━━━━━━━━━━━━━━━━━━━━━━━━━━━
\ │ /
\ │ /
\ │ /
\│/ ← WIDEST candle in downtrend
▼ + Often closes OFF the lows
▓▓▓▓▓▓▓▓▓▓▓▓▓ ← HIGHEST volume in downtrend
CHARACTERISTICS:
□ Widest spread (range) in the trend
□ Highest volume in the trend
□ Often closes in middle or upper half (key difference!)
□ Panic selling
□ Professionals BUYING from public
→ Signals END of Downtrend
→ Accumulation phase begins
→ DO NOT SELL - Wait for long setup after TEST
Setup 7: Stopping Volume
STOPPING VOLUME (Bottom Formation):
━━━━━━━━━━━━━━━━━━━━━━━━━━━━━━━━━━━
Price falling...
↓
↓
↓
┌───────────┐
│ ███████ │ ← Wide spread DOWN bar
│ ███████ │ BUT closes OFF the lows
│ │ │ (Close in UPPER half - KEY!)
└─────│─────┘
│
▓▓▓▓▓▓▓▓▓▓▓▓▓▓ ← ULTRA HIGH volume
CHECKLIST:
□ Downtrend in progress
□ Wide spread (large range) candle
□ Ultra high volume (>200% of average)
□ Closes in UPPER HALF of the bar (critical!)
□ May have long lower wick
INTERPRETATION:
→ Professionals absorbing all selling
→ Supply being removed from market
NEXT STEPS:
→ Expect sideways consolidation
→ Wait for LOW VOLUME TEST before entry
→ Do NOT enter immediately - wait for confirmation
Setup 8: Breakout Confirmation
VALID BREAKOUT: FAKE BREAKOUT:
─────────────── ───────────────
│ ↑ HIGH VOLUME │ ↑ LOW VOLUME
─────│───────── ─────│─────────
│ │
▓▓▓▓▓▓▓▓▓ (Volume >150% avg) ▓▓▓ (Volume <100% avg)
✅ ENTER TRADE ❌ DO NOT ENTER
(Wait for failure/retest)
VALID BREAKOUT CHECKLIST:
□ Price closes ABOVE resistance (for long) or BELOW support (for short)
□ Volume > 150% of 20-period average
□ Candle closes near the extreme (high for long, low for short)
□ Preferably preceded by low volume consolidation
□ Higher timeframes support the direction
ENTRY:
→ Enter on close of breakout candle
→ OR enter on low volume retest of breakout level
STOP LOSS:
→ Below breakout level (for longs)
→ Above breakout level (for shorts)
PART 4: WYCKOFF ACCUMULATION & DISTRIBUTION
WYCKOFF ACCUMULATION
Price:
│
│ PS SC
│ ↘ ↓
│ ↘ ↓ AR
│ ↘ ↓ ↗
│ ↘ ↓ ↗ ST
│ ↓↗──────────┐ LPS
│ PHASE A │ PHASE B │ ↘ ↗ SOS
│ │ │ ↘ ↗ ↗
│ │ │ ↓ ↗
│ │ │ SPRING↗
│ │ PHASE C│ │↗ PHASE D
│ │ │ ↗
└────────────┴─────────┴────┴──────────→
PHASE DEFINITIONS:
━━━━━━━━━━━━━━━━━━
PHASE A - Stopping the Downtrend:
PS = Preliminary Support (first buying appears)
SC = Selling Climax (panic selling absorbed - HIGH volume)
AR = Automatic Rally (dead cat bounce)
ST = Secondary Test (retest of SC lows - lower volume than SC)
PHASE B - Building the Cause:
→ Sideways accumulation
→ Volume generally decreasing
→ Multiple tests of support and resistance
→ "Backing up to the creek" patterns
PHASE C - The Test:
SPRING = False breakdown below support (bear trap)
→ Can be high or low volume
→ Key: Quick recovery above support
TEST = Low volume retest after spring (CRITICAL ENTRY POINT)
PHASE D - Markup Begins:
SOS = Sign of Strength (strong rally with high volume)
LPS = Last Point of Support (final low volume pullback)
→ This is the LAST safe entry before markup
PHASE E - Markup (Not shown):
→ Strong uptrend with increasing volume
→ Higher highs and higher lows
VOLUME PATTERN:
━━━━━━━━━━━━━━━
▓▓▓▓▓▓ ▓▓ ▓▓ ▓▓▓▓▓
(High) (Lower) (Low on) (High on
at SC during Spring SOS)
Phase B Test
Key Accumulation Entry Point
ENTRY CHECKLIST - THE SPRING + TEST:
━━━━━━━━━━━━━━━━━━━━━━━━━━━━━━━━━━━━━
□ Phase A complete (SC and AR visible)
□ Phase B complete (sideways range established)
□ Spring occurred (price dipped below support)
□ Price quickly recovered above support
□ Test pullback has LOW VOLUME (critical!)
□ Test doesn't break spring low
ENTRY TRIGGER:
→ Enter LONG after low volume test
→ OR enter on break above spring high with volume
STOP LOSS:
→ Below spring low
TARGET:
→ Measure the range (support to resistance)
→ Project that distance above resistance
Wyckoff Distribution Schematic--
WYCKOFF DISTRIBUTION
Price:
│ PSY
│ ↗ BC
│ ↗ ↗ ↘
│ PHASE D ↗ ↗ ↘ UTAD
│ ↘ ↗ ↗ ↘ ↗↘
│ ↘ ↗ ↗────────↘↗ ↘
│ ↘ ↗ │ PHASE B │ ↘ SOW
│ ↘ ↗ │ │ ↘
│ ↘ │ PHASE C │ ↘
│ LPSY │ │ ↘
│ │ │ ↘
└────────────────┴─────────┴─────────→
PHASE DEFINITIONS:
━━━━━━━━━━━━━━━━━━
PHASE A - Stopping the Uptrend:
PSY = Preliminary Supply (first selling appears)
BC = Buying Climax (euphoric buying absorbed - HIGH volume)
AR = Automatic Reaction (first drop)
ST = Secondary Test (retest of BC highs - lower volume than BC)
PHASE B - Building the Cause:
→ Sideways distribution
→ Volume patterns show supply entering on rallies
→ Multiple tests of support and resistance
PHASE C - The Test:
UTAD = Upthrust After Distribution (false breakout above resistance)
→ Bull trap
→ Often high volume (sucking in late buyers)
TEST = Low volume retest after upthrust (ENTRY POINT FOR SHORTS)
PHASE D - Markdown Begins:
SOW = Sign of Weakness (strong drop with high volume)
LPSY = Last Point of Supply (final low volume rally)
→ This is the LAST safe short entry before markdown
PHASE E - Markdown (Not shown):
→ Strong downtrend with increasing volume
→ Lower highs and lower lows
PART 5: MULTI-TIMEFRAME ANALYSIS
The 4-Step Alignment Process
╔════════════════════════════════════════════════════════════════╗
║ 4-HOUR CHART (MACRO VIEW) ║
╠════════════════════════════════════════════════════════════════╣
║ ║
║ PURPOSE: Determine the PRIMARY trend direction ║
║ ║
║ ANALYZE: ║
║ □ Overall trend (Uptrend/Downtrend/Range) ║
║ □ Major support/resistance levels ║
║ □ Volume trend (increasing/decreasing with price) ║
║ □ Any divergences forming (Price↑ Volume↓ = warning) ║
║ □ Look for Accumulation/Distribution phases ║
║ ║
║ SIGNALS TO NOTE: ║
║ • Climax volume at extremes ║
║ • Trend line breaks ║
║ • Higher timeframe absorption patterns ║
║ ║
║ RULE: Only trade in the direction of 4H trend ║
║ ║
╚════════════════════════════════════════════════════════════════╝
↓ ALIGNED?
╔════════════════════════════════════════════════════════════════╗
║ 1-HOUR CHART (STRUCTURE) ║
╠════════════════════════════════════════════════════════════════╣
║ ║
║ PURPOSE: Confirm trend and identify key levels ║
║ ║
║ ANALYZE: ║
║ □ Trend alignment with 4H ║
║ □ Key swing highs and lows ║
║ □ Support/resistance zones ║
║ □ Moving average positions (if used) ║
║ □ Current Wyckoff phase ║
║ □ Volume pattern on recent moves ║
║ ║
║ SIGNALS TO NOTE: ║
║ • Structure breaks (BOS - Break of Structure) ║
║ • Change of character (CHoCH) ║
║ • Volume spikes at key levels ║
║ ║
║ RULE: Structure must support trade direction ║
║ ║
╚════════════════════════════════════════════════════════════════╝
↓ ALIGNED?
╔════════════════════════════════════════════════════════════════╗
║ 30-MIN CHART (SETUP) ║
╠════════════════════════════════════════════════════════════════╣
║ ║
║ PURPOSE: Identify specific trade setups ║
║ ║
║ ANALYZE: ║
║ □ Pullback/rally quality ║
║ □ Is pullback volume DECREASING? (Required for entry) ║
║ □ Approach to key levels ║
║ □ VSA patterns forming ║
║ □ Price action quality ║
║ ║
║ SIGNALS TO NOTE: ║
║ • Test patterns (No Supply/No Demand) ║
║ • Absorption at levels ║
║ • Volume drying up on counter-moves ║
║ ║
║ RULE: Wait for low volume pullback before entry ║
║ ║
╚════════════════════════════════════════════════════════════════╝
↓ ALIGNED?
╔════════════════════════════════════════════════════════════════╗
║ 15-MIN CHART (ENTRY TRIGGER) ║
╠════════════════════════════════════════════════════════════════╣
║ ║
║ PURPOSE: Precise entry timing ║
║ ║
║ ANALYZE: ║
║ □ Entry trigger candle forming ║
║ □ Volume on trigger candle ║
║ □ Exact stop loss placement ║
║ □ Immediate support/resistance ║
║ ║
║ ENTRY TRIGGERS (Need one): ║
║ • Test No Supply / Test No Demand ║
║ • Spring/Upthrust + Test ║
║ • Absorption + Confirmation candle ║
║ • Breakout with High Volume ║
║ ║
║ CRITICAL RULE: Wait for candle CLOSE before entering ║
║ ║
╚════════════════════════════════════════════════════════════════╝
↓ ALL ALIGNED?
═══════════════════════════
✅ EXECUTE TRADE
═══════════════════════════
PART 6: CANDLE & SPREAD ANALYSIS
Candle Close Position Analysis
WHERE DOES THE CANDLE CLOSE?
Strong Bullish: Neutral: Bearish:
┌─────────┐ ┌─────────┐ ┌─────────┐
│ ████████│ ← Close │ │ │ │ │
│ ████████│ at TOP │ │ │ ← Close │ │ │
│ ████████│ (Upper │ ████ │ MIDDLE │ │ │
│ │ │ third) │ ████ │ │ ████████│ ← Close
│ │ │ │ │ │ │ ████████│ BOTTOM
└─────────┘ └─────────┘ └─────────┘
✅ Buyers won ⚠️ Struggle ❌ Sellers won
decisively (indecision) decisively
APPLICATION RULES:
━━━━━━━━━━━━━━━━━━
□ Close in UPPER 1/3 + High Volume = Strong Buying
□ Close in LOWER 1/3 + High Volume = Strong Selling
□ Close in MIDDLE + High Volume = Battle (Wait for clarity)
FOR ABSORPTION SIGNALS:
□ Bearish Absorption: Green candle closes in MIDDLE or LOWER half
□ Bullish Absorption: Red candle closes in MIDDLE or UPPER half
Spread (Range) Analysis-
SPREAD = High - Low of Candle
┌──────────────────────────────────────────────────────────────┐
│ SPREAD ANALYSIS │
├──────────────────────────────────────────────────────────────┤
│ │
│ WIDE SPREAD + HIGH VOLUME: │
│ ┌─────────────────────┐ │
│ │ │ │ │
│ │ ███████████ │ → HEALTHY momentum │
│ │ ███████████ │ → Trend continuation │
│ │ │ │ → Strong commitment │
│ └─────────────────────┘ │
│ ▓▓▓▓▓▓▓▓▓▓▓▓▓▓▓▓▓▓▓▓▓ │
│ │
├──────────────────────────────────────────────────────────────┤
│ │
│ NARROW SPREAD + HIGH VOLUME: │
│ ┌───────────┐ │
│ │ ████ │ ← Small body │
│ │ ████ │ │
│ └───────────┘ → ABSORPTION warning! │
│ ▓▓▓▓▓▓▓▓▓▓▓▓ → Effort with no result │
│ → Expect reversal │
│ │
├──────────────────────────────────────────────────────────────┤
│ │
│ WIDE SPREAD + LOW VOLUME: │
│ ┌─────────────────────┐ │
│ │ │ │ │
│ │ ███████████ │ → FAKE MOVE warning! │
│ │ ███████████ │ → No commitment │
│ │ │ │ → Will likely reverse │
│ └─────────────────────┘ │
│ ▓▓▓ │
│ │
├──────────────────────────────────────────────────────────────┤
│ │
│ NARROW SPREAD + LOW VOLUME: │
│ ┌───────────┐ │
│ │ ████ │ → No interest │
│ │ ████ │ → Consolidation │
│ └───────────┘ → WAIT for signal │
│ ▓▓ │
│ │
└──────────────────────────────────────────────────────────────┘
PART 7: ENTRY, STOP LOSS & TAKE PROFIT RULES
╔═══════════════════════════════════════════════════════════════╗
║ LONG ENTRY CRITERIA ║
╠═══════════════════════════════════════════════════════════════╣
║ ║
║ MULTI-TIMEFRAME CHECK: ║
║ ──────────────────── ║
║ □ 4H: Uptrend + Rising Volume (or no bearish divergence) ║
║ □ 1H: Uptrend + Price holding above support ║
║ □ 30M: Pullback with DECREASING volume ║
║ □ 15M: Entry trigger present ║
║ ║
║ VOLUME CONFIRMATION: ║
║ ─────────────────── ║
║ □ Pullback candles have LOW volume ║
║ □ No bearish absorption at highs ║
║ □ Prior trend showed harmony (price↑ + volume↑) ║
║ □ Volume compared to 20-MA (signal volume significant?) ║
║ ║
║ CANDLE CONFIRMATION: ║
║ ─────────────────── ║
║ □ Entry candle closes in upper half ║
║ □ No abnormally wide spread with low volume (fake move) ║
║ □ Test candle had appropriate close position ║
║ ║
║ ENTRY TRIGGERS (Any One): ║
║ ──────────────────────── ║
║ ○ Test No Supply confirmed (low vol red, next green) ║
║ ○ Spring + Low Volume Test ║
║ ○ Breakout with High Volume (>150% of average) ║
║ ○ Bullish Absorption at support + green confirmation ║
║ ○ Stopping volume + Test ║
║ ║
║ WAIT FOR CANDLE CLOSE BEFORE ENTERING! ║
║ ║
╚═══════════════════════════════════════════════════════════════╝
Short Entry Criteria-
╔═══════════════════════════════════════════════════════════════╗
║ SHORT ENTRY CRITERIA ║
╠═══════════════════════════════════════════════════════════════╣
║ ║
║ MULTI-TIMEFRAME CHECK: ║
║ ──────────────────── ║
║ □ 4H: Downtrend OR Bearish Divergence (price↑ volume↓) ║
║ □ 1H: Lower Highs forming OR at resistance ║
║ □ 30M: Rally with DECREASING volume ║
║ □ 15M: Entry trigger present ║
║ ║
║ VOLUME CONFIRMATION: ║
║ ─────────────────── ║
║ □ Rally candles have LOW volume ║
║ □ No bullish absorption at lows ║
║ □ Bearish Absorption visible at resistance ║
║ □ Anomaly present (price↑ but volume↓) ║
║ ║
║ CANDLE CONFIRMATION: ║
║ ─────────────────── ║
║ □ Entry candle closes in lower half ║
║ □ No abnormally wide spread with low volume (fake move) ║
║ □ Test candle had appropriate close position ║
║ ║
║ ENTRY TRIGGERS (Any One): ║
║ ──────────────────────── ║
║ ○ Test No Demand confirmed (low vol green, next red) ║
║ ○ Upthrust + Low Volume Test ║
║ ○ Sign of Weakness (SOW) - Big red + High Volume ║
║ ○ Breakdown with High Volume (>150% of average) ║
║ ○ Bearish Absorption at resistance + red confirmation ║
║ ║
║ WAIT FOR CANDLE CLOSE BEFORE ENTERING! ║
║ ║
╚═══════════════════════════════════════════════════════════════╝
Stop Loss Placement Rules-
╔════════════════════════════════════════════════════════════╗
║ STOP LOSS PLACEMENT RULES ║
╠════════════════════════════════════════════════════════════╣
║ ║
║ FOR LONG TRADES: ║
║ ───────────────── ║
║ Option A: Below the TEST candle low ║
║ Option B: Below the Spring low (if Spring setup) ║
║ Option C: Below support zone + ATR buffer ║
║ ║
║ BUFFER FORMULA: ║
║ SL = Support Level - (0.5 × ATR of entry timeframe) ║
║ ║
║ VISUAL: ║
║ ─────────────────────────────── Support/Demand Zone ║
║ ← Entry Point ║
║ ║
║ ─────────────────────────────── SL: Below Support ║
║ │← 1-2% below zone OR below spring low ║
║ ║
╠════════════════════════════════════════════════════════════╣
║ ║
║ FOR SHORT TRADES: ║
║ ────────────────── ║
║ Option A: Above the TEST candle high ║
║ Option B: Above the Upthrust high (if Upthrust setup) ║
║ Option C: Above resistance zone + ATR buffer ║
║ ║
║ BUFFER FORMULA: ║
║ SL = Resistance Level + (0.5 × ATR of entry timeframe) ║
║ ║
║ VISUAL: ║
║ │← SL: Above resistance/recent high ║
║ ─────────────────────────────── Resistance Zone ║
║ ← Entry Point (Short) ║
║ ║
╚════════════════════════════════════════════════════════════╝
Take Profit Rules-
╔════════════════════════════════════════════════════════════╗
║ TAKE PROFIT RULES ║
╠════════════════════════════════════════════════════════════╣
║ ║
║ MINIMUM RISK:REWARD = 1:2 ║
║ ║
║ TP LEVELS (Based on Structure): ║
║ ──────────────────────────── ║
║ TP1: First resistance/support level = Aim for 1R ║
║ TP2: Second resistance/support level = Aim for 2R ║
║ TP3: Major level OR measured move = Aim for 3R+ ║
║ ║
║ SCALING OUT METHOD: ║
║ ───────────────────── ║
║ □ TP1 (33-40%): Close first portion at 1R ║
║ → Move SL to breakeven after TP1 hit ║
║ ║
║ □ TP2 (33-40%): Close second portion at 2R ║
║ → Trail SL to 1R profit level ║
║ ║
║ □ TP3 (20-34%): Close final portion at 3R or trail ║
║ → Use trailing stop below each new swing ║
║ ║
║ TRAILING STOP METHOD: ║
║ ────────────────────────────── ║
║ Longs: Trail SL below each new Higher Low ║
║ Shorts: Trail SL above each new Lower High ║
║ ║
║ VISUAL (Long Trade): ║
║ ║
║ TP3 ─────────────── (Major Resistance: 3R) ║
║ ║
║ TP2 ─────────────── (Next Resistance: 2R) ║
║ ║
║ TP1 ─────────────── (First Resistance: 1R) ║
║ ║
║ ENTRY ────────────── ║
║ ║
║ SL ───────────────── ║
║ ║
╠════════════════════════════════════════════════════════════╣
║ ║
║ EXIT ON VSA WEAKNESS SIGNALS: ║
║ ───────────────────────────── ║
║ Exit immediately if you see: ║
║ □ Climactic volume against your position ║
║ □ Absorption candle against your position ║
║ □ Break of structure on entry timeframe ║
║ □ Test No Demand (if long) or Test No Supply (if short) ║
║ ║
╚════════════════════════════════════════════════════════════╝
PART 8: POSITION SIZING & RISK MANAGEMENT
Position Size Calculator-
╔════════════════════════════════════════════════════════════════╗
║ POSITION SIZE CALCULATOR ║
╠════════════════════════════════════════════════════════════════╣
║ ║
║ STEP 1: Define Account Risk ║
║ ───────────────────────────── ║
║ Account Size: $__________ ║
║ Risk Per Trade: ____% (Recommended: 1-2%) ║
║ Dollar Risk: $__________ (Account × Risk%) ║
║ ║
║ STEP 2: Define Trade Risk ║
║ ──────────────────────── ║
║ Entry Price: $__________ ║
║ Stop Loss: $__________ ║
║ Risk Per Unit: $__________ (Entry - SL, absolute value) ║
║ ║
║ STEP 3: Calculate Position ║
║ ───────────────────────── ║
║ ║
║ Dollar Risk ║
║ Position Size = ───────────────── ║
║ Risk Per Unit ║
║ ║
║ ═══════════════════════════════════════════════════════════ ║
║ EXAMPLE: ║
║ ═══════════════════════════════════════════════════════════ ║
║ ║
║ Account: $10,000 ║
║ Risk: 1% = $100 ║
║ Entry: $50.00 ║
║ Stop Loss: $48.00 ║
║ Risk Per Share: $2.00 ║
║ ║
║ Position Size = $100 ÷ $2.00 = 50 shares ║
║ ║
╚════════════════════════════════════════════════════════════════╝
Risk Management Rules-
╔════════════════════════════════════════════════════════════╗
║ RISK MANAGEMENT RULES ║
╠════════════════════════════════════════════════════════════╣
║ ║
║ CAPITAL PROTECTION: ║
║ ─────────────────── ║
║ □ Never risk more than 1-2% per trade ║
║ □ Maximum 3 trades open at same time ║
║ □ Maximum 5% total portfolio risk at any time ║
║ □ Reduce size by 50% after 2 consecutive losses ║
║ □ Stop trading after 3 consecutive losses (review) ║
║ ║
║ CORRELATION AWARENESS: ║
║ ────────────────────── ║
║ □ Don't take same-direction trades in correlated pairs ║
║ □ Treat correlated positions as single larger position ║
║ ║
║ DRAWDOWN RULES: ║
║ ─────────────── ║
║ □ 5% daily drawdown = Stop trading for the day ║
║ □ 10% weekly drawdown = Review and reduce size ║
║ □ 20% monthly drawdown = Pause and full strategy review ║
║ ║
╚════════════════════════════════════════════════════════════╝
Position Scaling Strategy-
ENTRY SCALING (Building Position):
━━━━━━━━━━━━━━━━━━━━━━━━━━━━━━━━━━━━━━━
┌─────────────────────────────────────┐
│ │
│ Initial Entry: 50% of position │
│ First Add: 25% of position │
│ Second Add: 25% of position │
│ │
│ Add ONLY when: │
│ • Price moves in your favor │
│ • Volume confirms the move │
│ • Move SL to breakeven first │
│ • New VSA confirmation present │
│ │
└─────────────────────────────────────┘
EXIT SCALING (Taking Profits):
━━━━━━━━━━━━━━━━━━━━━━━━━━━━━━━━
┌─────────────────────────────────────┐
│ │
│ TP1 (1R): Close 40% of position │
│ → Move SL to breakeven │
│ │
│ TP2 (2R): Close 40% of position │
│ → Trail SL to 1R │
│ │
│ TP3 (3R+): Close remaining 20% │
│ → Trail or let run │
│ │
└─────────────────────────────────────┘
PART 9: COMPLETE TRADE CHECKLISTS
Pre-Trade Validation Checklist-
╔════════════════════════════════════════════════════════════════════╗
║ COMPLETE VSA TRADE CHECKLIST ║
╠════════════════════════════════════════════════════════════════════╣
║ ║
║ TRADE TYPE: □ LONG □ SHORT ║
║ DATE: ___________ PAIR/ASSET: ___________ ║
║ ║
║ ═══════════════════════════════════════════════════════════════ ║
║ SECTION A: MULTI-TIMEFRAME ALIGNMENT (Must have 4/4) ║
║ ═══════════════════════════════════════════════════════════════ ║
║ ║
║ 4H CHART: ║
║ □ Trend aligned with trade direction ║
║ □ Volume confirms trend (harmony) ║
║ □ No major resistance/support blocking immediately ║
║ □ No bearish/bullish divergence against trade ║
║ ║
║ 1H CHART: ║
║ □ Trend aligned with trade direction ║
║ □ Structure intact (HH/HL for long, LH/LL for short) ║
║ □ Key level identified and respected ║
║ □ Wyckoff phase supports trade ║
║ ║
║ 30M CHART: ║
║ □ Trend aligned with trade direction ║
║ □ Pullback/Rally has DECREASING volume (LOW volume) ║
║ □ Near support zone (long) or resistance zone (short) ║
║ □ VSA setup forming ║
║ ║
║ 15M CHART: ║
║ □ Entry signal clearly present ║
║ □ Volume confirming the signal ║
║ □ Candle close position supports trade ║
║ □ Waiting for candle CLOSE before entry ║
║ ║
║ ═══════════════════════════════════════════════════════════════ ║
║ SECTION B: VOLUME ANALYSIS (Must have 4/4) ║
║ ═══════════════════════════════════════════════════════════════ ║
║ ║
║ □ Volume compared to 20-MA (is signal volume significant?) ║
║ □ Volume and Price in Harmony OR Clear reversal signal ║
║ □ Pullback/Rally has LOW volume (below average) ║
║ □ No absorption signals against trade direction ║
║ ║
║ ═══════════════════════════════════════════════════════════════ ║
║ SECTION C: CANDLE/SPREAD ANALYSIS (Must have 3/3) ║
║ ═══════════════════════════════════════════════════════════════ ║
║ ║
║ □ Spread (range) appropriate for the signal ║
║ □ Close position supports trade direction ║
║ □ No wide spread + low volume moves (fake move warning) ║
║ ║
║ ═══════════════════════════════════════════════════════════════ ║
║ SECTION D: ENTRY SIGNAL (Must have 1 confirmed) ║
║ ═══════════════════════════════════════════════════════════════ ║
║ ║
║ □ Test No Supply / Test No Demand ║
║ □ Spring / Upthrust + Low Volume Test ║
║ □ Absorption at key level + Confirmation candle ║
║ □ Breakout with High Volume (>150% average) ║
║ □ Stopping Volume + Test ║
║ ║
║ ═══════════════════════════════════════════════════════════════ ║
║ SECTION E: RISK MANAGEMENT (Must have 5/5) ║
║ ═══════════════════════════════════════════════════════════════ ║
║ ║
║ □ Risk ≤ 1-2% of account ║
║ □ Risk:Reward ≥ 1:2 ║
║ □ Stop Loss placed at logical structure level ║
║ □ Position size calculated correctly ║
║ □ Not during major news event (checked economic calendar) ║
║ ║
║ Entry Price: _______________ ║
║ Stop Loss: _______________ ║
║ Risk Per Unit: _______________ ║
║ Position Size: _______________ ║
║ TP1 (1R): _______________ ║
║ TP2 (2R): _______________ ║
║ TP3 (3R): _______________ ║
║ ║
║ ═══════════════════════════════════════════════════════════════ ║
║ SECTION F: FINAL CONFIRMATION ║
║ ═══════════════════════════════════════════════════════════════ ║
║ ║
║ □ Wait for candle CLOSE (don't enter mid-candle) ║
║ □ Check spread/slippage acceptable ║
║ □ Trade noted in journal before entering ║
║ ║
║ ════════════════════════════════════════════════════════════ ║
║ MINIMUM REQUIREMENTS: ║
║ • Section A: 4/4 timeframes aligned ║
║ • Section B: 4/4 volume checks passed ║
║ • Section C: 3/3 candle checks passed ║
║ • Section D: 1+ entry signal confirmed ║
║ • Section E: 5/5 risk checks passed ║
║ • Section F: All final checks done ║
║ ║
║ TOTAL: 17+ checks must be YES to execute ║
║ ════════════════════════════════════════════════════════════ ║
║ ║
║ ════════════════════════════ ║
║ ✅ EXECUTE TRADE ║
║ ════════════════════════════ ║
║ ║
╚════════════════════════════════════════════════════════════════════╝
Quick Decision Flowchart-
┌─────────────────┐
│ POTENTIAL │
│ TRADE SPOTTED │
└────────┬────────┘
│
▼
┌──────────────────────────┐
│ Is 4H trend in your │
│ trade direction? │
└──────────────┬───────────┘
│ │
YES NO
│ │
▼ ▼
┌──────────────┐ ┌─────────────┐
│ Check 1H │ │ NO TRADE │
│ alignment │ │ ─────── │
└──────┬───────┘ └─────────────┘
│
ALIGNED?
│ │
YES NO → NO TRADE
│
▼
┌───────────────────┐
│ Is 30M showing │
│ LOW VOLUME │
│ pullback/rally? │
└─────────┬─────────┘
│
YES │ NO
│ │
│ ▼
│ ┌────────────┐
│ │ WAIT │
│ │ for setup │
│ └────────────┘
│
▼
┌───────────────────┐
│ VSA Signal on │
│ 15M Chart? │
│ (Candle CLOSED?) │
└─────────┬─────────┘
│
YES │ NO → WAIT
│
▼
┌───────────────────┐
│ R:R at least 1:2? │
└─────────┬─────────┘
│
YES │ NO → NO TRADE
│
▼
┌───────────────────┐
│ Risk ≤ 2% of │
│ account? │
└─────────┬─────────┘
│
YES │ NO → REDUCE SIZE
│
▼
┌───────────────────┐
│ Major news │
│ within 30 min? │
└─────────┬─────────┘
│
NO │ YES → WAIT
│
▼
╔═════════════════════╗
║ EXECUTE TRADE ║
║ ═══════════════ ║
║ • Set Entry ║
║ • Set Stop Loss ║
║ • Set Targets ║
║ • Log in Journal ║
╚═════════════════════╝
PART 10: COMMON MISTAKES & QUICK REFERENCE
Top 10 VSA Mistakes to Avoid-
╔════════════════════════════════════════════════════════════╗
║ TOP 10 VSA MISTAKES ║
╠════════════════════════════════════════════════════════════╣
║ ║
║ 1. ❌ Analyzing volume in ISOLATION ║
║ ✅ Always combine volume + price + location + context ║
║ ║
║ 2. ❌ Entering on HIGH volume pullback ║
║ ✅ Only enter on LOW volume pullback (Test) ║
║ ║
║ 3. ❌ Ignoring the CLOSE position of candle ║
║ ✅ Where it closes matters as much as volume ║
║ ║
║ 4. ❌ Trading VSA signals against higher TF trend ║
║ ✅ Always align with 4H/1H direction first ║
║ ║
║ 5. ❌ Chasing breakouts without volume confirmation ║
║ ✅ Wait for high volume OR don't enter ║
║ ║
║ 6. ❌ Entering during NEWS events ║
║ ✅ Volume is distorted during news - wait 30min ║
║ ║
║ 7. ❌ Misreading climax volume as continuation ║
║ ✅ Recognize climax = potential reversal ║
║ ║
║ 8. ❌ Not waiting for TEST confirmation ║
║ ✅ Wait for Spring/Upthrust to be TESTED (low volume) ║
║ ║
║ 9. ❌ Ignoring spread (candle range) ║
║ ✅ Wide spread + Low volume = FAKE MOVE warning ║
║ ║
║ 10. ❌ Not using relative volume ║
║ ✅ Compare to 20-period volume MA ║
║ ║
╚════════════════════════════════════════════════════════════╝
Critical Rules - Never Break These-
╔═══════════════════════════════════════════════════════════════╗
║ NEVER BREAK THESE RULES ║
╠═══════════════════════════════════════════════════════════════╣
║ ║
║ 1. NEVER enter without volume confirmation ║
║ ║
║ 2. NEVER trade against the higher timeframe trend ║
║ ║
║ 3. NEVER chase breakouts with low volume ║
║ ║
║ 4. ALWAYS wait for the TEST after accumulation/distribution ║
║ ║
║ 5. ALWAYS use stop loss - no exceptions ║
║ ║
║ 6. ALWAYS confirm 4H → 1H → 30M → 15M alignment ║
║ ║
║ 7. ALWAYS wait for candle CLOSE before entering ║
║ ║
║ 8. When Volume and Price DIVERGE → Expect REVERSAL ║
║ ║
║ 9. High Volume + Small Candle = Smart Money Activity ║
║ ║
║ 10. Low Volume on Pullback = Healthy Trend (entry zone) ║
║ ║
║ 11. High Volume on Pullback = Warning Sign (don't enter) ║
║ ║
║ 12. NEVER risk more than 2% on any single trade ║
║ ║
╚═══════════════════════════════════════════════════════════════╝
PART 11: TRADE JOURNAL TEMPLATE
Trade Journal Entry--
╔════════════════════════════════════════════════════════════════════╗
║ TRADE JOURNAL ║
╠════════════════════════════════════════════════════════════════════╣
║ ║
║ TRADE #: _____ DATE: ___________ TIME: ___________ ║
║ ║
║ PAIR/ASSET: _______________ DIRECTION: □ LONG □ SHORT ║
║ ║
║ ═══════════════════════════════════════════════════════════════ ║
║ PRE-TRADE ANALYSIS ║
║ ═══════════════════════════════════════════════════════════════ ║
║ ║
║ TIMEFRAME ALIGNMENT: ║
║ 4H: _____________________________________________ ║
║ 1H: _____________________________________________ ║
║ 30M: ____________________________________________ ║
║ 15M: ____________________________________________ ║
║ ║
║ VSA SETUP TYPE: ________________________________ ║
║ ║
║ VOLUME OBSERVATION: ____________________________ ║
║ _________________________________________________ ║
║ ║
║ CANDLE/SPREAD NOTES: ___________________________ ║
║ _________________________________________________ ║
║ ║
║ ═══════════════════════════════════════════════════════════════ ║
║ TRADE PARAMETERS ║
║ ═══════════════════════════════════════════════════════════════ ║
║ ║
║ Entry Price: _______________ ║
║ Stop Loss: _______________ ║
║ Position Size: _______________ ║
║ Risk Amount: $_____________ (____% of account) ║
║ ║
║ TP1: _______________ (1R) ║
║ TP2: _______________ (2R) ║
║ TP3: _______________ (3R) ║
║ ║
║ ═══════════════════════════════════════════════════════════════ ║
║ POST-TRADE ANALYSIS ║
║ ═══════════════════════════════════════════════════════════════ ║
║ ║
║ RESULT: □ WIN □ LOSS □ BREAKEVEN ║
║ ║
║ Exit Price: _______________ ║
║ P&L: $_____________ (____R) ║
║ ║
║ WHAT WENT WELL: ║
║ _________________________________________________ ║
║ _________________________________________________ ║
║ ║
║ WHAT COULD IMPROVE: ║
║ _________________________________________________ ║
║ _________________________________________________ ║
║ ║
║ DID I FOLLOW MY RULES? □ YES □ NO ║
║ If NO, which rule was broken? _____________________ ║
║ ║
║ SCREENSHOT SAVED: □ YES ║
║ ║
║ LESSONS LEARNED: ║
║ _________________________________________________ ║
║ _________________________________________________ ║
║ _________________________________________________ ║
║ ║
╚════════════════════════════════════════════════════════════════════╝
Weekly Review Template-
╔════════════════════════════════════════════════════════════════════╗
║ WEEKLY REVIEW ║
╠════════════════════════════════════════════════════════════════════╣
║ ║
║ WEEK OF: _______________ ║
║ ║
║ STATISTICS: ║
║ ─────────── ║
║ Total Trades: _____ ║
║ Wins: _____ (____%) ║
║ Losses: _____ (____%) ║
║ Breakeven: _____ ║
║ Total R Gained/Lost: _____R ║
║ P&L: $_____ ║
║ ║
║ BEST TRADE THIS WEEK: ║
║ Setup: ______________ R Gained: _____R ║
║ Why it worked: ____________________________________ ║
║ ║
║ WORST TRADE THIS WEEK: ║
║ Setup: ______________ R Lost: _____R ║
║ Why it failed: ____________________________________ ║
║ ║
║ RULES FOLLOWED: _____% ║
║ RULES BROKEN: _____% ║
║ ║
║ PATTERNS NOTICED: ║
║ _________________________________________________ ║
║ _________________________________________________ ║
║ ║
║ GOALS FOR NEXT WEEK: ║
║ 1. _______________________________________________ ║
║ 2. _______________________________________________ ║
║ 3. _______________________________________________ ║
║ ║
╚════════════════════════════════════════════════════════════════════╝
FINAL SUMMARY
╔════════════════════════════════════════════════════════════════╗
║ THE VSA TRADING PROCESS ║
╠════════════════════════════════════════════════════════════════╣
║ ║
║ 1. SCAN for volume anomalies on charts ║
║ ║
║ 2. IDENTIFY the pattern (Test, Absorption, Spring, etc.) ║
║ ║
║ 3. CONFIRM across multiple timeframes (4H → 1H → 30M → 15M) ║
║ ║
║ 4. ANALYZE candle close position and spread ║
║ ║
║ 5. WAIT for trigger (don't anticipate, react to confirmation) ║
║ ║
║ 6. CALCULATE position size based on stop distance ║
║ ║
║ 7. EXECUTE with predefined entry, stop, and targets ║
║

Institutional Confluence Nexus [Pro]The Problem: Noise vs. Signal
In the world of Smart Money Concepts (SMC), traders are often overwhelmed by "chart clutter." Standard indicators blindly highlight every Fair Value Gap (FVG) and Order Block (OB), regardless of whether the market is trending, ranging, or dead. This leads to analysis paralysis and low-probability entries.
The Institutional Confluence Nexus was built to solve this. It is not just a structure detector; it is a filtering engine. It uses a multi-factor model to hide low-probability zones and only highlight setups where Structure, Volume, and Momentum align.
The "Quantum" Integration
This script includes a built-in Quantum Regression Oscillator (QRO) engine running in the background. Unlike standard RSI or MACD which are reactive (lagging), the QRO uses Linear Regression mathematics to project momentum trajectory.
By combining institutional structure (Price Action) with quantum momentum (Math), this tool generates specific high-probability signals that only appear when price action and momentum are in perfect agreement.
How It Works & Visual Guide
This indicator is a complete trading suite. Here is what every symbol and color on your chart represents:
1. The "Nexus" Reversal Signals (Triangles)
Symbol : Green Triangle (Up) / Red Triangle (Down) labeled NEXUS.
Logic : These appear when price taps a valid Order Block that aligns with the macro trend (200 EMA).
Meaning : These are your primary "Trend Join" setups. They indicate that the institutional trend is resuming after a retracement.
2. High-Volume Breakouts (Bar Colors)
Symbol : Yellow Candles (Bullish) / Orange Candles (Bearish).
Logic : The script detects when a Break of Structure (BOS) occurs with Above-Average Volume.
Meaning : A breakout without volume is often a fakeout. These colored bars confirm that institutions are fueling the move. If you see a Yellow bar, it means "Smart Money" is buying the breakout.
3. QRO Confluence Signals (Labels)
These are the most advanced signals in the suite, combining Price Action with the internal Oscillator:
SNIPER (Blue/Purple) : The strongest reversal signal.
Condition : Price taps a Fair Value Gap + The internal QRO is at extreme volatility bands (Oversold/Overbought).
PB BUY / PB SELL (Aqua/Orange) : A trend continuation signal.
Condition : Price pulls back into a Fair Value Gap + The internal QRO confirms momentum is still healthy (above/below midline).
Note : These signals automatically draw a Red Line at the invalidation point (Stop Loss) to help you manage risk immediately.
4. The Confluence Dashboard
A non-intrusive Heads-Up Display (HUD) in the corner gives you a snapshot of the market state:
Trend : Is price above/below the 200 EMA?
Volume : Is current volume anomalous (High) or normal?
Structure : Are we breaking up, down, or ranging?
Settings & Customization
Smart Money Structure: Toggle FVGs and Order Blocks on/off.
FVG Extend: Control how far the gap "zones" extend to the right to see them as support/resistance zones.
Volume Filter: Enable/Disable the volume requirement (Keep enabled for higher strike rate).
Risk Management: Adjust the "Lookback" period for the automatic Stop Loss lines.
For Developers (Open Source)
I have kept the code open-source to foster learning in the Pine Script community. You can study how:
ta.linreg is used to smooth RSI data for the internal QRO engine.
box.new and line.new are used for dynamic drawing and extending zones.
var variables are used to store historical FVG levels to detect precise crossovers.
Disclaimer:
This tool is designed to assist with technical analysis and educational purposes. It does not guarantee profits. Always manage your risk and use this in conjunction with your own analysis.

[SMC] Binet Nexus Alpha : Institutional Liquidity & Order BlocksBINET™ NEXUS ALPHA : The Institutional SMC Terminal
Overview
The BINET™ NEXUS ALPHA is a professional-grade execution terminal designed to bridge the gap between retail "Smart Money Concepts" and actual institutional data. Built on the proprietary BINET™ Core v17.5 engine, this terminal prioritizes Price Action Narrative over lagging signals.
Unlike basic SMC indicators that clutter charts with unverified boxes, the Nexus Alpha uses an Institutional Confluence Engine to filter out retail "stop-run" noise and identify high-conviction zones where big money is actually positioning.
The Narrative Engine (Visual Intelligence)
The terminal replaces abstract lines with a high-visibility geometric narrative designed for rapid scanning on 4K/high-res monitors:
█ (Solid Blue Block): Institutional Vol Spike. Represents a "Foundation Surge" where volume significantly exceeds retail averages.
◆ (Gold Diamond): Liquidity Hunt. Direct identification of price tapping into resting Order Blocks (OB) or Fair Value Gaps (FVG).
● (Blue Circle): Macro Accumulation. Alerts you to long-term institutional position building.
▲/▼ (Triangles): Market Structure Breaks. Real-time Break of Structure (BOS) tracking.
The Command HUD (Mission Control)
The terminal features a real-time Hierarchical HUD that audits every trade before you enter:
Signal Quality (Sync Score): A 0-100% confluence rating. 85%+ represents "Elite Institutional Sync."
Stop Advisor & Risk Meter: Calculates the highest-volume liquidity bin for stop placement and warns you if the Max Stop Distance (%) is exceeded.
Market Health Engine: Automatically detects the current regime (Scalp, Swing, or Position) to adjust your execution strategy.
Success Probability: A rolling trajectory of the system's performance, showing whether recent win-rates are trending up (▲) or down (▼).
Institutional Workflow
Filter: Check the Trade Bias (Long/Short) on the HUD.
Confirm: Wait for the Sync Score to cross your threshold (Default 65%).
Audit: Verify that the Risk Meter is not in "High Exposure" mode.
Execute: Target the provided TP1/TP2 levels projected on the chart.
Technical Specifications
Language: Pine Script® v6
Logic: Smart Money Concepts (SMC) + Volume Delta Analysis
Core: BINET™ v17.5 Concurrency Engine
Founder's Note
The BINET™ NEXUS ALPHA was designed for traders who demand institutional-grade transparency. It is the final piece of the BINET Suite, designed to be used alongside the Macro Sector Rotation and Trend Matrix tools for a complete Top-Down to Bottom-Up trading workflow.

Liquidity OS [PyraTime]Trading the lower timeframes (1m-15m) often feels like navigating a minefield. Charts become cluttered with noise, making it nearly impossible to distinguish random price action from genuine institutional intent. Traders frequently suffer from "Analysis Paralysis," struggling to spot clean setups or reacting too slowly to calculate risk accurately in fast-moving markets.
The Solution: A Clean Operating SystemPyraTime: Liquidity OS was engineered to solve this specific problem. It is not just a signal tool; it is a complete visual operating system designed to declutter your workspace and enforce discipline. By filtering price action through a strict confluence of Structure, Time, and Momentum, it highlights only high-probability liquidity sweeps while automating the complex mental math of risk management.
How to Use This Indicator
This tool is designed for Scalpers and Day Traders utilizing liquidity concepts (ICT/SMC).
Wait for the Signal: The indicator automatically identifies valid "Unicorn" setups—a confluence of a Liquidity Sweep followed by a displacement (Breaker) and a Fair Value Gap.
Verify the Context: Look for the "Elite Glass" Capsule.
Cyan Glass: Bullish Setup (Long Opportunity).
Pink Glass: Bearish Setup (Short Opportunity).
Note: The capsule physically covers messy wicks, forcing your eye to focus solely on the clear path to profit or invalidation.
Consult the Dashboard: Glance at the "Monitor" panel (bottom right). It instantly displays the Position Size required to trade the setup based on your pre-defined account risk (e.g., 1%).
Execute & Focus: Use the visual TP (Take Profit) and SL (Stop Loss) lines provided by the capsule to set your orders. The system automatically dims old trades ("Smart Spotlight") so only the current opportunity competes for your attention.
Key Features
🦁 "Elite Glass" Visual Engine: A proprietary rendering system that displays trade setups as high-transparency, polished capsules. This creates a "Focus-First" environment, reducing chart noise and visual fatigue.
🧠 Smart Spotlight: Automatically manages visual history. The two most recent active zones remain bright, while older setups automatically dim to reduce clutter. Mitigated zones can be set to turn into "Ghosts" or disappear entirely.
🛡️ Risk OS Dashboard: A real-time, persistent monitor that calculates:
Dynamic Position Sizing: Tells you exactly how many units/contracts to trade.
Session Metrics: Tracks Win Rate, Total R, and Expectancy live.
Safety Warnings: Highlights "High Risk" inputs in red if you exceed safety thresholds.
⚡ Logic Filters:
Killzones: Restrict signals to specific sessions (e.g., London/NY) with a custom timezone selector.
Trend Flow: Filters signals to align with the 4H Trend (EMA 50).
Deep Value: Ensures buys occur in Discount and sells in Premium zones.
Specifications & Settings
Risk OS: Customizable Target R:R, Stop Loss Padding (ATR Multiplier), and Risk Per Trade %.
Liquidity Filters: "1m Scalp Mode" (increased sensitivity), Killzone Time/Timezone selector, and Force Reset button.
Visual Interface: Fully customizable colors. Toggles for "Show Midlines" (50% of FVG) and "Show Structure Breaks" (BOS lines) to further reduce noise.
Performance: Built on Pine Script v6 with null-safe execution and optimized garbage collection for zero-lag performance on all timeframes.
Disclaimer: Risk metrics, position sizing, and performance data displayed by this indicator are for informational and educational purposes only. This tool does not execute trades, manage funds, or guarantee future results. Always trade with a regulated broker and verify calculations independently.

Level to level Multi-TF + ATRLevel to level Multi-Timeframe + ATR/ADR Daily Progress
This indicator is a complete multi-timeframe market structure and volatility toolkit, designed primarily for active forex traders.
It combines Williams Fractals on five higher timeframes (Weekly, Daily, H4, H1, M5) with a live ATR/ADR dashboard, allowing you to see at a glance how much of the typical daily move has already been completed and how much “room” the market realistically has left to run.
Fractals are drawn as arrows and colored zones that clearly mark swing highs and lows, supply/demand pockets, and key reaction areas. These zones can be used as dynamic support/resistance, liquidity pools, and target/stop regions. The multi‑TF design lets you read higher‑timeframe structure while executing on lower timeframes, which is ideal for scalping and intraday trading.
The built‑in volatility table shows:
ATR Progress (%) with green / yellow / red status to indicate whether the current session is still developing, mature, or potentially exhausted.
Daily ATR & ADR values in pips, so you always know the typical and current range of the day.
Done / Left range, highlighting how many pips have already been travelled from low to high, and how many are statistically left.
ATR and ADR projection lines are also plotted from the daily open, giving you clear intraday reference levels for take profit, stop placement, and expected session extremes.
This tool works especially well when combined with Smart Money Concepts (SMC) such as:
Break of Structure (BOS) and Change of Character (CHoCH) using fractal highs/lows.
Liquidity grabs and stop hunts around fractal zones.
Order blocks and fair value gaps that overlap with higher‑TF fractals and ATR/ADR levels.
Use it on majors like EUR/USD, GBP/USD, XAU/USD or indices, on anything from fast M1–M5 scalping to H1–H4 swing trading. All colors, timeframes, sensitivities and volatility settings are fully customizable so you can adapt it to your own style and template.

