Structural Liquidity Signals [BullByte]Structural Liquidity Signals (SFP, FVG, BOS, AVWAP)
Short description
Detects liquidity sweeps (SFPs) at pivots and PD/W levels, highlights the latest FVG, tracks AVWAP stretch, arms percentile extremes, and triggers after confirmed micro BOS.
Full description
What this tool does
Structural Liquidity Signals shows where price likely tapped liquidity (stop clusters), then waits for structure to actually change before it prints a trigger. It spots:
Liquidity sweeps (SFPs) at recent pivots and at prior day/week highs/lows.
The latest Fair Value Gap (FVG) that often “pulls” price or serves as a reaction zone.
How far price is stretched from two VWAP anchors (one from the latest impulse, one from today’s session), scaled by ATR so it adapts to volatility.
A “percentile” extreme of an internal score. At extremes the script “arms” a setup; it only triggers after a small break of structure (BOS) on a closed bar.
Originality and design rationale, why it’s not “just a mashup”
This is not a mashup for its own sake. It’s a purpose-built flow that links where liquidity is likely to rest with how structure actually changes:
- Liquidity location: We focus on areas where stops commonly cluster—recent pivots and prior day/week highs/lows—then detect sweeps (SFPs) when price wicks beyond and closes back inside.
- Displacement context: We track the last Fair Value Gap (FVG) to account for recent inefficiency that often acts as a magnet or reaction zone.
- Stretch measurement: We anchor VWAP to the latest N-bar impulse and to the Daily session, then normalize stretch by ATR to assess dislocation consistently across assets/timeframes.
- Composite exhaustion: We combine stretch, wick skew, and volume surprise, then bend the result with a tanh transform so extremes are bounded and comparable.
- Dynamic extremes and discipline: Rather than triggering on every sweep, we “arm” at statistical extremes via percent-rank and only fire after a confirmed micro Break of Structure (BOS). This separates “interesting” from “actionable.”
Key concepts
SFP (liquidity sweep): A candle briefly trades beyond a level (where stops sit) and closes back inside. We detect these at:
Pivots (recent swing highs/lows confirmed by “left/right” bars).
Prior Day/Week High/Low (PDH/PDL/PWH/PWL).
FVG (Fair Value Gap): A small 3‑bar gap (bar2 high vs bar1 low, or vice versa). The latest gap often acts like a magnet or reaction zone. We track the most recent Up/Down gap and whether price is inside it.
AVWAP stretch: Distance from an Anchored VWAP divided by ATR (volatility). We use:
Impulse AVWAP: resets on each new N‑bar high/low.
Daily AVWAP: resets each new session.
PR (Percentile Rank): Where the current internal score sits versus its own recent history (0..100). We arm shorts at high PR, longs at low PR.
Micro BOS: A small break of the recent high (for longs) or low (for shorts). This is the “go/no‑go” confirmation.
How the parts work together
Find likely liquidity grabs (SFPs) at pivots and PD/W levels.
Add context from the latest FVG and AVWAP stretch (how far price is from “fair”).
Build a bounded score (so different markets/timeframes are comparable) and compute its percentile (PR).
Arm at extremes (high PR → short candidate; low PR → long candidate).
Only print a trigger after a micro BOS, on a closed bar, with spacing/cooldown rules.
What you see on the chart (legend)
Lines:
Teal line = Impulse AVWAP (resets on new N‑bar extreme).
Aqua line = Daily AVWAP (resets each session).
PDH/PDL/PWH/PWL = prior day/week levels (toggle on/off).
Zones:
Greenish box = latest Up FVG; Reddish box = latest Down FVG.
The shading/border changes after price trades back through it.
SFP labels:
SFP‑P = SFP at Pivot (dotted line marks that pivot’s price).
SFP‑L = SFP at Level (at PDH/PDL/PWH/PWL).
Throttle: To reduce clutter, SFPs are rate‑limited per direction.
Triggers:
Triangle up = long trigger after BOS; triangle down = short trigger after BOS.
Optional badge shows direction and PR at the moment of trigger.
Optional Trigger Zone is an ATR‑sized box around the trigger bar’s close (for visualization only).
Background:
Light green/red shading = a long/short setup is “armed” (not a trigger).
Dashboard (Mini/Pro) — what each item means
PR: Percentile of the internal score (0..100). Near 0 = bullish extreme, near 100 = bearish extreme.
Gauge: Text bar that mirrors PR.
State: Idle, Armed Long (with a countdown), or Armed Short.
Cooldown: Bars remaining before a new setup can arm after a trigger.
Bars Since / Last Px: How long since last trigger and its price.
FVG: Whether price is in the latest Up/Down FVG.
Imp/Day VWAP Dist, PD Dist(ATR): Distance from those references in ATR units.
ATR% (Gate), Trend(HTF): Status of optional regime filters (volatility/trend).
How to use it (step‑by‑step)
Keep the Safety toggles ON (default): triggers/visuals on bar‑close, optional confirmed HTF for trend slope.
Choose timeframe:
Intraday (5m–1h) or Swing (1h–4h). On very fast/thin charts, enable Performance mode and raise spacing/cooldown.
Watch the dashboard:
When PR reaches an extreme and an SFP context is present, the background shades (armed).
Wait for the trigger triangle:
It prints only after a micro BOS on a closed bar and after spacing/cooldown checks.
Use the Trigger Zone box as a visual reference only:
This script never tells you to buy/sell. Apply your own plan for entry, stop, and sizing.
Example:
Bullish: Sweep under PDL (SFP‑L) and reclaim; PR in lower tail arms long; BOS up confirms → long trigger on bar close (ATR-sized trigger zone shown).
Bearish: Sweep above PDH/pivot (SFP‑L/P) and reject; PR in upper tail arms short; BOS down confirms → short trigger on bar close (ATR-sized trigger zone shown).
Settings guide (with “when to adjust”)
Safety & Stability (defaults ON)
Confirm triggers at bar close, Draw visuals at bar close: Keep ON for clean, stable prints.
Use confirmed HTF values: Applies to HTF trend slope only; keeps it from changing until the HTF bar closes.
Performance mode: Turn ON if your chart is busy or laggy.
Core & Context
ATR Length: Bigger = smoother distances; smaller = more reactive.
Impulse AVWAP Anchor: Larger = fewer resets; smaller = resets more often.
Show Daily AVWAP: ON if you want session context.
Use last FVG in logic: ON to include FVG context in arming/score.
Show PDH/PDL/PWH/PWL: ON to see prior day/week levels that often attract sweeps.
Liquidity & Microstructure
Pivot Left/Right: Higher values = stronger/rarer pivots.
Min Wick Ratio (0..1): Higher = only more pronounced SFP wicks qualify.
BOS length: Larger = stricter BOS; smaller = quicker confirmations.
Signal persistence: Keeps SFP context alive for a few bars to avoid flicker.
Signal Gating
Percent‑Rank Lookback: Larger = more stable extremes; smaller = more reactive extremes.
Arm thresholds (qHi/qLo): Move closer to 0.5 to see more arms; move toward 0/1 to see fewer arms.
TTL, Cooldown, Min bars and Min ATR distance: Space out triggers so you’re not reacting to minor noise.
Regime Filters (optional)
ATR percentile gate: Only allow triggers when volatility is at/above a set percentile.
HTF trend gate: Only allow longs when the HTF slope is up (and shorts when it’s down), above a minimum slope.
Visuals & UX
Only show “important” SFPs: Filters pivot SFPs by Volume Z and |Impulse stretch|.
Trigger badges/history and Max badge count: Control label clutter.
Compact labels: Toggle SFP‑P/L vs full names.
Dashboard mode and position; Dark theme.
Reading PR (the built‑in “oscillator”)
PR ~ 0–10: Potential bullish extreme (long side can arm).
PR ~ 90–100: Potential bearish extreme (short side can arm).
Important: “Armed” ≠ “Enter.” A trigger still needs a micro BOS on a closed bar and spacing/cooldown to pass.
Repainting, confirmations, and HTF notes
By default, prints wait for the bar to close; this reduces repaint‑like effects.
Pivot SFPs only appear after the pivot confirms (after the chosen “right” bars).
PD/W levels come from the prior completed candles and do not change intraday.
If you enable confirmed HTF values, the HTF slope will not change until its higher‑timeframe bar completes (safer but slightly delayed).
Performance tips
If labels/zones clutter or the chart lags:
Turn ON Performance mode.
Hide FVG or the Trigger Zone.
Reduce badge history or turn badge history off.
If price scaling looks compressed:
Keep optional “score”/“PR” plots OFF (they overlay price and can affect scaling).
Alerts (neutral)
Structural Liquidity: LONG TRIGGER
Structural Liquidity: SHORT TRIGGER
These fire when a trigger condition is met on a confirmed bar (with defaults).
Limitations and risk
Not every sweep/extreme reverses; false triggers occur, especially on thin markets and low timeframes.
This indicator does not provide entries, exits, or position sizing—use your own plan and risk control.
Educational/informational only; no financial advice.
License and credits
© BullByte - MPL 2.0. Open‑source for learning and research.
Built from repeated observations of how liquidity runs, imbalance (FVG), and distance from “fair” (AVWAPs) combine, and how a small BOS often marks the moment structure actually shifts.
Search in scripts for "BOS"

HH HL LH LL + BOS / CHoCHHH HL LH LL + BOS / CHoCH Structure Indicator (ATR Adaptive)
This indicator provides a complete market structure framework using swing-based pivots, real-time trend detection, BOS (Break of Structure), CHoCH (Change of Character), and optional ATR-adaptive swing sensitivity.
🔹 Core Features
1. Market Structure Labels
The script detects and labels:
HH – Higher High
LH – Lower High
HL – Higher Low
LL – Lower Low
These labels help visualize trend continuation or weakness in structure.
Each label type can be individually toggled ON/OFF in settings.
2. ATR-Based Adaptive Swing Length (Optional)
Swing pivots can be calculated using:
A fixed manual swing length, or
A dynamic ATR-based swing length that adjusts automatically to volatility.
Increasing volatility → longer swings
Decreasing volatility → tighter swings
This makes structure detection more stable and timeframe-adaptive.
3. Close-Based Break of Structure (BOS)
The indicator identifies a BOS when:
Price closes above the previous swing high (Bullish BOS↑)
Price closes below the previous swing low (Bearish BOS↓)
BOS labels can be turned ON/OFF without affecting internal calculations.
4. CHoCH (Change of Character)
CHoCH is triggered when a BOS occurs against the current trend, indicating a potential trend reversal:
CHoCH↑ – Bearish → Bullish reversal
CHoCH↓ – Bullish → Bearish reversal
CHoCH remains active even when BOS labels are turned off.
5. Alerts
The indicator provides alert conditions for:
CHoCH↑ (Bullish Trend Shift)
CHoCH↓ (Bearish Trend Shift)
This allows traders to automate notifications for significant trend changes.
6. Trend State Tracking
The script internally tracks the current structure-based trend:
Uptrend
Downtrend
Undefined
The trend updates dynamically based on real BOS events.
7. Fully Backwards Compatible
The indicator generates structure, BOS, and CHoCH even when scrolling back deep in chart history, thanks to extended max_bars_back handling.
Summary
This tool provides a complete, flexible, and non-repainting framework for market structure analysis, suitable for:
SMC/ICT traders
Swing & intraday traders
Trend traders
Price action analysts
With adaptive swing detection, clean structure labeling, BOS/CHoCH logic, and alert integration, the indicator helps traders understand market transitions with clarity and precision.

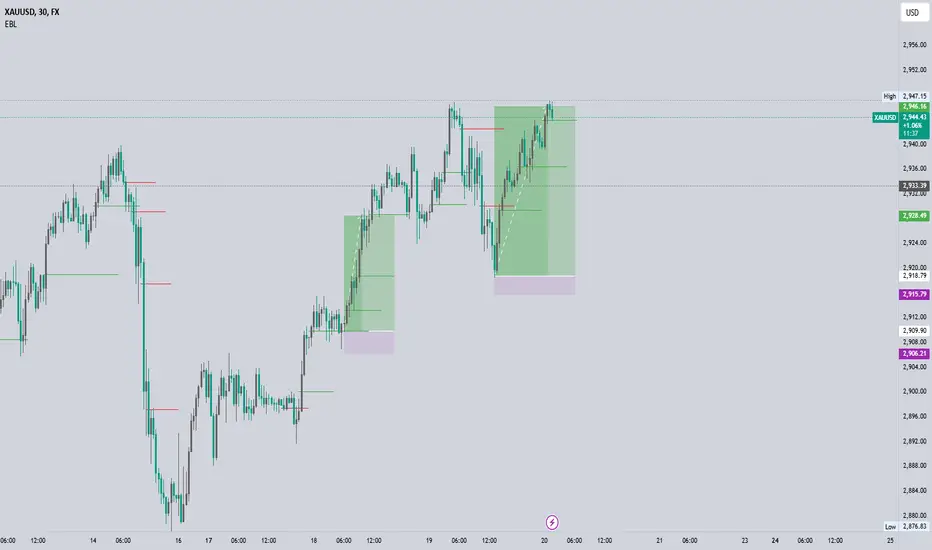
EBL - Enhanced BOS LogicEBL - Enhanced BOS Logic
The EBL (Enhanced Break of Structure Logic) script is a powerful tool for traders who want to identify and act on key structural shifts in the market. By combining visual cues, such as horizontal lines and dynamic arrows, the script highlights critical points of interest where market behavior may indicate significant bullish or bearish momentum.
What Makes EBL Unique?
Break of Structure (BOS) Identification:
The script dynamically detects when price breaks above or below significant highs and lows, marking these levels as key BOS points.
Once a BOS level is confirmed, it is displayed on the chart as a horizontal line, allowing traders to easily identify areas of potential support and resistance.
Real-Time Validation and Invalidations:
Bullish BOS levels remain active until a bearish candle closes below the initiating bullish candle.
Similarly, bearish BOS levels remain active until a bullish candle closes above the initiating bearish candle.
If a BOS level is invalidated, both the corresponding line and its arrow are automatically removed to maintain chart clarity.
Visual Clarity with Arrows and Lines:
Customizable triangle arrows (green for bullish and red for bearish) appear alongside lines to signal entry opportunities.
Traders can adjust line length, colors, and visibility of arrows to fit their charting style.
Alerts for Confirmation:
Receive alerts when bullish or bearish structures are confirmed, ensuring you never miss a signal even when away from your chart.
How the Script Works
Detection of Bullish and Bearish Structures:
The script identifies a "Bullish Break" when the price closes above the high of a bullish candle followed by a bearish one.
A "Bearish Break" is detected when the price closes below the low of a bearish candle followed by a bullish one.
Line and Arrow Placement:
Horizontal lines are drawn at the high or low of the respective BOS level.
Triangular arrows are plotted just below or above the respective levels to indicate potential trade opportunities.
Automatic Cleanup:
When a line is invalidated by opposing market movement, both the line and its connected arrow are automatically removed from the chart.
How to Use EBL
Settings:
Adjust line colors (green for bullish, red for bearish) to suit your charting theme.
Customize arrow visibility or hide lines if you prefer a less cluttered chart.
Set the horizontal line length to match your desired timeframe and analysis depth.
Trading Concepts:
Trend Reversal Zones: Use invalidated BOS levels as signals for possible trend reversals.
Momentum Trading: Follow confirmed BOS levels to identify areas where price momentum is likely to continue.
Dynamic Support and Resistance: Leverage the lines to identify evolving support and resistance zones.
Alerts:
Enable alerts to receive notifications when bullish or bearish trends are confirmed, allowing you to stay informed without constant monitoring.
Conceptual Basis
This script is based on the widely used market structure concept, which is fundamental to price action trading. By tracking the highs and lows created by bullish and bearish movements, the EBL script provides an objective and systematic approach to identifying and trading key structural points in the market.
With the EBL - Enhanced BOS Logic, traders can visually and systematically track market structure, identify potential trade setups, and maintain a cleaner chart with automated line and arrow management. This script is ideal for trend-following, scalping, and swing trading strategies across all markets and timeframes.
ICT SMC Custom — BOS/MSS + OB + FVGWant me to fill that box? Here’s a ready‑to‑paste description for your publish screen:
⸻
ICT SMC Custom — BOS/MSS + OB + FVG (Crypto‑friendly)
A clean Smart Money Concepts tool that marks Break of Structure (BOS), Market Structure Shift (MSS), Order Blocks (OB), and Fair Value Gaps (FVG) with bold, easy‑to‑see visuals. Built for crypto but works on any market and timeframe.
What it does
• BOS & MSS detection with optional body/wick logic
• Order Blocks: auto‑draws the last opposite candle before a BOS, keeps only the most recent N, and fades when mitigated
• FVGs: 3‑candle gaps with a minimum size filter and a cap on how many to keep
• HTF Swings (optional): plots higher‑timeframe pivot highs/lows for top‑down context
• Alerts for BOS/MSS and FVG formation
Inputs
• Swing pivot length (default 3): sensitivity for structure pivots
• Use candle bodies for breaks: close vs level (on) or wicks (off)
• Show BOS/MSS labels, Show FVG, Show Order Blocks
• Min FVG size (ticks) and Max boxes to keep for FVG/OB
• OB uses candle body: body range vs full wick range
• Show higher timeframe swings + HTF timeframe
• Bullish/Bearish colors
How it works
• BOS triggers when price breaks the last opposite swing.
• MSS flags when the break flips the prior bias.
• OB is the most recent opposite candle prior to BOS; it’s marked and later greyed out once price closes through it (mitigation).
• FVG is detected when candle 1’s high < candle 3’s low (bear) or candle 1’s low > candle 3’s high (bull).
Alerts included
• BOS Up / BOS Down
• MSS Up / MSS Down
• FVG Up / FVG Down
Tips
• Start on 15m/1h for crypto, pivot length 3–5.
• Turn Use candle bodies ON for stricter confirmations, OFF for more signals.
• If boxes look cluttered, lower “Max boxes to keep.”
Note: This is a visual/educational tool, not financial advice. Always confirm with your own plan and risk management.

Support & Resistance External/Internal & BoS [sgbpulse]Market Structure Support & Resistance External/Internal & BoS
Overview: Smart & Fast Market Structure Analysis
The Market Structure "Support & Resistance External/Internal & BoS " indicator is designed to empower your technical analysis by automatically and precisely identifying significant support and resistance levels. It achieves this by pinpointing high and low Pivot Points, plus key Pre-Market High/Low levels.
Its unique strength lies in its dynamic adaptability to any timeframe and any asset you choose. This tool analyzes the relevant market structure for the current timeframe and asset, providing you with accurate and relevant levels in real-time. The indicator maintains a clean chart and swiftly displays all support, resistance, and Pre-Market levels for any asset, saving valuable analysis time and enabling you to get a clear and quick snapshot of the market.
How the Indicator Works
The indicator identifies and displays three critical types of key levels:
External Pivots: These are more significant pivot points, indicating important reversal points across a broader range of price movement, considering the current timeframe. The indicator draws dark green support lines (for low pivots) and dark red resistance lines (for high pivots) from these points.
Internal Pivots: These are shorter-term pivot points, signifying smaller corrections or reversals within the overall structure of the current timeframe. These lines provide additional areas of interest within the ranges of the External Pivots.
Pre-Market High/Low Levels: The indicator displays the High and Low reached during pre-market hours as distinct lines on the chart. Please note: These levels will only appear when the selected timeframe is lower than one day (e.g., 1-hour, 15-minute) and provided that the "Session extended trading hours" option is enabled in your TradingView chart settings. These levels are crucial for identifying potential opening ranges and critical support/resistance areas upon regular market open, especially for intraday trading.
Break of Structure (BoS) Identification
A key feature of this indicator is its ability to identify Break of Structure (BoS). When a support or resistance line is breached, the indicator changes the line's color to gray and displays a "Break of Structure" label, indicating a potential trend change or continuation:
External BoS: When an external support/resistance line is broken, a "BoS" label in red will appear. This is a strong signal for a potential shift in the primary market structure or a strong trend continuation.
Internal BoS: When an internal support/resistance line is broken, an "iBoS" label in green will appear. This indicates a break within the existing market structure, which can be used to confirm direction or identify shorter-term entry/exit opportunities.
Full Indicator Customization
The indicator provides maximum flexibility to suit any trading style and timeframe:
Number of Lines Displayed: You can choose how many support and resistance lines you want to see on your chart. The default is 15 lines, but you can increase or decrease this number according to your needs and desired level of detail.
External Pivot Settings: Define the number of bars before and after a pivot point required for External Pivot identification.
Internal Pivot Settings: Define the number of bars before and after a pivot point required for Internal Pivot identification.
Color Customization: Full control over colors! You can change the colors of the support and resistance lines, the colors of the Pre-Market levels, and also the colors of the BoS and iBoS labels to create a visual appearance that perfectly matches your personal preferences.
This flexibility allows you to adapt the indicator to your trading style and any timeframe you operate in, without needing to manually change settings each time.
Recommended Uses
Clean Chart & Quick Analysis: The indicator displays important levels clearly, enabling quick identification of areas of interest without visual clutter on the chart. This significantly saves analysis time and allows you to make faster decisions.
Critical Levels for Any Timeframe & Asset: Get precise and adaptive support and resistance, plus essential Pre-Market levels (in relevant timeframes), for any timeframe and on any asset you choose.
Trend Direction Identification: Clear support and resistance lines help understand market structure.
Breakout Confirmation: The BoS label provides visual confirmation of key level breaches, helping to confirm potential trend changes.
Locating Entry & Exit Points: Use these levels as potential areas of interest for trades, after confirming a breakout or reversal.
Finding Stop-Loss & Take-Profit Points: Strategically place protective stops and profit targets around these support and resistance levels.
Important Note
Like any technical indicator, Market Structure "Support & Resistance External/Internal & BoS " is a supplementary tool. It's highly recommended to use it in conjunction with additional analysis methods (such as price action analysis, other indicators, and fundamental analysis) for informed trading decisions. Financial markets are dynamic, and trading always carries inherent risk.

Internal BOS X FVG Algorithms - 1 Visi TraderInternal BOS X FVG Algorithms,
This strategy is based on 2 momentum combinations:
• Internal Break of Structure was formed together with Fair Value Gap (FVG)
Formula of Internal BOS X FVG Algorithms:
1. Break (Internal BOS) X Bullish FVG = Zone for BUY Setup
2. Break (Internal BOS) X Bearish FVG = Zone for SELL Setup
// ----------- Add-ons Setting ----------- //
Setting for Internal BOS X FVG Algorithms:
---------
#1: Internal Break of Structure Settings,
• Internal Swing:
The number of left and right Swing Intervals that are checked when searching for Swing Points. More Values = Less Swing Points plotted to be potential Internal BOS and Less Values = More Swing Points plotted to be potential Internal BOS.
• Internal BOS Color:
You can change the color of dotted line and text for Internal BOS ("Break") according to your favorites layout.
#2: Fair Value Gap Settings,
• FVG Min. Range (In Pips):
Input minimum range of Fair Value Gap in Pips, more value = less zone results.
• FVG Max. Range (In Pips):
Input maximum range of Fair Value Gap in Pips, less value = less zone results.
• Extended Right - FVG:
You can change the value of extended fair value gap zone according to your best preferences.
#3: FVG Color Settings,
• Bullish FVG:
Change color FVG for Bullish Fair Value Gap Zone.
• Bearish FVG:
Change color FVG for Bearish Fair Value Gap Zone.
#4: Mode FVG,
• FVG Variations:
- Global FVG = All Variations of Fair Value Gap Category
- Specific FVG = Variation based on last of 2 FVG's Candles in same color
#5: Trading Session,
• Session Hours:
You can adjust the trading hour according to the best session and volatility of pair assets that you want to trades.
---------
How to Entry (Instructions):
1. Buy Positions = Internal BOS ("Break") form together with Bullish FVG, wait for pullback on FVG Zone and then you can open positions. Set Stop Loss (SL) below FVG Zone and set Take Profit (TP) in minimum 1:2 RR - if price hit 1:1 RR you can set Breakeven for managing the trading risk.
2. Sell Positions = Internal BOS ("Break") form together with Bearish FVG, wait for pullback on FVG Zone and then you can open positions. Set Stop Loss (SL) above FVG Zone and set Take Profit (TP) in minimum 1:2 RR - if price hit 1:1 RR you can set Breakeven for managing the trading risk.
*Notes:
The best pair asset for this strategy is on Gold (XAU/USD) at NY Sessions (19.00 - 22.00 GMT+7) - Timeframe M1 (1 Minute).
--------
Best Regards,
- 1 VISI TRADER
Trading for Prosperity!
--------
DISCLAIMER: No reselling or any other forms of use are authorized for our documents, script / strategy, and the information published with them. This informational planning script / strategy is strictly for individual use and educational purposes only. This is not financial or investment advice. Investments are always made at your own risk and are based on your personal judgement. I am not responsible for any losses you may incur. Please invest wisely.*

Enhanced BOS Strategy with SL/TP and EMA TableDescription:
The Enhanced BOS (Break of Structure) Strategy is an advanced open-source trading indicator designed to identify key market structure changes, integrated with dynamic Stop Loss (SL) and Take Profit (TP) levels, along with an informative EMA (Exponential Moving Average) table for added trend analysis.
Key Features:
Break of Structure (BOS) Detection:
The script detects bullish and bearish BOS by identifying pivot points using a custom pivot period. When the price crosses above or below these points, it signals a potential market trend reversal or continuation.
Dynamic SL/TP Levels:
Users can toggle static SL/TP settings, which automatically calculate levels based on user-defined points. These levels are visualized on the chart with dotted lines and labeled for clarity.
Volume Filters:
The strategy includes a volume condition filter to ensure that only trades within a specified volume range are considered. This helps in avoiding low-volume trades that might lead to false signals.
EMA Table Display:
An on-chart table displaying the current values of the 13-period, 50-period, and 200-period EMAs. This provides a quick reference for trend identification and confirmation, helping traders to stay aligned with the broader market trend.
How It Works:
The script utilizes a combination of moving averages and pivot points to identify potential breakouts or breakdowns in market structure. When a bullish BOS is detected, and the volume conditions are met, the strategy suggests a long position, marking potential SL/TP levels. Similarly, it suggests short positions for bearish BOS.
The EMA table serves as a visual aid, providing real-time updates of the EMA values, allowing traders to gauge the market’s directional bias quickly.
How to Use:
Setting Parameters:
Adjust the pivot period to fine-tune BOS detection according to your trading style and the asset’s volatility.
Configure the SL/TP settings based on your risk tolerance and target profit levels.
Interpreting Signals:
A “Buy” label on the chart indicates a bullish BOS with volume confirmation, signaling a potential long entry.
A “Sell” label indicates a bearish BOS with volume confirmation, signaling a potential short entry.
The EMA table aids in confirming these signals, where the position of the fast, mid, and slow EMAs can provide additional context to the trend’s strength and direction.
Volume Filtering:
Ensure your trades are filtered through the script’s volume condition, which allows for the exclusion of low-volume periods that might generate unreliable signals.
Unique Value:
Unlike many other BOS strategies, this script integrates volume conditions and a visual EMA table, providing a comprehensive toolkit for traders looking to capture market structure shifts while maintaining an eye on trend direction and trade execution precision.
Additional Information:
This script is designed for use on standard bar or candlestick charts for best results.
It is open-source and free to use, encouraging collaboration and improvement by the TradingView community.
By combining powerful trend-following EMAs with the precision of BOS detection and the safety of volume filtering, the Enhanced BOS Strategy offers a balanced approach to trading market structure changes.

SMC Structure & Expectation [WavesUnchained]SMC Structure & Expectation - Professional Context & Confirmation Tool
A sophisticated Smart Money Concepts indicator that combines objective market structure analysis with intelligent expectation logic and professional order block validation. Built for traders who value context over signal spam.
4-LAYER ARCHITECTURE
Layer 1: Market Structure
✓ Objective HH/HL/LH/LL detection based on confirmed pivot swings
✓ Internal structure tracking (micro swings within major legs)
✓ Structure alignment detection (Internal + External agreement)
✓ No predictions - pure price action description
Layer 2: Expectation/Bias
✓ Logical hypotheses derived from current structure
✓ "Expect HL" in bullish structure / "Expect LH" in bearish structure
✓ "Expect Continuation" after BOS events
✓ Expectation ≠ Signal (can be wrong, that's the point)
Layer 3: Confirmation (BOS + Order Blocks)
✓ Break of Structure (BOS) detection with 2 modes:
• Conservative: Close-cross (default)
• Aggressive: High/Low-cross with optional close confirmation
✓ Professional Order Block System with 8 intelligent filters
✓ Only creates OBs when expectation is met
✓ Maximum 1 OB per direction (quality over quantity)
Layer 4: Optional Warnings
✓ Trendline break detection
✓ Early Top/Bottom warnings (volume + volatility divergence)
✓ Can be disabled for clean chart focus
PROFESSIONAL ORDER BLOCK SYSTEM
8 Quality Filters (Cascade Logic):
1. BOS-Only Guard : No OB without confirmed Break of Structure
2. Displacement Filter : Minimum 1.0 ATR momentum (customizable)
3. Location Filter : Must be in Premium (bearish) or Discount (bullish) zone
4. Size Filter : 3 modes available:
• Hard Limit: Reject oversized OBs (strict)
• Score Penalty: Allow but reduce priority (balanced, default)
• Disabled: No size filtering (permissive)
5. Volume Filter : Optional relative volume threshold
6. FVG Filter : Optional Fair Value Gap requirement
7. Mitigation Tracking : 30% penetration = mitigated (score penalty)
8. TTL (Time-To-Live) : Auto-delete after 80 bars (prevents chart clutter)
Priority Scoring System (0-100):
• HIGH Priority (>80) : Bright colors, zero transparency
• MED Priority (50-80) : Normal colors, 30% transparency
• LOW Priority (<50) : Faded colors, 60% transparency
Score Components:
✓ Displacement strength (10-30 points)
✓ FVG confluence (+20 points)
✓ Relative volume (+5-15 points)
✓ Premium/Discount location (+10-20 points)
✓ Structure alignment (+30 points if aligned, -15 if conflict)
✓ Leg strength (+15-25 points for strong impulse vs correction ratio)
✓ Size penalty (-0 to -30 points if oversized, Score Penalty mode only)
BAR COLORING MODES
Choose your preferred visual feedback:
1. Off : No bar coloring
2. Structure : Bullish/Bearish/Neutral structure states
3. Expectation : Continuation zones (green = expect bullish, red = expect bearish)
4. BOS + OB Priority (Default):
• Highlights active Order Blocks by priority
• BOS events in bright neon
• Faded structure colors when no OB active
5. Multi-Layer : Combines structure + priority intensity
6. Alignment : Shows Internal/External structure alignment (orange = conflict warning)
INTELLIGENT LOGGING SYSTEM
Priority-based log filtering to reduce noise:
• All : Every event (debug mode)
• MED+ : Only medium and high priority events
• HIGH Only : Only high priority setups
• Smart (Default): Adaptive filtering based on priority + context
Logs include:
✓ Structure changes (HH/HL/LH/LL)
✓ Expectation updates
✓ BOS events with confirmation status
✓ OB creation with full scoring breakdown
✓ OB reactions (Tap/Deep/Failure classification)
✓ Rejection reasons with "Potential Lost" analysis
CONFIGURATION HIGHLIGHTS
Layer 1: Structure
• Pivot detection length: 5 (left) / 5 (right)
• Internal structure: Optional micro-swing tracking
• Swing confirmation: Closes beyond pivot required
Layer 2: Expectation
• Expectation expiry: 40 bars (auto-reset after timeout)
• Visual feedback: Labels + optional expectation zones
Layer 3: Confirmation
• BOS Mode: Close-cross (conservative) / High/Low-cross (aggressive)
• Close Confirmation: Optional 3-bar window for aggro mode
• Displacement: Min 1.0 ATR (customizable)
• Size Filter Mode: Hard Limit / Score Penalty / Disabled
• OB Location: 38% discount / 62% premium thresholds
• OB Size Range: 0.3-1.2 ATR (customizable)
• TTL: 80 bars default
• Volume Filter: Optional, 1.0x minimum
• FVG Requirement: Optional
Layer 4: Warnings
• Trendline break detection
• Early Top/Bottom signals
• Can be fully disabled
BEST USE CASES
✓ Context Tool : Understand where you are in the market cycle
✓ Confirmation Filter : Validate trade ideas with structure alignment
✓ Order Block Trading : High-probability zones with priority scoring
✓ Educational : Learn SMC concepts with transparent logic
✓ Multi-Timeframe Analysis : Combine with HTF structure for confluence
Optimized for:
• Commodities (NatGas, Gold, Oil)
• 1H - 4H timeframes
• Swing trading / Intraday positioning
KEY FEATURES SUMMARY
✓ Zero signal spam - only high-conviction setups
✓ Transparent scoring system - know why each OB matters
✓ Adaptive to market conditions - structure alignment detection
✓ Flexible filtering - customize to your risk tolerance
✓ Priority-based visuals - instantly identify best opportunities
✓ Professional logging - learn from rejections and acceptances
✓ Clean chart - auto-cleanup with TTL system
✓ Bar coloring modes - choose your visual feedback style
✓ Size Filter Mode - prevent blocking of high-quality oversized setups
PHILOSOPHY
This indicator follows the principle: "Context over signals, quality over quantity"
Expectations can be wrong - that's the point. They help you stay aware of the most likely scenario while remaining open to structure changes. When expectation is met AND confirmed by BOS + quality OB, you get a high-conviction setup.
Not a holy grail. Not a signal service. A professional analysis tool.
Version: 1.0.0
Author: WavesUnchained
Pine Script: v6

VCAI BOS-Zone PROVCAI BOS-Zone PRO is a structure-driven order-block mapper that tracks swing highs/lows, detects Break of Structure (BOS), and automatically draws clean bullish and bearish OB zones with midlines and directional flags.
It provides a clear, rules-based map of where structural shifts occurred and where price may react on future retests.
What it does:
Uses configurable swing pivots to define structure.
A bullish BOS is triggered when price closes above the last swing high;
a bearish BOS when price closes below the last swing low.
After each BOS, the script finds the last opposite candle (bearish before a bullish BOS, bullish before a bearish BOS) and builds an order-block zone from that candle’s high/low.
Each zone is projected a fixed number of bars into the future, keeping charts clean and preventing zones from extending into the price scale.
Only the latest N bullish and N bearish zones are kept, so the chart focuses on the most relevant active levels.
How to read it:
Yellow boxes + BULL flags = bullish demand zones.
Purple boxes + BEAR flags = bearish supply zones.
The edges of each zone act as potential support/resistance.
Reactions inside a yellow zone suggest buy-side interest;
rejection at a purple zone suggests sell-side pressure.
Optional midlines mark the 50% level of each zone, commonly used for refined entries, mitigations, and partial management.
How traders typically use it:
BOS-Zone PRO does not generate buy/sell alerts, but many traders use the zones as part of a broader decision process:
Bullish zones are often monitored for long setups when price returns and shows strength or continuation.
Bearish zones are often monitored for short setups when price retests and shows rejection or weakness.
Midlines provide refined entry levels with clearer invalidation points.
This tool is best used as structural context alongside your own entry model, risk settings, and trade management.
Notes & best practices:
BOS is directional, not predictive — treat zones as context, not guaranteed reversals.
Works on all symbols and timeframes.
Lower swing settings capture local structure; higher settings focus on major breaks and cleaner OB's.
Ideal as a structural map for discretionary traders or as a component inside automated systems.
Part of the VCAI toolset.
We develop a range of market-structure, volume, trend and liquidity tools designed to work together or stand alone.

Golden BOS Strategy - ChecklistA clean, mechanical on-chart checklist designed for multi-timeframe traders using the Golden BOS / Institutional Retracement Framework.
This tool helps you stay disciplined by tracking each requirement of the strategy in real time:
Included Criteria
4H Bias: Bullish or bearish macro structure
1H Structure: Push/pull phase + golden zone retracement
5M Entry Model:
Break of Structure (BOS)
5M golden zone retracement
POI validation (OB/FVG/Breaker)
Final micro BOS or rejection confirmation
Risk Filters:
Session validity (London / NY)
Red news avoidance
Stop-loss placement check
Liquidity-based target confirmation
Purpose
This overlay ensures every trade meets strict criteria before execution, removing emotion and improvisation. Ideal for backtesting, forward testing, and staying consistent during live market conditions.
Golden BOS Strategy — Description
The Golden BOS Strategy is a structured, multi-timeframe trading system designed to capture high-probability continuation moves during London and New York sessions. The strategy combines institutional concepts with Fibonacci-based retracements to identify discounted entry zones aligned with higher-timeframe direction.
Using the 4H timeframe, traders establish the daily macro bias and identify the dominant trend. The 1H chart is then used to confirm the current phase of market structure, distinguishing between impulsive “push” moves and corrective “pullback” phases. A Fibonacci retracement is applied to the most recent 1H impulse leg to define a high-value discount or premium zone where entries become valid.
Execution takes place on the 5-minute chart. Once price reaches the 1H golden zone (61.8–78.6%), a Break of Structure (BOS) is required to confirm a shift in short-term momentum. A second Fibonacci retracement is then drawn on the 5M impulse leg that caused the BOS, and price must retrace back into the 5M golden zone. Traders refine their entry using a confluence point of interest (POI) such as a Fair Value Gap (FVG), Order Block, Breaker Block, or Inverse FVG, ideally accompanied by a final micro BOS or rejection candle.
Risk management is strict and rule-driven. Stop loss is placed beyond the extreme wick of the POI, while take-profit targets are set at logical liquidity pools in the direction of the higher-timeframe trend. The strategy avoids red-folder news and only allows trades during active sessions to ensure optimal volatility and reliability.
The Golden BOS Strategy is designed to impose discipline, reduce discretionary errors, and give traders a repeatable, mechanical framework for navigating trending markets with precision.

Liquidity Sweep + BOS Retest System — Prop Firm Edition🟦 Liquidity Sweep + BOS Retest System — Prop Firm Edition
A High-Probability Smart Money Strategy Built for NQ, ES, and Funding Accounts
🚀 Overview
The Liquidity Sweep + BOS Retest System (Prop Firm Edition) is a precision-engineered SMC strategy built specifically for prop firm traders. It mirrors institutional liquidity behavior and combines it with strict account-safe entry rules to help traders pass and maintain funding accounts with consistency.
Unlike typical indicators, this system waits for three confirmations — liquidity sweep, displacement, and a clean retest — before executing any trade. Every component is optimized for low drawdown, high R:R, and prop-firm-approved risk management.
Whether you’re trading Apex, TakeProfitTrader, FFF, or OneUp Trader, this system gives you a powerful mechanical framework that keeps you within rules while identifying the market’s highest-probability reversal zones.
🔥 Key Features
1. Liquidity Sweep Detection (Stop Hunt Logic)
Automatically identifies when price clears a previous swing high/low with a sweep confirmation candle.
✔ Filters noise
✔ Eliminates early entries
✔ Locks onto true liquidity grabs
2. Automatic Break of Structure (BOS) Confirmation
Price must show true displacement by breaking structure opposite the sweep direction.
✔ Confirms momentum shift
✔ Removes fake reversals
✔ Ensures institutional intent
3. Precision Retest Entry Model
The strategy enters only when price retests the BOS level at premium/discount pricing.
✔ Zero chasing
✔ Extremely tight stop loss placement
✔ Prop-firm-friendly controlled risk
4. Built-In Risk & Trade Management
SL set at swept liquidity
TP set by user-defined R:R multiplier
Optional session filter (NY Open by default)
One trade at a time (no pyramiding)
Automatically resets logic after each trade
This prevents overtrading — the #1 cause of evaluation and account breaches.
5. Designed for Prop Firm Futures Trading
This script is optimized for:
Trailing/static drawdown accounts
Micro contract precision
Funding evaluations
Low-risk, high-probability setups
Structured, rule-based execution
It reduces randomness and emotional trading by automating the highest-quality SMC sequence.
🎯 The Trading Model Behind the System
Step 1 — Liquidity Sweep
Price must take out a recent high/low and close back inside structure.
This confirms stop-hunting behavior and marks the beginning of a potential reversal.
Step 2 — BOS (Break of Structure)
Price must break the opposite side swing with a displacement candle. This validates a directional shift.
Step 3 — Retest Entry
The system waits for price to retrace into the BOS level and signal continuation.
This creates optimal R:R entry with minimal drawdown.
📈 Best Markets
NQ (NASDAQ Futures) – Highly recommended
ES, YM, RTY
Gold (XAUUSD)
FX majors
Crypto (with high volatility)
Works best on 1m, 2m, 5m, or 15m depending on your trading style.
🧠 Why Traders Love This System
✔ No signals until all confirmations align
✔ Reduces overtrading and emotional decisions
✔ Follows market structure instead of random indicators
✔ Perfect for maintaining long-term funded accounts
✔ Built around institutional-grade concepts
✔ Makes your trading consistent, calm, and rules-based
⚙️ Recommended Settings
Session: 06:30–08:00 MST (NY Open)
R:R: 1.5R – 3R
Contracts: Start with 1–2 micros
Markets: NQ for best structure & volume
📦 What’s Included
Complete strategy logic
All plots, labels, sweep markers & BOS alerts
BOS retest entry automation
Session filtering
Stop loss & take profit system
Full SMC logic pipeline
🏁 Summary
The Liquidity Sweep + BOS Retest System is a complete, prop-firm-ready, structure-based strategy that automates one of the cleanest and most reliable SMC entry models. It is designed to keep you safe, consistent, and rule-compliant while capturing premium institutional setups.
If you want to trade with confidence, discipline, and prop-firm precision — this system is for you.
Good Luck -BG

EBL - Enigma BOS Logic Select Higher Time FrameThe "EBL – Enigma BOS Logic" is a unique multi-timeframe trading indicator designed for traders who rely on structured price action and key level retests to find high-probability trade opportunities. This indicator automates the identification of significant price levels on a higher timeframe, plots them across all lower timeframes, and provides actionable signals (buy/sell) when price retests those levels. It is ideal for traders who focus on lower timeframes for precise entries while using higher timeframe structure for trend confirmation.
How the Indicator Works
Key Level Detection:
The indicator allows the user to select a key level timeframe (e.g., 1H, 4H, Daily, Weekly). It then identifies Break of Structure (BOS) levels on the selected timeframe.
When a bullish-to-bearish or bearish-to-bullish reversal is detected on the selected timeframe, the corresponding high or low of the reversal candle is stored as a key level.
These key levels are plotted as horizontal lines on all lower timeframes, helping the trader visualize critical support and resistance zones across multiple timeframes.
Retest Confirmation:
Once a key level is established, the indicator continuously monitors the price action on lower timeframes.
If the price touches or crosses a key level, it is considered a retest, and an alert is generated.
The indicator plots a retest marker (customizable as a circle or diamond) at the exact price level where the retest occurred, providing a clear visual cue for the trader.
Trading Signals:
When a retest is detected, a table is displayed on the chart with the following information:
The trading pair.
The signal direction (Buy/Sell).
The price at which the retest occurred.
This table gives traders instant insight into actionable opportunities, making it easier to focus on live market conditions without missing critical retests.
Key Features
Multi-Timeframe Analysis: The indicator focuses on a higher timeframe selected by the user, ensuring that only the most relevant key levels are plotted for lower timeframe trading.
Dynamic Retest Signals: It dynamically identifies when price retests a key level and provides both visual markers and real-time alerts.
Customizable Retest Markers: Users can customize the retest marker's shape (circle/diamond) and color to suit their preferences.
Signal Table: A built-in table displays clear buy or sell signals when retests occur, ensuring that traders have all the necessary information at a glance.
Alerts: The indicator supports real-time alerts for retests, helping traders stay informed even when they are not actively monitoring the chart.
How to Use the Indicator
Select a Key Level Timeframe:
In the input settings, choose a higher timeframe (e.g., 4H or Daily) to define key levels.
The indicator will calculate Break of Structure (BOS) levels on the selected timeframe and plot them as horizontal lines across all lower timeframes.
Monitor Lower Timeframes for Retests:
Switch to a lower timeframe (e.g., 15m, 5m) to wait for price to approach the key levels plotted by the indicator.
When a retest occurs, observe the signal table and retest marker for actionable trade signals.
Act on Buy/Sell Signals:
Use the information provided by the signal table to make trading decisions.
For a buy signal, wait for bullish confirmation (e.g., price holding above the retested level).
For a sell signal, wait for bearish confirmation (e.g., price holding below the retested level).
Trading Concepts and Underlying Logic
The indicator is based on the Break of Structure (BOS) concept, a core principle in price action trading. BOS levels represent points where the market shifts its trend direction, making them critical zones for potential reversals or continuations.
By focusing on higher timeframe BOS levels, the indicator helps traders align their lower timeframe entries with the overall market trend.
The concept of retests is used to confirm the validity of a key level. A retest occurs when the price returns to a previously identified BOS level, offering a high-probability entry point.
Use Cases
Scalping: Traders who prefer lower timeframe scalping can use the indicator to align their trades with higher timeframe key levels, increasing the likelihood of successful trades.
Swing Trading: Swing traders can use the indicator to identify key reversal zones on higher timeframes and plan their trades accordingly.
Intraday Trading: Intraday traders can benefit from the real-time alerts and signals generated by the indicator, ensuring they never miss critical retests during active trading hours.
Conclusion
The "EBL – Enigma BOS Logic" is a powerful tool for traders who want to enhance their price action trading by focusing on key levels and retests across multiple timeframes. By automating the identification of BOS levels and providing clear retest signals, it helps traders make more informed and confident trading decisions. Whether you are a scalper, intraday trader, or swing trader, this indicator offers valuable insights to improve your trading performance.

FTR Rules BoS/ChoCh MarkupThis indicator marks Break of Structure (BoS) and Change of Character (ChoCh) in the price structure on your charts. It runs on any timeframe. This indicator is useful for determining if you are seeing a trend change in the market or if you are only seeing a pullback with the market continuing in the direction of the trend. The indicator will look for price to break the previous BoS line or ChoCh line to mark a new BoS. When a BoS line is broken, it will then look for the lowest or highest pullback (depending on which way the market is trending) between to 2 BoS lines to mark the ChoCh line. When the ChoCh line is broken, it will mark that line as BoS and the previous BoS line will become ChoCh.
What makes this indicator unique from other BoS and ChoCh indicators is that it follows specific rules used by the FTR Trading group. The main difference is that the ChoCh line isn't changed to a BoS line from only a candle wick break. You will need a candle body break to move your BoS line to ChoCh. If a candle wick breaks your ChoCh line, you simply extend the ChoCh line to the new high or low of the wick. There are smaller differences that are proprietary to the FTR strategy.

Thunderbird BoSThe Thunderbird BoS script is meticulously crafted for those who thrive on higher timeframes (daily, weekly, monthly) and aim to capture the significant moves and trends in the market.
What does the Thunderbird BoS script do?
Breakouts are pivotal moments in investing, and the Thunderbird BoS script is your ally in identifying them. Here's how:
Breakout Detection: The script springs into action when there's a breakout of a specific Donchian setting, producing a signal.
Visual Aids: It doesn't just stop at signals. The script visually displays entry, stop, and compound levels right on your chart. This feature is especially handy when you hover over a bar, as it allows you to see levels from past signals, no matter how far back in time.
Trend Confirmation: The script is adept at producing entry signals in both confirmed bull and bear trends.
Filtering the Noise: Using the Donchian logic, the script confirms end-of-day entry points in a long-term trend and efficiently filters out fake breakouts and entry points in a sideways market.
How does BoS work?
The BoS is a product of meticulous calculations:
Breakout Signal: Upon detecting a breakout signal, the entry-level is determined. For a bullish breakout, it's calculated a specific % above the high, and for a bearish breakout, a specific % below.
Stop Calculation: Using the Average True Range (ATR) over a number of specific days, the stop loss is set below the entry for long positions and above for short positions.
Compound Levels: The compound level is also determined using an ATR formula above the entry for long positions and below for short ones.
What's the ideal timeframe for this script?
The Thunderbird BoS script is tailor-made for the daily timeframe. This ensures that breakout signals are derived from a comprehensive view of the market's movements.
What sets the Thunderbird BoS script apart?
The uniqueness of the Thunderbird BoS script lies in its:
Historical Insight: The ability to view levels from past signals by simply hovering over a bar. This feature aids in analysing entry levels from any point in the past and is displayed seamlessly in the data window.
Precision for Daily Timeframe: The script is specifically coded for the daily timeframe to:
Pinpoint the onset of potential long-term trends.
Confirm entry points at the end of the trading day, effectively filtering out intraday distractions.
Minimise the chances of fake breakouts in a trend.
Continuously generate entry points as the trend evolves, facilitating compounding.
Efficiently filter out breakouts in a sideways market.
In essence, the Thunderbird BoS script is an investor's tool for focusing on the quality of potential positions when investing in long-term market trends. It's not just about identifying trends; it's about making informed decisions based on them.

Market Structure Report Library [TradingFinder]🔵 Introduction
Market Structure is one of the most fundamental concepts in Price Action and Smart Money theory. In simple terms, it represents how price moves between highs and lows and reveals which phase of the market cycle we are currently in uptrend, downtrend, or transition.
Each structure in the market is formed by a combination of Breaks of Structure (BoS) and Changes of Character (CHoCH) :
BoS occurs when the market breaks a previous high or low, confirming the continuation of the current trend.
CHoCH occurs when price breaks in the opposite direction for the first time, signaling a potential trend reversal.
Since price movement is inherently fractal, market structure can be analyzed on two distinct levels :
Major / External Structure: represents the dominant macro trend.
Minor / Internal Structure: represents corrective or smaller-scale movements within the larger trend.
🔵 Library Purpose
The “Market Structure Report Library” is designed to automatically detect the current market structure type in real time.
Without drawing or displaying any visuals, it analyzes raw price data and returns a series of logical and textual outputs (Return Values) that describe the current structural state of the market.
It provides the following information :
Trend Type :
External Trend (Major): Up Trend, Down Trend, No Trend
Internal Trend (Minor): Up Trend, Down Trend, No Trend
Structure Type :
BoS : Confirms trend continuation
CHoCH : Indicates a potential trend reversal
Consecutive BoS Counter : Measures trend strength on both Major and Minor levels.
Candle Type : Returns the current candle’s condition(Bullish, Bearish, Doji)
This library is specifically designed for use in Smart Money–based screeners, indicators, and algorithmic strategies.
It can analyze multiple symbols and timeframes simultaneously and return the exact structure type (BoS or CHoCH) and trend direction for each.
🔵 Function Outputs
The function MS() processes the price data and returns seven key outputs,
each representing a distinct structural state of the market. These values can be used in indicators, strategies, or multi-symbol screeners.
🟣 ExternalTrend
Type : string
Description : Represents the direction of the Major (External) market structure.
Possible values :
Up Trend
Down Trend
No Trend
This is determined based on the behavior of Major Pivots (swing highs/lows).
🟣 InternalTrend
Type : string
Description : Represents the direction of the Minor (Internal) market structure.
Possible values :
Up Trend
Down Trend
No Trend
🟣 M_State
Type : string
Description : Specifies the type of the latest Major Structure event.
Possible values :
BoS
CHoCH
🟣 m_State
Type : string
Description : Specifies the type of the latest Minor Structure event.
Possible values :
BoS
CHoCH
🟣 MBoS_Counter
Type : integer
Description : Counts the number of consecutive structural breaks (BoS) in the Major structure.
Useful for evaluating trend strength :
Increasing count: indicates trend continuation.
Reset to zero: typically occurs after a CHoCH.
🟣 mBoS_Counter
Type : integer
Description : Counts the number of consecutive structural breaks in the Minor structure.
Helps analyze the micro structure of the market on lower timeframes.
Higher value : strong internal trend.
Reset : indicates a minor pullback or reversal.
🟣 Candle_Type
Type : string
Description : Represents the type of the current candle.
Possible values :
Bullish
Bearish
Doji
import TFlab/Market_Structure_Report_Library_TradingFinder/1 as MSS
PP = input.int (5 , 'Market Structure Pivot Period' , group = 'Symbol 1' )
= MSS.MS(PP)

Minor Break of Structure (Minor BoS)This indicator extracts and isolates the Minor Break of Structure (BoS) logic from a full SMC framework and presents it as a clean, lightweight tool for structure-based price action traders.
Unlike traditional BOS indicators that rely on swing calculations with heavy filtering, this script uses original SMC-style minor structure logic to detect meaningful shifts in internal order flow.
A Minor BoS appears when price breaks above a minor swing high (bullish) or below a minor swing low (bearish), confirming a short-term continuation in trend direction.
Features:
Bullish Minor BoS detection
Bearish Minor BoS detection
Automatic line plotting with extend-right
Clear “Minor BoS” label with tiny footprint
Customizable line styles and colors
Lightweight & optimized for fast execution
Zero repainting on BoS confirmations
This tool is ideal for traders who want a simple, clean, and reliable structure-based signal without the noise of major structure, order blocks, liquidity sweeps, or external SMC modules.

Scalper Pro Pattern Recognition & Price Action📘 Scalper Pro Pattern Recognition & Price Action
Overview
Scalper Pro is a dynamic multi-layer trend recognition and price action strategy that integrates Supertrend, Smart Money Concepts (SMC), and volatility-based risk control.
It adapts to market volatility in real time to enhance entry precision and optimize risk.
⚠️ This script is for educational and research purposes only.
Past performance does not guarantee future results.
🎯 Strategy Objectives
Detect structural market shifts (BOS / CHoCH) automatically.
Identify Order Blocks (OB), Fair Value Gaps (FVG), and key liquidity zones.
Plot dynamic Take-Profit (TP) and Stop-Loss (SL) levels based on ATR.
Avoid low-volatility (sideways) conditions using ADX filtering.
Combine trend-following signals with structural confirmation.
✨ Key Features
Supertrend Entry Signals — Generates precise buy/sell markers based on price crossovers with the Supertrend line.
Order Block Detection — Automatically plots both Internal and Swing Order Blocks for smart money insights.
Fair Value Gap Visualization — Highlights inefficiency zones in bullish or bearish structures.
Market Structure Labels — Marks Break of Structure (BOS) and Change of Character (CHoCH) points for clear trend shifts.
Dynamic Risk Levels — Automatically generates TP/SL lines and price labels using ATR-based distance.
📊 Trading Rules
Long Entry:
• Price crosses above the Supertrend (ta.crossover(close, supertrend))
• ADX above sideways threshold (trend condition confirmed)
• Optional confirmation from a bullish BOS or CHoCH
Short Entry:
• Price crosses below the Supertrend (ta.crossunder(close, supertrend))
• ADX above threshold
• Optional confirmation from a bearish BOS or CHoCH
Exit (or Reverse):
• Opposite Supertrend crossover
• Price hits TP/SL lines
• Trend shift confirmed by internal BOS/CHoCH
💰 Risk Management Parameters
Stop Loss & Take Profit based on ATR × risk multiplier
ATR Length: 14 (default)
Risk %: 3% per trade
Sideways Filter: ADX < 15 → no trade zone
TP1–TP3 = Entry ± (ATR × 1~3)
⚙️ Indicator Settings
Supertrend Module:
ATR Length: 10
Factor: nsensitivity × 7
ADX Module:
ADX Length: 15
Sideways Threshold: 15
EMA Set:
EMA (5, 9, 13, 34, 50) × Volatility Factor (3)
SMA Filter:
SMA(8) & SMA(9) for short-term trend confirmation
Smart Money Concepts Module:
Displays BOS/CHoCH, Order Blocks, FVGs, Equal Highs/Lows, and Premium/Discount zones
🔧 Improvements & Uniqueness
Integrates Supertrend momentum with Smart Money Concepts (SMC) structural analysis.
Dual detection layers: Internal (micro) and Swing (macro) structures.
ATR-driven auto labeling for entry, stop, and profit targets.
Premium/Discount and Equilibrium zones visualized on the chart.
Built-in ADX filter to skip low-trend market conditions.
✅ Summary
Scalper Pro Pattern Recognition & Price Action merges classical trend-following with modern market structure analytics.
It combines momentum detection, volatility control, and smart money mapping into one cohesive framework.
Unified trend, structure, and risk visualization.
Auto-marked BOS/CHoCH, OB, FVG, and liquidity zones.
Usable for scalping, intraday, or swing trading setups.
⚠️ This strategy is based on historical data and designed for educational use only.
Always apply sound risk management and forward testing before live trading.

Market Structure (BOS on Break, HH/HL/LH/LL)Market Structure (BOS on Break, HH/HL/LH/LL) is a clean and reactive market structure tool designed for traders who want clear visual feedback of trend direction and structure changes.
It automatically identifies:
Higher Highs (HH)
Higher Lows (HL)
Lower Highs (LH)
Lower Lows (LL)
Breaks of Structure (BOS) when price breaches previous swing levels.
✳️ Features
Automatic Structure Detection: Detects swing highs/lows based on your left/right pivot settings.
Break of Structure Alerts: Instantly updates bias when price breaks a previous swing level (no delay).
Real-Time BOS Response: Structure flips as soon as price takes out the previous high or low.
Color-Coded Bars: Bars can auto-paint white for bullish and black for bearish conditions.
Optional Fading Dots: Visual fading dots track trend duration and strength for quick bias reading.
Customizable Pivots: Choose how many bars to use for left/right swing confirmation.
Alerts: Fully configured for HH, HL, LH, LL, BOS Up, and BOS Down events.
⚙️ Inputs
Left Pivot Bars / Right Pivot Bars: Control how many candles define a valid swing point.
Paint Bars by Trend: Toggle bar coloring to match bullish or bearish bias.
Show Fading Trend Dots: Add fading dots that shrink and fade as a trend matures.
🔔 Alerts
Break of Structure Up / Down
Higher High (HH) confirmed
Higher Low (HL) confirmed
Lower High (LH) confirmed
Lower Low (LL) confirmed
🎯 Use Case
Perfect for:
Price action traders
Smart money concept (SMC) practitioners
Trend structure analysts
Scalpers and swing traders looking for quick structure flips.
🧠 Notes
Works on any timeframe and any instrument.
BOS signals update immediately when price breaks structure (no lag).
For additional BOS markers, you can uncomment the last few lines in the script to show arrows when structure breaks.

Order Block with BoSHere’s a professional and concise description you can use for publishing your **TradingView script** titled **"Order Block with BoS"**:
---
### 📌 **Description for TradingView Publication:**
**"Order Block with Break of Structure (BoS)"** is a powerful price action-based indicator designed to identify potential reversal zones and momentum shifts using **Order Block** detection combined with **Break of Structure (BoS)** confirmation.
### 🔍 **Key Features:**
* **Order Block Detection**: Highlights bullish and bearish order blocks using precise candle structure logic.
* **Break of Structure (BoS)**: Confirms structural breaks above swing highs or below swing lows to validate potential trend continuation or reversal.
* **Dynamic ATR Filter**: Uses a 14-period ATR with dynamic thresholds to confirm significant moves, filtering out weak breakouts.
* **Visual Aids**:
* Color-coded **boxes** to mark detected Order Blocks.
* **Arrows** at BoS confirmation points when ATR confirms strong momentum.
* Optional **dashed BoS lines** to show where price broke structure.
### ⚙️ **Customizable Inputs**:
* `Swing Length`: Defines the sensitivity of swing high/low detection.
* `Show Break of Structure`: Toggle on/off BoS confirmation lines.
* `Candle Lookback`: Number of historical candles to consider.
This indicator is ideal for traders who incorporate **smart money concepts**, **market structure analysis**, or **institutional order flow** strategies.
---
Would you like me to help write the **strategy** version of this or translate the description into another language for international audiences?

Dynamic Market Structure DetectorTitle: Dynamic Market Structure Detector – Real-Time BoS & ChoCH Signals
Short Description:
Identify market structure dynamically with real-time Break of Structure (BoS) and Change of Character (ChoCH) signals. Highlight untested support and resistance zones to improve trading precision.
Full Description:
The Dynamic Market Structure Detector is a powerful TradingView indicator designed for traders who want to automate the identification of key market structure levels. This indicator simplifies market analysis by dynamically tracking swing highs and lows, marking critical Break of Structure (BoS) and Change of Character (ChoCH) points, and highlighting untested support and resistance zones.
Key Features:
1. Real-Time Signals:
• Marks Break of Structure (BoS) and Change of Character (ChoCH) points as they occur.
• Automatically updates as the market evolves.
2. Dynamic Swing Highs and Lows:
• Tracks swing highs and lows based on user-defined sensitivity (Swing Length).
• Adjust swing length to tailor signals for intraday or swing trading.
3. Untested Zones Highlight:
• Visualize untested support and resistance zones dynamically.
• Opacity settings allow customization for better chart readability.
4. Customizable Inputs:
• Swing Length:
Adjust the sensitivity of BoS and ChoCH signals.
• Smaller Swing Length values (e.g., 3–5): Capture short-term market movements, ideal for intraday trading.
• Larger Swing Length values (e.g., 10–20): Focus on significant market structure changes for swing or positional trading.
Experiment with these values to find the best fit for your trading style.
• Untested Zone Opacity:
Control the visibility of highlighted support and resistance zones.
• Lower opacity values (e.g., 10–50): Make the zones more prominent, helpful for darker chart backgrounds.
• Higher opacity values (e.g., 70–90): Provide subtle highlights, better suited for lighter chart setups.
• A value of 100% renders the zones completely transparent (invisible).
Use this setting to customize the visual appearance of your chart while still retaining key zone information.
5. User-Friendly Visualization:
• Color-coded labels for BoS (Green) and ChoCH (Red).
• Highlight zones for untested areas using customizable colors (Support: Blue, Resistance: Orange).
Why Use This Indicator?
• Simplifies market structure analysis by automating key calculations.
• Helps traders identify potential trend reversals and continuation points.
• Reduces the need for manual charting, saving time and effort.
• Provides visual clarity on untested zones for better decision-making.
Recommended Usage:
• Intraday Traders: Use smaller Swing Length values (e.g., 3–5) to capture short-term market movements.
• Swing Traders: Opt for higher Swing Length values (e.g., 10–20) to focus on larger market structure changes.
• Monitor untested zones for potential price reactions, enhancing your trade entries and exits.
Notes :
This indicator is best suited for traders who prefer price action trading and market structure analysis. While the indicator provides reliable insights, it is recommended to use it in conjunction with other analysis tools for a holistic trading approach.
Credits:
Developed by TradeTech Analysis to empower traders with automated tools for smarter trading decisions.

Price Action Trader [BackQuant]Price Action Trader
Introduction
Price Action Trader is an all-in-one, chart-side workflow for reading trend, timing impulses, and mapping high-probability zones the way discretionary traders actually trade. It blends an ensemble trend engine with clean price-action building blocks—Market Structure (BOS/MSB), Fair Value Gaps, Order Blocks, and Volumetric Support/Resistance—so you can form a bias, find confluence, and execute with context.
What is it
A modular “price-action stack” that:
Paints trend bias and impulse shifts on the chart (optional candle coloring).
Auto-annotates internal & swing structure (BOS / MSB).
Finds FVGs on your chosen timeframe and draws them cleanly.
Detects Order Blocks (with optional FVG confirmation).
Builds volumetric S/R levels that adapt to liquidity.
Emits alerts for key events (new levels, touches, breaks, OB creation/touch).
Everything is configurable—keep it minimal (trend + a few zones) or run the full toolkit.
What’s it used for
Bias first, trade second: establish direction/conviction, then execute where structure, gaps, blocks, and volume agree.
Timing: impulse flips and level touches provide actionable triggers.
Risk placement: OB edges, FVG midlines, and volumetric bands give logical stop/target references.
Review & journaling: optional session shading and labeled structures make post-trade notes simple.
Composite Trend Model
A lightweight signal line (default: 30-period) that turns green when the composite regime is bullish and red when bearish. Under the hood, multiple cues (adaptive momentum, de-noised oscillation, volatility-aware filters) are blended into a single directional score; when thresholds flip, the line recolors and optional Long/Short dots appear.
How to use
Treat the line as your bias rail : favor longs while green, shorts while red.
Flat/rapid flips = stand down or reduce size.
Prefer clean charts? Keep only the line and (optionally) trend-painted candles.
Inputs to know
Show Trend Signal Line / Width.
Paint Candles by Trend.
Long/Bearish color controls.
Impulse Model
Highlights short-term pressure shifts with optional impulse candle coloring and ▲/▼ markers. Great for entries in the prevailing trend and for early warnings when impulses fire against bias.
How to use
Up-bias: look for the next impulse-up near structure/FVG/OB or volumetric support.
Down-bias: mirror the logic.
Frequent counter-impulses → expect chop or regime change.
Inputs to know
Show Impulse Signals.
Paint Impulse Candles.
Market Structure
Automatic Internal (tight lookback) and Swing (wider lookback) structure with BOS and MSB (CHoCH) labels. You decide what to show—All, BOS only, MSB only—independently for internal vs swing.
How to use
Use Swing labels for the primary map; Internal for entry refinement.
After a bullish MSB , seek the first HL back into support/FVG/OB.
After a bearish BOS , favor LH fades into resistance/FVG/OB.
Inputs to know
Swing Lookback / Internal Lookback.
Swing/Internal Structure: All | BOS | MSB | None .
Separate bull/bear color controls for both layers.
Fair Value Gaps
Detects bullish/bearish FVGs on the current or higher TF, draws boxes, and can extend them forward. Midlines provide quick visual targeting.
How to use
In-trend fills: in an up-bias, tags of bullish FVGs often offer high-quality continuation entries, especially with structure/OB confluence.
Failed fills: rejections at the midline can signal emerging strength/weakness.
Inputs to know
Show FVG / Show Last N / Extend.
Timeframe (blank = chart TF; set higher TF for macro FVGs).
Bull/Bear colors (tune opacity to taste).
Volumetric Support and Resistance
Builds adaptive S/R from price interaction + relative volume over a rolling lookback. Levels store touch counts; you can show volume stats on labels or inside boxes. Transparency and border thickness can scale with volume so stronger levels are visually louder. Broken levels can auto-remove.
How to use
Use as confluence with structure, OBs, and FVGs. A long at volumetric support + Bull OB + FVG midline is qualitatively different from a naked level.
If a level breaks on strong volume, stop fading—flip expectations or wait for a clean retest.
Inputs to know
Detection Sensitivity / Volume Multiplier.
Analysis Period / Max Levels / Min Distance (%).
Remove Broken / Extend Right / Show Volume Info / Text Inside.
Support/Resistance colors (+ high-vol variants).
Alerts
New Support/Resistance Level Created.
Level Touch.
Level Break.
Order Blocks
Detects bullish/bearish OBs using configurable fractals (3- or 5-bar) with a break confirmation (by Close or High/Low). Optional FVG proximity filter, right-extension, and auto-delete when filled.
How to use
Bullish bias: stalk pullbacks into fresh Bull OBs aligned with a bullish FVG or volumetric support.
If price fills an opposing OB and fails to continue, reassess bias—context may be shifting.
Inputs to know
Fractal Type & Break Method (Close / HL).
Filter with FVG + Max FVG Distance.
Extend Blocks / Delete When Filled / Show Labels.
Alerts
New Order Block Created.
Order Block Touch.
Final Notes
Suggested workflow
Start with Composite Trend (bias).
Mark Swing structure in that direction.
Wait for an Impulse in-direction near an OB / FVG / Volumetric level.
Risk = nearest opposite level or OB edge; targets = FVG midlines / next S/R.
Timeframes & assets
Defaults suit liquid intraday and 1–4H swing.
Slower markets → lengthen lookbacks, lower sensitivity.
Very noisy crypto → keep trend visible, trim drawings (e.g., MSB only, last 3–5 FVGs, 8–12 volume levels).
Keep it readable
Turn off modules you don’t need today—fewer, higher-quality signals beat clutter.
About this release
Internal scoring, smoothing, and detection logic are proprietary. Behavior is controlled via inputs described above.
Trade with a plan, test your settings, and let confluence do the heavy lifting.
Structure Pro+ (BOS, CHoCH, FVG, OB)Structure Pro+ (BOS, CHoCH, FVG, OB)
Structure Pro+ is a comprehensive Pine Script indicator designed for traders who utilize Smart Money Concepts (SMC) in their analysis. This powerful tool automatically identifies and visualizes key market structure elements, helping you gain deeper insights into price action and potential institutional movements.
Key Features:
Break of Structure (BOS): Clearly identifies trend continuation by marking points where price breaks a previous swing high in an uptrend or a swing low in a downtrend.
Change of Character (CHoCH): Pinpoints potential trend reversals when price breaks a swing point against the prevailing trend, signaling a shift in market sentiment.
Fair Value Gap (FVG) / Imbalance: Automatically highlights areas where price has moved quickly, leaving behind "imbalances" that often act as magnet zones for future price action.
Mitigation Logic: FVGs are dynamically tracked and can be set to disappear from the chart once mitigated (when price returns to fill the gap).
Order Block (OB): Detects and marks potential institutional order blocks, which are crucial supply and demand zones that frequently act as strong support or resistance levels.
Customizable Settings: Tailor the indicator to your specific trading style with extensive input options, including:
Pivot sensitivity (leftBars, rightBars)
Color and line style for BOS/CHoCH
FVG display options, including color and mitigation behavior
Order Block display options and colors
Label sizing for clarity
Integrated Alerts: Stay informed with built-in alert functionalities for:
BOS occurrences (Bullish/Bearish)
CHoCH occurrences (Bullish/Bearish)
Confluent events: BOS + FVG and CHoCH + FVG, providing high-probability trade setups when structure breaks align with imbalances. The confluenceLookback setting allows you to define the maximum distance between these events for an alert.
Why Use Structure Pro+?
This indicator simplifies the complex process of identifying SMC concepts on your charts. By automatically drawing BOS, CHoCH, FVG, and OB, Structure Pro+ helps you:
Validate your directional bias with clear visual cues.
Identify potential entry and exit points around significant structural levels.
Enhance your market understanding based on institutional footprints.
Receive timely notifications for high-probability setups, so you never miss a critical market event.
Structure Pro+ is an invaluable tool for any trader looking to refine their analysis with Smart Money Concepts.
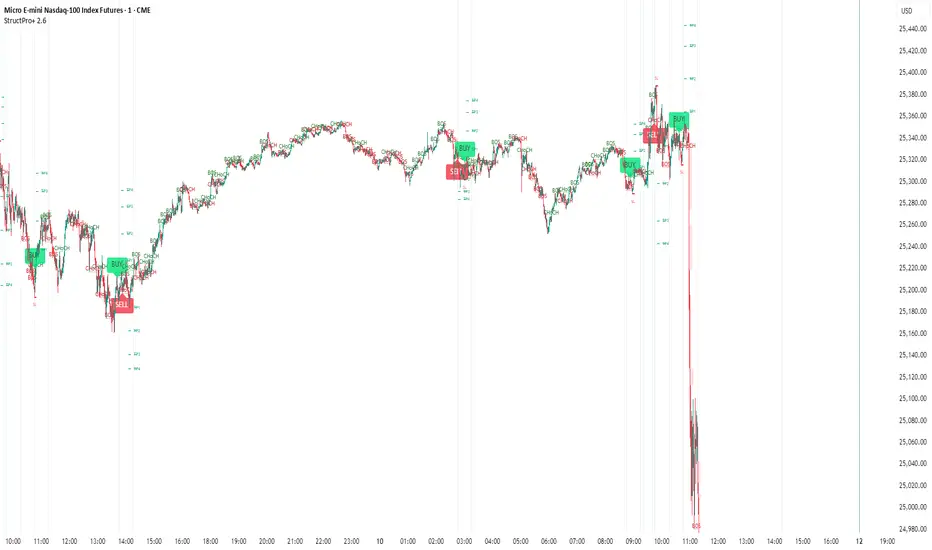
Internal/External Market Structure [UAlgo]The "Internal/External Market Structure " indicator is a tool designed to identify and visualize internal and external market structure based on swing highs and lows. It helps traders understand short-term (internal) and long-term (external) price behavior.
🔶 What are ChoCH and BoS?
Change of Character (ChoCH)
Change of character refers to the reversal of market trend either from bullish to bearish or bearish to bullish. ChoCH is also a break of market structure but in opposite direction.
If market is in bullish trend but it breaks it previous (higher) low and makes a lower low, it will be termed a “bearish change of character” as price changed its trend from bullish to bearish.
Like wise if price is in bearish trend and it breaks its previous (lower) high making a higher high it will be marked as “bullish change of character” as price changed its trend from bearish to bullish.
Break of Structure (BoS)
When price breaks its structure in direction of previous trend its called break of structure (BoS). So its a trend continuation pattern.
As you know in bullish trend price makes higher highs. Each time when price break a previous high and marks a new high its known as bullish break of structure.
But in bearish trend price makes lower lows so every time when price breaks previous low and makes a new low it is called as bearish break of structure.
🔶 Key Features
Internal Swing Length: Allowing for fine-tuning of sensitivity to smaller, more frequent market movements.
External Swing Length: Focusing on capturing broader market trends.
The indicator differentiates between internal and external market structures, using different styles and colors to represent each. Internal structures are shown with solid lines, while external structures use dashed lines, providing clear visual cues.
Internal Market Structure:
The internal market structure focuses on shorter-term swings and is useful for identifying minor trend changes and short-term price movements. Breaks of internal swing highs or lows can indicate potential changes in the market's direction or momentum. The labels "CHoCH" and "BoS" help distinguish between changes in character and break of structure events, respectively.
External Market Structure:
The external market structure captures larger, more significant market moves. It is particularly useful for identifying major trend changes and key support and resistance levels. The dashed lines and corresponding labels "CHoCH+" and "BoS+" indicate more substantial shifts in market sentiment.
For BoS (Break of Structure):
For ChoCH (Change of Character):
🔶 Disclaimer
Use with Caution: This indicator is provided for educational and informational purposes only and should not be considered as financial advice. Users should exercise caution and perform their own analysis before making trading decisions based on the indicator's signals.
Not Financial Advice: The information provided by this indicator does not constitute financial advice, and the creator (UAlgo) shall not be held responsible for any trading losses incurred as a result of using this indicator.
Backtesting Recommended: Traders are encouraged to backtest the indicator thoroughly on historical data before using it in live trading to assess its performance and suitability for their trading strategies.
Risk Management: Trading involves inherent risks, and users should implement proper risk management strategies, including but not limited to stop-loss orders and position sizing, to mitigate potential losses.
No Guarantees: The accuracy and reliability of the indicator's signals cannot be guaranteed, as they are based on historical price data and past performance may not be indicative of future results.
