Engulfing Candles AlertThis is a Engulfing Candle Indicator with Alerts.
This is not like any other Engulfing candle indicator present on TV. There are some special rules that are being used to identify specific engulfing candles.
Also, the user can choose if they like nice body engulfing or they want to ignore them.
The indicator have the following highlights:
1) Ability to choose the color of the engulfing candle body.
2) Ability to choose a different color for the Liq (liquidity) swap engulfing candle body.
Bullish Engulfing after Liq Swap
Bearish Engulfing after Liq Swap
3) With above 2 options, you can get the desired information without plotting any extra information on the chart.
4) You can put the alerts for getting notified when these patterns forms on the chart.
5) Ability to choose between getting notified or not on the chart if the engulfing candle body is less than 40% of the whole candle size. This is useful in order to identify if the engulfing is really powerful or not.
After selecting the option to ignore such engulfing
6) Ability to choose between getting notified or not on the chart if the engulfed candle body is really small. This is in particular useful for avoiding the engulfing of Doji which in turn might not be that powerful.
After selecting the option to ignore such engulfing
We will keep on making the improvements/Enhancements over the time (Check the changelog for such features)
NOTE: The indicator is of best use if you have a defined & back tested strategy which relies on this type of candlestick pattern.
Search in scripts for "Candlestick"
Bullish Engulfing AlertThis is a Bullish Engulfing Candle Indicator with Alerts.
This is not like any other Bullish Engulfing candle indicator present on TV. There are some special rules that are being used to identify specific engulfing candles.
Also, the user can choose if they like nice body engulfing or they want to ignore them.
The indicator have the following highlights:
1) Ability to choose the color of the engulfing candle body.
2) Ability to choose a different color for the Liq (liquidity) swap engulfing candle body.
3) With above 2 options, you can get the desired information without plotting any extra information on the chart.
4) You can put the alerts for getting notified when these patterns forms on the chart.
5) Ability to choose between getting notified or not on the chart if the engulfing candle body is less than 40% of the whole candle size. This is useful in order to identify if the engulfing is really powerful or not.
6) Ability to choose between getting notified or not on the chart if the engulfed candle body is really small. This is in particular useful for avoiding the engulfing of Doji which in turn might not be that powerful.
We will keep on making the improvements/Enhancements over the time (Check the changelog for such features)
NOTE: The indicator is of best use if you have a defined & back tested strategy which relies on this type of candlestick pattern.

Bearish Engulfing AlertThis is a Bearish Engulfing Candle Indicator with Alerts.
This is not like any other Bearish Engulfing candle indicator present on TV. There are some special rules that are being used to identify specific engulfing candles.
Also, the user can choose if they like nice body engulfing or they want to ignore them.
The indicator have the following highlights:
1) Ability to choose the color of the engulfing candle body.
2) Ability to choose a different color for the Liq (liquidity) swap engulfing candle body.
3) With above 2 options, you can get the desired information without plotting any extra information on the chart.
4) You can put the alerts for getting notified when these patterns forms on the chart.
5) Ability to choose between getting notified or not on the chart if the engulfing candle body is less than 40% of the whole candle size. This is useful in order to identify if the engulfing is really powerful or not.
6) Ability to choose between getting notified or not on the chart if the engulfed candle body is really small. This is in particular useful for avoiding the engulfing of Doji which in turn might not be that powerful.
We will keep on making the improvements/Enhancements over the time (Check the changelog for such features)
NOTE: The indicator is of best use if you have a defined & back tested strategy which relies on this type of candlestick pattern.

Breakout Probability (Expo)█ Overview
Breakout Probability is a valuable indicator that calculates the probability of a new high or low and displays it as a level with its percentage. The probability of a new high and low is backtested, and the results are shown in a table— a simple way to understand the next candle's likelihood of a new high or low. In addition, the indicator displays an additional four levels above and under the candle with the probability of hitting these levels.
The indicator helps traders to understand the likelihood of the next candle's direction, which can be used to set your trading bias.
█ Calculations
The algorithm calculates all the green and red candles separately depending on whether the previous candle was red or green and assigns scores if one or more lines were reached. The algorithm then calculates how many candles reached those levels in history and displays it as a percentage value on each line.
█ Example
In this example, the previous candlestick was green; we can see that a new high has been hit 72.82% of the time and the low only 28.29%. In this case, a new high was made.
█ Settings
Percentage Step
The space between the levels can be adjusted with a percentage step. 1% means that each level is located 1% above/under the previous one.
Disable 0.00% values
If a level got a 0% likelihood of being hit, the level is not displayed as default. Enable the option if you want to see all levels regardless of their values.
Number of Lines
Set the number of levels you want to display.
Show Statistic Panel
Enable this option if you want to display the backtest statistics for that a new high or low is made. (Only if the first levels have been reached or not)
█ Any Alert function call
An alert is sent on candle open, and you can select what should be included in the alert. You can enable the following options:
Ticker ID
Bias
Probability percentage
The first level high and low price
█ How to use
This indicator is a perfect tool for anyone that wants to understand the probability of a breakout and the likelihood that set levels are hit.
The indicator can be used for setting a stop loss based on where the price is most likely not to reach.
The indicator can help traders to set their bias based on probability. For example, look at the daily or a higher timeframe to get your trading bias, then go to a lower timeframe and look for setups in that direction.
-----------------
Disclaimer
The information contained in my Scripts/Indicators/Ideas/Algos/Systems does not constitute financial advice or a solicitation to buy or sell any securities of any type. I will not accept liability for any loss or damage, including without limitation any loss of profit, which may arise directly or indirectly from the use of or reliance on such information.
All investments involve risk, and the past performance of a security, industry, sector, market, financial product, trading strategy, backtest, or individual's trading does not guarantee future results or returns. Investors are fully responsible for any investment decisions they make. Such decisions should be based solely on an evaluation of their financial circumstances, investment objectives, risk tolerance, and liquidity needs.
My Scripts/Indicators/Ideas/Algos/Systems are only for educational purposes!

3 Line Strike [TTF]This indicator is a spin-off of the popular TMA Overlay indicator made by request of the original author that narrows down the scope to simply identifying a couple of key candlestick patterns - Engulfing candles and 3 Line Strikes.
In addition to being a far more tailored and purpose-specific indicator, we have also update the indicator code to the latest version of Pinescript and added some enhanced alerts.
ARKA-Heikin Ashi OscillatorThis Indicator is based on Mr. Dan Valcu ideas.
This indicator is made as Hicken-Ashi Oscillator by haDelta. The closing price of the candlestick is not used to make this indicator.
- Indicators generally have a delay. Since this indicator has an haDelta oscillator, it helps to reduce this delay.
- This indicator has two fast lines "K" and slow "D".
-Similarly to haDelta, this indicator can be used to calculate price targets based on inverse positive and negative divergences between the price and the oscillator.
- The peaks or lows range in the oscillator is almost the oversold and overbought points in the price chart.
- Use this oscillator similar to other oscillators and use the oversold and overbought levels, 50-level, divergences and crossovers between its two components.
-In an uptrend, when the oscillator turns down, it is time to reduce the stop loss on long trades.
-In a downtrend, when the oscillator is bullish , it is time to reduce the stop loss on short trades.
Neo's Divergence FractalsDivergence Fractals combine divergence candlestick patterns with concepts pioneered by Bill Williams and George Lane to create a precise trend following tool that responds very well to the FX market. This indicator is built off of my Neo Fractal data set, which unlike traditional Williams fractals, track highest and lowest closes instead of higher highs and lower lows. Through my own research, I've found Neo Fractals to be a much more accurate way of pinpointing %K and RSI extremes than Williams fractals, especially in scenarios where markets make higher highs or lower lows, but fail to close higher or lower. This can lead to false divergence signals because the stochastic and RSI values aren't referenced at their highest or lowest point.
If divergence is detected between the previous close and the closest fractal above or below the close, the script then waits for a close above (bullish), or below (bearish) the close where divergence was present, at which point, an up (bullish) or down (bearish) fractal will appear on the chart. Divergence signals followed by engulfing candles are also colored, so they're easy to spot. These are the highest quality reversal or in some cases trend continuation signals! Divergence Fractals can be a great entry tool, but can also be great for managing and closing active trades as well. This indicator was designed to work in tandem with my %K as well as my proprietary Lucky7 indicator, mainly on the 1HR chart.

No Active BarThis is probably the only script on TradingView that's clinically proven to lower your blood pressure!***
This script in conjunction with some chart settings changes can completely hide the active candle, only showing historic candles, thus, reducing risk of cardiac arrest and or panic attack.
What to do:
0. Make sure you are using a candlestick chart or this script won't work properly
1. Right click the chart and select "Settings..."
2. Select "Symbol" under the "Chart Settings" menu
3. Disable every item EXCEPT for the "Body"
4. Click on the boxes next to "Body" to access the color picker then change both box's transparency settings down to 0
(the script only colors closed bars, so the active bar will be present just transparent)
5. Right click on the price scale on the far left or far right side of the screen and hover the mouse over "Labels". If any selections have a check mark next to them click them to disable them (especially the "Ask & Bid" price setting since it tracks current price)
That's it! Instead of wicks the High & Low prices are plotted above and below the candles using a step line. It looks a bit strange at first but you'll get used to it. Check out the indicator settings to change the color and style of the High & Low lines.
***The statement could prove true for some but is mostly complete bullshit

MarginRockets 5 Mins Ultimate Scalp v15 Mins Scalp on any Pair:
-Model Components:
a.EMA 200
b.VWMA 20
c. ADX
d.DI+/DI-
e.Volume ansd Average Volume
- The Model will give you the Buy/Sell signal but you have to consider:
a.The Candlestick patterns
b.How far the candle from the ema200(Blue line)
c.The vwma can be used as supporting indicator
-Trading Rules:
a.Leverage 10x
b.Take profit always: 2% (20% with leverage)
b.Stop loss is last swing high or low
Hoe all teh best for all of you!!!!!

MME NimblrTA Setup v1.0Hi All,
This is a Candlestick template script to be used for identifying momentum and waves.
There are only 2 types of candles - Momentum Candles ( MC - Body height >= 50%) and Indecision Candles ( IC ).
ICs are further separated as Tiny Beast based on NimblrTAs, Candle height ratio compared to certain % Open price of the day. The % varies based on TF of the chart.
Green and Red are MCs .
IC is colored white
Tiny Beast based on Candle height is colored blue.
Tiny Beast based on Candle height + Body Height is marked $.
This setup is used to identify Waves (ascending waves, descending waves, binets, reverse binets etc) - Per Line chart, Zig Zag .
Intraday EMA setup - 5, 13, 34 is used for EMA alignment
Investment EMA setup - 5, 21, 55 is used for EMA alignment.
PSAR 0.01 setting is normally used for trailing / to check ascending or descending wave at high level.
PSAR 0.005 is additionally added to check for follow-up of move. So when PSAR 0.01 is broken, expect PSAR 0.005 to be broken. That can be a scalping target or confirmation of capturing the right trend.
This setup is used for Intraday as well as Investments. The settings have been defaulted for Intraday setup.

Heikin_Ashi_HommaThis is a indicator based on the well known Heikin Ashi candle.
There is one diference, it uses the "Close" from the original candle and a spot price wich can be adjusted to calculate the moving averages. As default I set it as spot = close*0.8 + open*0.2.
The periods of the moving averages can be adjusted too.
The intention is to extract the smoothness of the Heikin Ashi candle with a more fast perception to the closing price and the MAs.
The name is in consideration to the inventor of the candle tick.
Observation : Be sure to use the normal candlestick in the normal window, if the candle type is HA the indicator will repeat the values.

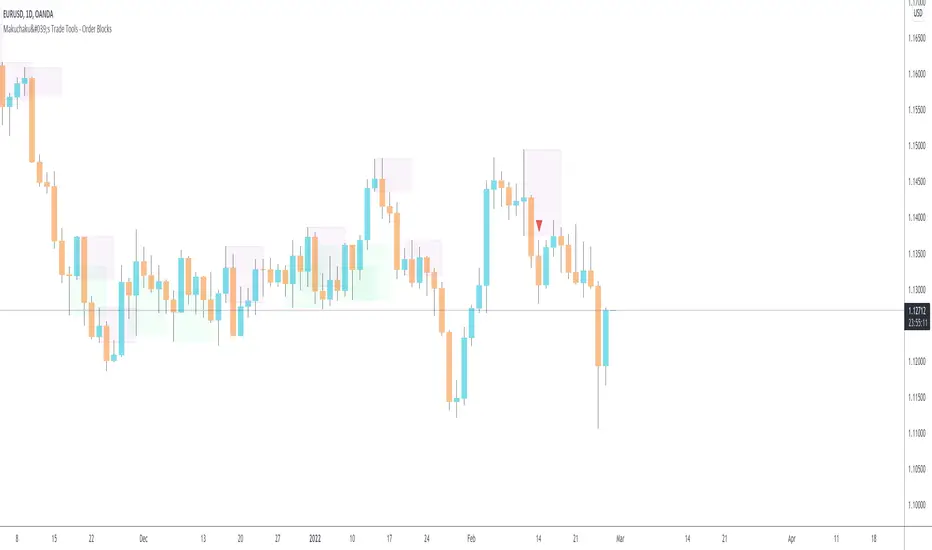
Makuchaku's Trade Tools - Pivots/Fractals & CrossoversPivots/Fractals are at minimum a 3 candlestick pattern.
Bearish pivot/fractal is formed when a candle is flanked by 2 lower candles on either side
Bullish pivot/fractal is formed when a candle is flanked by 2 higher candles on either side
They are great to determine market structure.
This indicator also prints boxes when those pivots/fractals are crossed over, printing bearish & bullish boxes.

Makuchaku's Trade Tools - Order BlocksOrder blocks are a 2 candlestick pattern
Bullish order block : down candle getting engulfed by an up candle
Bearish order block : up candle getting engulfed by a down candle
The Fearless Power Suite systemDear TradingView community and followers,
Through my years I have often seen trading systems with many functionalities or indicators that can be customized in numerous ways; however I wanted something that could stomach most trading contexts without having to change settings while allowing me to have the freedom of a clean chart to keep using discretionary trading as confluence.
Using a complex combination of bullish/bearish technical breakouts (looking at general market structure while combining candlestick patterns, exponential moving averages and various indicators that indicate new trends), the aim of this system is to catch safe breakouts and at the same time notify the user of fake outs and unfavorable market conditions.
Settings to be used:
The following settings are to be used; the Fearless Power Suite system (FPS) is based on candlestick closes to correctly identify market conditions and patterns. It is not recommended to change them because waiting for candlestick closes in my opinion adds extra “confirmation” for decision taking.
Len: 14
Source_input: Close
Start: 0.02
Increment: 0.02
Max value: 0.2
How to use the system:
General context: Bias formation for directional trading is formed by looking at the general market structure which in this case is primarily created by looking at the cloud formed by the 2 moving averages. “The cloud” is referred as the space within the 2 moving averages.
One of the lines is the 21 EMA (which is my favorite classical EMA) and a “Super MA” formed by a simple mathematical equation. This allows the trader to always keep an eye on key support and resistance levels and optimize entries by entering at these given levels. The 21 EMA is a must in my opinion to enter bounces within a trend or very aggressive entries while the “Super MA” is rather to find extreme points for market reversals.
Top and bottom warning: Indicators signaling potential bottoms or tops already exist but the warning often comes only after a certain breakdown/breakup already happening but rarely on the candlestick itself.
Example: To give you a bearish signal, indicators often give you a signal on an engulfing red candlestick that follows a smaller green candlestick because it shows weakness, but rarely do you see this warning made on the green candlestick itself! Of course, it’s a signal given with less confirmation but to take partial profit on your trades it is quite effective.
Market structure breakout signals: Taking into account the general structure of the market (trending/ranging) as a result of using volatility and volume as key indicators of this complicated mix, trade signals are often given when it is considered “safe” to enter. The beauty of this, which is decently rare from what I’ve seen, is that during choppy conditions (which are not recommended to be traded) the trader will get fewer signals than usually. This is doable thanks to the volume and volatility monitoring.
The aim of these structure breakout signals is to reduce market noise and only highlight key moments of the market when you should pay attention. The candlestick formations which will create these signals will always have a certain importance from a market structure perspective and so a SL can easily be found at all times when entering during that time.
No trade zones: As previously mentioned one of the features of this system is to notify the trader in case of bad context. 2 different signals might come up “No long” or “No short” which means that from a statistical perspective it is highly recommended not to take a long or short entry in that given signal to avoid disastrous trades.
The “No long”/”No short” function of the system primarily uses Daily Range data which will continue to change during the day until the daily close, information such as Daily Low and Daily High will thus evolve. This means that sometimes this part of the FPS system will repaint but it’s not a common occurrence. This function is mainly used to reduce your current risk in case you are in a trade or to not enter any position, but not a signal for entry on its own.
Concepts combination:
This system will give you a decent amount of trade opportunities, I strongly advice you nevertheless to always find confluence in your decision making with discretionary trading as well if possible. Patience is key as always. Here is a small list of trade combinations to be used to improve results.
Example 1: Entering a position when getting a market breakout signal given after seeing a top or bottom warning on your chart. This is what we could call a “double confirmation”.
Example 2: Using the “Super MA” considered as extreme value for market reversals in a certain timeframe (15minutes for this example) while also looking at the above timeframe (1 hour in this example) for the 21EMA to be situated at the same level for a trending bounce and thus again getting a double confirmation. (Because both timeframes expected a reaction from that level). Seek a market structure breakout signal on the 15 minutes to get even more confirmation and a pre-made Stop Loss.
Limitations:
Although the signals are all created following a strict amount of technical rules not all should be taken. It is the trader’s duty to always find confluence to improve long term results. This is not a “magical bot”; I firmly believe that the best combination in trading comes from new technologies and using human intelligence.
When the Fearless Power Suite system (FPS) is used on a chart where volume data is not available not all functions will be available as volume data is taken into serious consideration for entries and trend following signals. General market structure and part of the FPS system will still be available nonetheless.
PS: The FPS works for every market and every timeframe, I personally mainly use it on cryptocurrencies (and on the SP500 and DXY for added confirmation to get a general grasp of market context).
I hope this description was useful enough :)

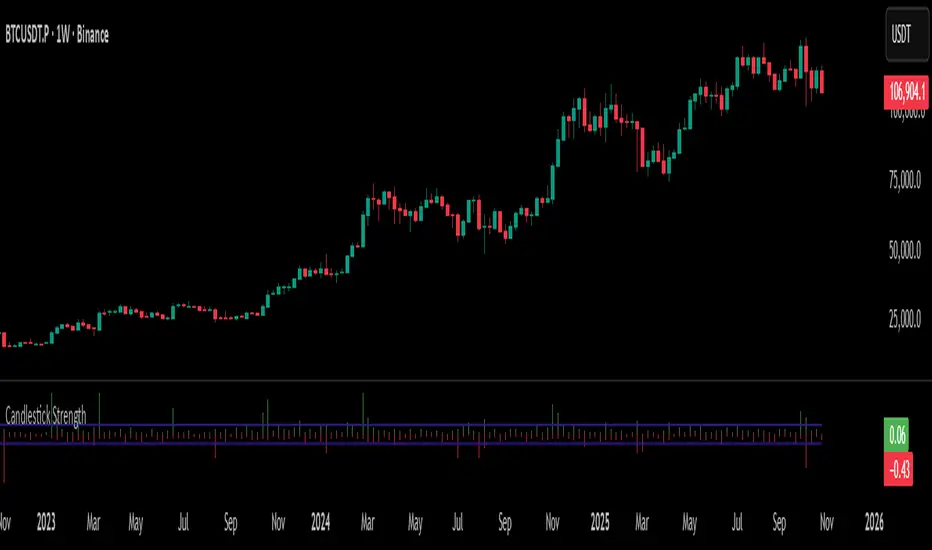
Candlestick StrengthThis indicator quantifies the “energy” of each candlestick by combining its height (high–low span), trading volume, and internal structure (body vs. wick proportions). It provides a numeric measure of how strongly each candle contributes to market momentum, allowing traders to distinguish meaningful price action from indecision or noise.
Concept
Every candlestick represents a short-term contest between buyers and sellers. Large candles with significant volume indicate strong market participation, while small or low-volume candles suggest hesitation or absorption. Candlestick Strength captures this by calculating a normalized measure of each candle’s energy relative to recent activity, making it comparable across different market conditions and timeframes.
The indicator also analyzes the candle’s internal structure:
The body reflects net directional movement.
The wicks represent back-and-forth price traversal within the candle. Because wick movement does not fully contribute to directional momentum, it is weighted at half the body’s contribution. This ensures the indicator emphasizes sustained directional pressure while still acknowledging rejection or absorption.
Interpretation
High values indicate candles with energy above recent averages — suggesting expanding momentum and strong directional intent.
Average values reflect typical candle activity, representing neutral or steady market behavior.
Low values suggest weak candles — either the market is pausing, consolidating, or momentum is fading.
The outputs are displayed as a symmetric histogram: bullish candle energy is shown in green above zero, bearish energy in red below zero, with ±1 reference lines marking the normalized average energy level.
Usage
Combine with trend analysis, swing highs/lows, or volume-weighted averages to validate breakouts or trend continuation.
Monitor for divergence between price movement and candle energy to identify exhaustion, absorption, or potential reversals.
Filter out false momentum signals caused by narrow-range or low-volume candles.
Adaptable across timeframes: normalized energy allows comparison between small and large timeframe candles.
Candlestick Patterns Dashboard Pro+ [ULTIMATE]Unleash the power of automated candlestick analysis with the most comprehensive and customizable pattern detection tool on TradingView. This is not just another pattern scanner; it's a complete trading dashboard designed to identify, score, and confirm high-probability setups, saving you hours of manual chart analysis.
Built with performance and reliability in mind, this script goes beyond simple detection by introducing a unique reliability score for every pattern, advanced confirmation filters, and a powerful on-screen dashboard to keep you informed.
Key Features
📈 Comprehensive Pattern Detection: Automatically identifies 13 of the most effective candlestick patterns, including Bullish/Bearish Engulfing, Hammer, Shooting Star, Doji, Morning/Evening Star, and more.
🔟 Dynamic Reliability Scoring: Every pattern is assigned a score from 1-10 based on its confirmation strength. Factors include candle body size, volume confirmation, trend alignment, and higher-timeframe confluence, giving you a quantifiable measure of a pattern's potential.
📊 The Ultimate Dashboard: Your at-a-glance command center. The on-screen dashboard provides a complete summary of all active patterns, showing you exactly when they last occurred and highlighting the most recent signals. It also includes an "Overall Bias" meter for a quick sentiment check.
🛡️ Trade Smarter with Advanced Confirmation Filters: Eliminate low-quality signals and focus on what matters.
Trend Alignment: Use SMA(50) and SMA(200) to only show patterns that agree with the dominant market trend.
Volume Confirmation: Validate patterns by requiring a surge in volume.
Non-Repainting HTF Confirmation: Ensure your patterns align with the trend on a higher timeframe (e.g., Daily trend for a 4H signal) using a reliable, non-repainting method.
Market Condition Filter: Isolate patterns that occur only in "Trending" or "Ranging" markets.
Time Filter: Restrict pattern detection to specific trading sessions.
🔧 ‘Fuzzy Logic’ for Real-World Trading: Textbook patterns are rare. Use the "Fuzzy Logic" settings to adjust the criteria for patterns like the Hammer, Piercing Line, and Doji, allowing you to catch imperfect but still valid real-world formations.
⚙️ Fully Customizable Scoring: You decide what's important! Adjust the bonus scores for volume, trend, and other factors to create a scoring system that perfectly aligns with your trading strategy.
🚨 Powerful & Customizable Alerts: Never miss an opportunity.
Create alerts for any individual pattern.
Get notified of "Pattern Clusters" when multiple bullish or bearish signals appear in close succession.
Customize the alert messages to be compatible with your favorite trading automation services.
🚀 Performance Optimized: A "Max Bars Back" setting ensures the script runs smoothly and efficiently, even on lower-end devices or extensive historical data.
How To Use This Indicator
For Confirmation: The primary strength of this tool is for confirmation. Do not trade based on patterns alone. Use the detected signals to confirm your own analysis, such as a pattern appearing at a key support/resistance level, a trendline, or a Fibonacci retracement. A Bullish Engulfing pattern at a major support level is a much stronger signal than one appearing in the middle of a range.
For Discovery: Use the Dashboard to quickly scan through your favorite assets. A dashboard full of recent bullish signals on one asset, and bearish on another, can instantly help you focus your attention for the day.
Customizing for Your Style:
Start with the Market Presets ("Forex," "Stocks," "Crypto") for a solid baseline.
Dive into the Scoring Weights to tell the indicator what you value most. A pure volume trader might increase the Volume Bonus score.
Adjust the Fuzzy Logic settings based on your market's volatility. A volatile crypto market might require a more lenient Doji definition than a stable blue-chip stock.
Setting Up Alerts:
Add the indicator to your chart.
Click the "Alert" button in the TradingView toolbar.
Set the "Condition" to "Candlestick Patterns Dashboard Pro+ ".
Choose the specific alert you want from the dropdown (e.g., "Bullish Pattern Detected," "Bearish Pattern Cluster").
Customize the message if needed and click "Create."
A Note of Thanks
This script began as a personal project and has evolved into this ultimate version thanks to invaluable community feedback, bug reports, and suggestions. A special thank you to the users who helped identify and fix critical bugs related to syntax and variable scope. This collaborative effort has made the indicator more robust and reliable for everyone.
Disclaimer: This tool is for educational and analytical purposes only. All trading involves substantial risk. Past performance is not indicative of future results. Please trade responsibly.

ICT Single Candle Order Block (SCOB) [UAlgo]The "ICT Single Candle Order Block (SCOB) " designed for traders who utilize the concept of Order Blocks in their trading strategy. Order Blocks are significant price levels where institutions or smart money have placed their trades, leading to potential future price reactions when these levels are revisited. This indicator focuses on identifying and highlighting Single Candle Order Blocks (SCOBs), allowing traders to visually analyze key price levels on their charts.
🔶 What is Single Candle Order Block (SCOB) ?
A Single Candle Order Block (SCOB) is a specific type of Order Block that is identified based on a single candlestick pattern. These patterns indicate potential areas where significant buying or selling interest has occurred, often leading to a notable price reaction when revisited. In the context of this indicator, a bullish SCOB is identified when a specific bullish candlestick pattern is met, and a bearish SCOB is identified based on a bearish candlestick pattern.
Bullish SCOB: Detected when the open price of two bars ago is higher than its close, the close price of the previous bar is higher than its open, the current close price is higher than the open, the low of the previous bar is lower than the low of two bars ago, and the current close is higher than the high of the previous bar.
Bearish SCOB: Detected when the open price of two bars ago is lower than its close, the close price of the previous bar is lower than its open, the current close price is lower than the open, the high of the previous bar is higher than the high of two bars ago, and the current close is lower than the low of the previous bar.
🔶 Key Features
Show Single Candle Order Block (SCOB): Toggle the visibility of the Single Candle Order Blocks on the chart.
Mitigation Method: Choose between "Close" and "Wick" methods for determining whether a SCOB has been mitigated (price has interacted with the block).
Show Last X SCOBs: Control the number of most recent SCOBs displayed on the chart, allowing you to focus on the most relevant price levels.
Volatility Filter: Enable or disable the volatility filter, which uses the Average True Range (ATR) to filter out less significant SCOBs. When enabled, only SCOBs with an ATR above the mean value of the ATR are displayed.
Customizable Colors: Configure the colors for bullish and bearish SCOBs to enhance visual clarity. The indicator uses cooler RGB values to ensure the blocks are distinct and easily noticeable.
🔶 Disclaimer
The "ICT Single Candle Order Block (SCOB) " indicator is provided for educational and informational purposes only. Trading involves significant risk and may not be suitable for all investors.
Past performance is not indicative of future results. Users should use this indicator in conjunction with their own research and trading strategy.

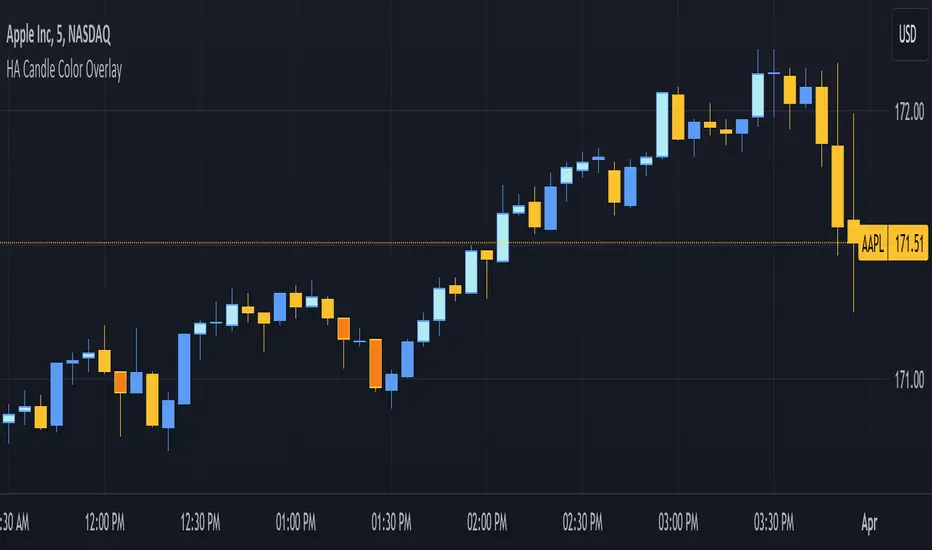
3. [Pufferman] - HA Candle Color OverlayThis indicator is designed for traders who utilize Heikin-Ashi (HA) candles to determine market trend direction and strength but prefer not to clutter their charts with multiple candlestick overlays or constantly switch between chart types. It aims to enhance chart readability by marking significant HA candles directly on the price chart, leveraging the unique characteristics of HA candles to signal trend direction and momentum.
Key Features:
1. Trend Identification through HA Candles: Automatically calculates Heikin-Ashi candles based on standard price data, highlighting significant HA candles that exhibit flat tops or bottoms. These characteristics are indicators of strong trend presence and direction. Highlights are in darker or lighter shade (darker - bearish or light - bullish colors) than the standard candles for easy read.
2. Cleaner Chart Presentation: Offers a streamlined alternative to overlaying HA candles on traditional candlestick charts or toggling between different chart views, keeping the user's interface uncluttered.
3. Selective Highlighting Based on Agreement: Marks traditional candles only when there's a concurrence between the HA candle's trend (bullish or bearish) and the traditional candle's trend. This feature ensures that only the most relevant signals are highlighted for the trader's attention.
Operational Mechanism: The script identifies HA candles with open equal to high (for flat tops) and open equal to low (for flat bottoms), which typically indicate strong trend movements. By marking these on the regular price chart, it provides immediate visual cues about trend strength and direction without needing to switch between HA and traditional candlestick views.
This tool is particularly useful for traders looking for a clean and efficient way to incorporate the insights of Heikin-Ashi candles into their technical analysis without the visual complexity of full HA candlestick overlays.
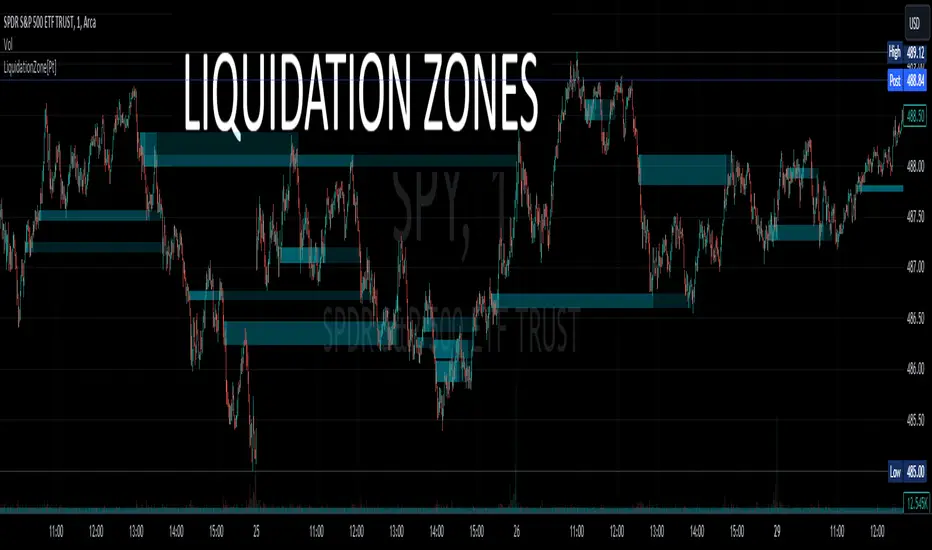
Liquidation Zone [Pt]█ Introduction
The Liquidation Zone indicator is designed to identify key price ranges where significant market activity, such as the liquidation of positions, is likely to occur. These zones are identified based on a specific candlestick pattern, offering insights into potential areas of market sensitivity.
█ Key Features:
► Specific Candlestick Pattern Identification: The indicator identifies liquidation zones by detecting a pattern where a red candle is encased within a series of green candles (in bullish scenarios) or a green candle within red candles (in bearish scenarios). This pattern often suggests a point where the market pauses to liquidate positions before continuing the prevailing trend.
► Market Reaction Points: These liquidation zones represent significant levels where the market previously decided to liquidate or adjust positions, indicating potential areas where price might react upon revisit.
► Integration with Volatility and Volume Data: The script combines these candlestick patterns with volatility (using ATR) and volume data, adding depth to the analysis and increasing the reliability of these zones as potential reaction areas.
► Visual Zone Mapping on Charts: Liquidation Zones are clearly marked on the trading chart for easy identification, aiding traders in visualizing these critical market areas.
█ Possible Use Cases
► Identifying Potential Reaction Areas
Traders can use the Liquidation Zone indicator to pinpoint zones where the market might pause or reverse due to previous liquidation activities. These areas can be key for planning entries, exits, or expecting increased market volatility.
► Enhancing Trading Strategy
Incorporating the analysis of liquidation zones into a trading strategy allows for a more nuanced understanding of market behavior, particularly in recognizing potential areas where price might experience significant support or resistance.
► Complementing Technical Analysis
This indicator is a valuable addition to a technical analyst's toolkit. When used alongside other analysis tools, it provides a more comprehensive view of the market, enhancing decision-making and strategy formulation.
Better Heiken-Ashi Candles w/ Expanded Source Types [Loxx]Better Heiken-Ashi Candles w/ Expanded Source Types is an indicator to compare regular candles to traditional Heiken-Ashi candles to "better" Heiken Ashi candles. This indicator and comparison study appears an oscillator. The purpose of this indicator is to demonstrate a better way to calculate HA candles and also to demonstrate expanded source types. This indicator is meant to be used by advanced Pine Coders who wish to add fine-tuning to their indicators and strategies.
What are Heiken Ashi "better" candles?
The "better formula" was proposed in an article/memo by BNP-Paribas (In Warrants & Zertifikate, No. 8, August 2004 (a monthly German magazine published by BNP Paribas, Frankfurt), there is an article by Sebastian Schmidt about further development (smoothing) of Heikin-Ashi chart.)
They proposed to use the following :
(Open+Close)/2+(((Close-Open)/(High-Low))*ABS((Close-Open)/2))
instead of using :
haClose = (O+H+L+C)/4
According to that document the HA representation using their proposed formula is better than the traditional formula.
What are traditional Heiken-Ashi candles?
The Heikin-Ashi technique averages price data to create a Japanese candlestick chart that filters out market noise.
Heikin-Ashi charts, developed by Munehisa Homma in the 1700s, share some characteristics with standard candlestick charts but differ based on the values used to create each candle. Instead of using the open, high, low, and close like standard candlestick charts, the Heikin-Ashi technique uses a modified formula based on two-period averages. This gives the chart a smoother appearance, making it easier to spots trends and reversals, but also obscures gaps and some price data.
What's going on with this indicator?
- First, we have the options to select the candlestick type: Regular, HA, HA Better
- Next, and to demonstrate the expanded source types, I've added a simple moving average. In the drop down for the SMA source you'll notice something very different from the typical TradingView source selector. Here's how to decode the new names for the sources:
Close = close
Open = open
High = high
Low = low
Median = hl2
Typical = hlc3
Weighted = hlcc4
Average = ohlc4
Average Median Body = (open+close)/2
Trend Biased = (see code, too complex to explain here)
Trend Biased (extreme) = (see code, too complex to explain here)
... for HA and HA better, see the same set up as above but with different open and close values to calcualate the other source types
- For the HA better calculations, we run the close value through either an Adaptive, Kaufman, or T3 smoothing filter. The length for these smoothing filters, either 2 or 3, can be found in the code and is a constant value that shouldn't be changed. This smoothing is in inline with what is described in the article mentioned above
- Lastly, I've placed an SMA over the oscillator so that the user can test out the various sources explained above
Included:
- Toggle on/off bar coloring

Waves Change SignalsAn extension (supporting script) for Waves series (e.g. Waves + ZOOnes). It detects candlestick patterns and:
supports merging few candles into one to get more sensitive candlestick patterns detection
supports filtering in the context of current wave (but it cannot draw the wave by itself)
It supports filtering based on 2 rulesets/wave variants:
Low - More sensitive (trend will change more ofter).
Meddium - Less sensitive ( trend will change less ofter).
Script with limited access, contact author to get authorization
Features:
- Detect candlestick formations
- Merge candles to detect hidden patterns
- Filter results with the current wave state (bullish signals for corrections, bearinsh signals for impulses) with use of Low or Medium waves.
- Limit results to last x patterns.
Script settings:
Trend type - You can switch what kind of waves should be used for filtering.
Limit - You can limit resutls to last X formations.
Include bar merges - You can pich which merge patters should be included. e.g. 3 2 2 means that 7 bars are merged into 3 with the sequence 3 bars as first, 2 bars as second, 2 bars as third.


Consecutive Up and Down BarsOVERVIEW
Identify price thrusts made up of at least three consecutive bars that conform to specific criteria. (E.g., consecutive higher closes)
Depending on the context, these powerful thrusts can indicate emerging momentum or exhaustion. This indicator helps to mark these thrusts for further analysis.
CONCEPTS
As mentioned, these consecutive bar thrusts can indicate:
Momentum in the direction of the thrust; or
Exhaustion, implying possible short-term reversal or sideways action.
In the first case, we can track these patterns and their followthrough to determine changes in the market trend.
In the latter case, we can consider an entry by fading the pattern or use it for profit-taking. Price patterns like the Three-Bar Pullback are based on such premises.
There are different conditions used when looking for such consecutive bars. Hence, it's helpful to toggle the conditions while studying this pattern to see which ones work well with your trading approach. This is the primary purpose of this indicator.
This indicator looks for three consecutive bars that conform to the selected condition(s).
These are the conditions you can toggle in this study:
1. Bullish or Bearish Bars
A bullish bar closes higher than it opens. (Green candlestick)
A bearish bar closes lower than it opens. (Red candlestick)
2. Rising or Falling Closing Prices
This condition compares each closing price to the previous closing price.
3. Up or Down Bars
An up bar has a higher high and higher low compared to the previous bar.
A down bar has a lower high and lower low compared to the previous bar.
HOW TO USE
Display
The display is oriented towards traders who are looking to fade these consecutive bars.
Consecutive bars that push higher are marked with a down arrow above the bar.
Consecutive bars that push lower are marked with an up arrow below the bar.
In this implementation, as we are looking for at least three consecutive bars, the arrow marking starts from the third bar of the pattern.
Parameters
Toggle the different conditions that apply when marking consecutive bars. (Conditions as explained above)
Current Close vs. Current Open
Current Close vs. Previous Close
Current High and Low vs. Previous High and Low
You can select one or more of the conditions. By default, all are selected. (If all are unselected, it will mark every single bar and render the study useless.)
