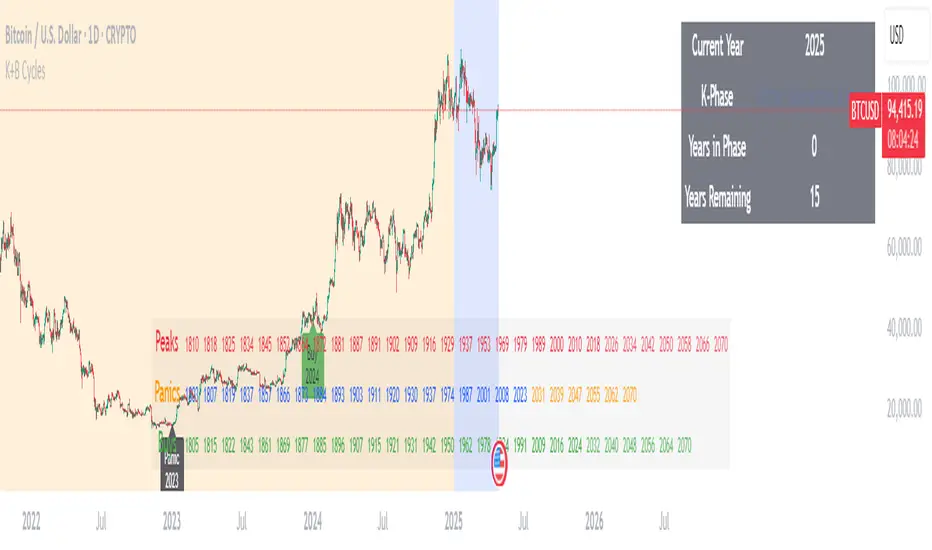
Kondratieff Wave & Benner Business CyclesKondratieff Wave Theory
Description: The Kondratieff Wave, also known as K-Waves or Long Waves, is an economic theory that posits long-term cycles of approximately 40-60 years in capitalist economies. These cycles consist of four phases: Spring (expansion and recovery), Summer (prosperity and peak), Autumn (stagnation and recession), and Winter (depression and restructuring). The theory suggests that technological innovations and major economic shifts drive these waves, influencing periods of growth and decline over decades.
Creator Bio: Nikolai Dmitriyevich Kondratieff (1892–1938) was a Russian economist born in the Kostroma Governorate. He studied at the University of St. Petersburg and became a prominent figure in Soviet economics. Kondratieff developed his long-wave theory in the 1920s while analyzing historical economic data, publishing works like The Major Economic Cycles (1925). His ideas clashed with Soviet ideology, leading to his arrest in 1930 during Stalin’s purges. He was executed in 1938, but his work gained recognition posthumously, influencing modern economic cycle analysis.
Benner Cycle Theory
Description: The Benner Cycle, proposed by Samuel Benner, is a predictive model for business and commodity price cycles, focusing on shorter-term economic fluctuations. Benner identified recurring patterns in market peaks (highs), panics (crashes), and buying opportunities (lows), with cycles averaging 8-10 years for highs, 7-8 years for panics, and 8-9 years for buys. His theory, based on historical observations of U.S. markets, aimed to guide farmers and investors by forecasting periods of prosperity and distress.
Creator Bio: Samuel T. Benner (1830s–unknown) was an American farmer and businessman from Ohio, not a formally trained economist. After losing his fortune in the Panic of 1873, Benner turned to studying economic patterns. In 1875, he self-published Benner’s Prophecies of Future Ups and Downs in Prices, a book that charted cycles in pig iron prices and other commodities. His work gained a cult following among traders and remains studied for its empirical approach, despite Benner’s lack of academic credentials and limited biographical records.
Search in scripts for "Cycle"
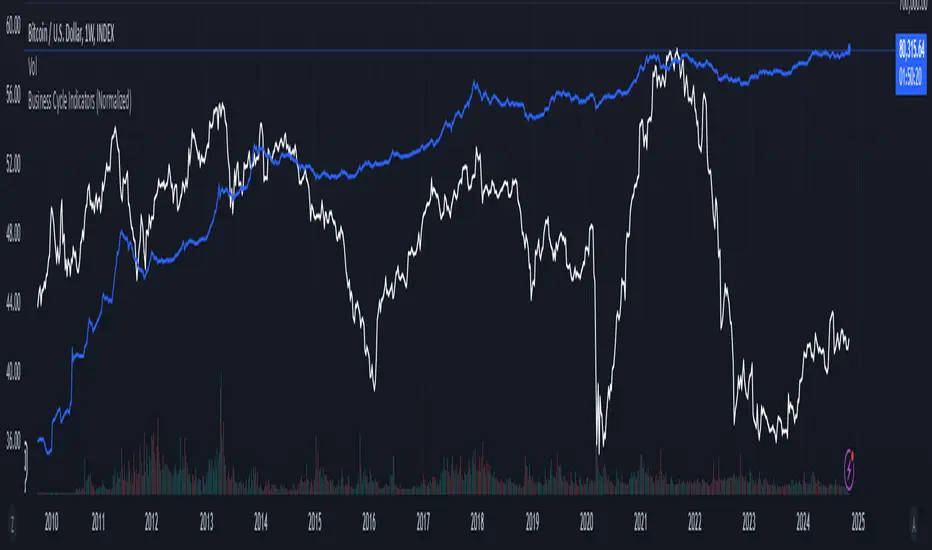
Business Cycle Indicators (Normalized)This script aggregates and normalizes several key economic indicators to provide a comprehensive view of the business cycle and overall market conditions. By combining these indicators into a single, normalized average line, the script helps identify overarching trends and shifts in the economy, aiding in more informed trading and investment decisions.
Included Indicators:
Inverted National Financial Conditions Index (NFCI):
Symbol: FRED:NFCI
Measures financial stress in the markets. An inverted NFCI aligns higher values with positive financial conditions.
Inverted Net Percentage of Banks Tightening Lending Standards (DRTSCIS):
Symbol: FRED:DRTSCIS
Reflects changes in bank lending practices. Inverting this indicator means higher values indicate easing lending standards, which is generally positive for economic growth.
HYG Close Price (iShares High Yield Corporate Bond ETF):
Symbol: AMEX:HYG
Represents the performance of high-yield corporate bonds, providing insight into credit market conditions.
Inverted High-Yield Credit Spread (BAMLH0A0HYM2):
Symbol: FRED:BAMLH0A0HYM2
Measures the spread between high-yield bonds and risk-free securities. A narrower (inverted) spread indicates better market conditions.
Manufacturing/Non-Manufacturing New Orders Ratio:
Symbols: ECONOMICS:USMNO (Manufacturing), ECONOMICS:USNMNO (Non-Manufacturing)
Compares manufacturing to non-manufacturing new orders to gauge shifts in economic activity.
US PMI (Purchasing Managers' Index):
Symbol: ECONOMICS:USBCOI
An indicator of the economic health of the manufacturing sector.
10-Year Inflation Breakeven (T10YIE):
Symbol: FRED:T10YIE
Represents market expectations of inflation over the next ten years.
Inverted 10-Year Real Yield (DFII10):
Symbol: FRED:DFII10
Reflects the real yield on 10-year Treasury Inflation-Protected Securities (TIPS). Inverted to align higher values with positive economic sentiment.
Copper/Gold Ratio:
Symbols: CAPITALCOM:COPPER (Copper), TVC:GOLD (Gold)
Compares the prices of copper and gold, often used as a barometer for global economic activity.
Features:
Normalized Indicators: Each indicator is normalized to a 0-100 scale to facilitate direct comparison, regardless of their original units or scales.
Normalized Average Line: Calculates and plots the average of all available normalized indicators, providing a single line that represents the combined economic signals.
Customizable Display:
Show Individual Indicators: Option to display individual normalized indicators for detailed analysis.
Show Normalized Average Line: Option to display the normalized average line for a consolidated view.
Dynamic Labeling: Displays the latest value of the normalized average directly on the chart for quick reference.
How to Use:
Adding the Script:
Apply the script to a chart in TradingView using a timeframe that aligns with the frequency of the economic data (daily or weekly recommended).
Customization:
Show Normalized Average Line: Enabled by default to display the combined indicator.
Show Individual Indicators: Enable this option in the script settings to display all individual normalized indicators.
Interpretation:
Normalized Scale (0-100): Higher values generally indicate stronger economic conditions, while lower values may suggest weakening conditions.
Trend Analysis: Use the normalized average line to identify trends and potential turning points in the business cycle.
Notes:
Data Availability: Ensure you have access to all the data sources used in the script. Some data feeds may require specific TradingView subscriptions.
Indicator Limitations: Economic indicators are subject to revisions and may not reflect real-time market conditions.
No Investment Advice: This script is a tool for analysis and should not be considered as financial advice. Always conduct your own research before making investment decisions.
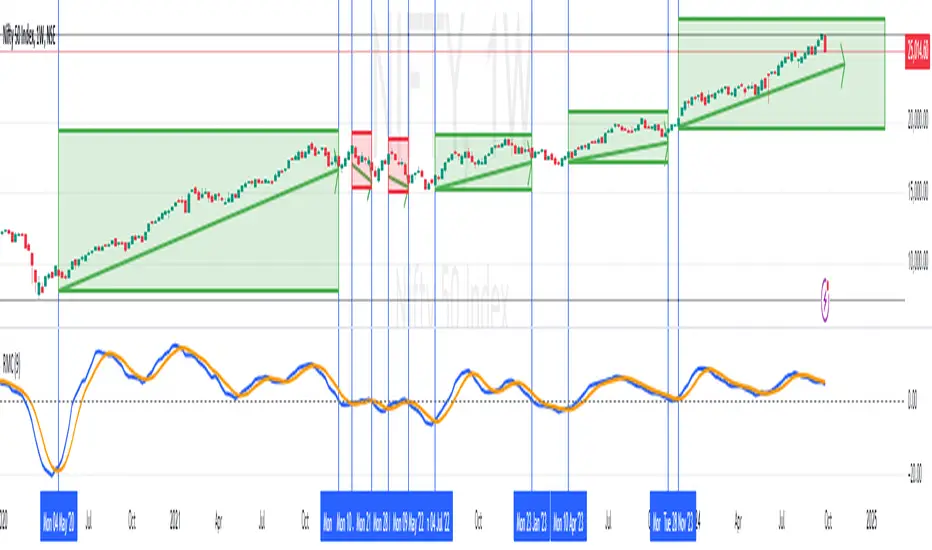
RoC Momentum CycleRoC Momentum Cycles (RMC) is derived from RoC (Rate of Change) indicator.
Motivation behind RMC: Addressing RoC’s Shortcomings
While the Rate of Change (RoC) indicator is a valuable tool for assessing momentum, it has notable limitations that traders must be aware of. One of the primary challenges with the traditional RoC is its sensitivity to price fluctuations, which can lead to false signals in volatile markets. This often results in premature entries or exits, impacting trading performance.
By smoothing out the RoC calculations and focusing on more consistent signal generation (using SMA on smoothed RoC), RMC offers a more consistent representation of price trends.
Momentum Cycles
RMC helps visualize momentum cycles in a much better way compared to RoC.
Long Momentum Cycle : A cross-over of smoothed RoC (blue line) above averaged signal (orange line) below zero marks start of a new potential upside cycle which ends when the blue line comes back to zero line from above.
Short Momentum Cycle : A cross-under of blue line below orange line above zero marks beginning of a potential downside cycle which ends when the blue line comes back to zero from below.
Market Cycle VisualizerPlots a customizable time-based grid on your chart to visualize market cycles. Draws vertical boundaries at interval starts, horizontal opening lines, and tracks high/low ranges within each period. Ideal for identifying recurring patterns and structure across custom timeframes.

PyraTime Intraday Cycles**Concept and Methodology**
PyraTime Intraday Cycles is a technical analysis tool designed to introduce the concept of **Temporal Cycle Projection**. While most indicators analyze price action (Y-axis), this tool focuses exclusively on the X-axis (Time).
By anchoring to a specific "Origin Pivot" (a user-defined High or Low), the script projects harmonic time intervals into the future. These vertical vectors serve as a grid, helping traders identify moments where time-based cycles may align with price structure.
**Technical Features**
This edition is optimized for **Multi-Timeframe Harmonic Flows**, utilizing a fixed algorithm for key intervals:
* **Anchor Point Logic:** The user manually selects a significant market pivot. The script calculates forward projections from this exact timestamp.
* **Standard Rhythms:** This version renders the **5-minute**, **15-minute**, **1-hour**, and **Daily** harmonic sequences. This allows for analysis across scalping, intraday, and swing trading structures.
* **Visual Confluence:** The indicator draws vertical lines to highlight potential zones of temporal exhaustion or acceleration.
**How to Use**
1. **Identify a Pivot:** Locate a significant High or Low on the chart.
2. **Set the Origin:** Open the settings and input the date/time of that pivot.
3. **Analyze Confluence:** Watch how price behaves when it approaches a vertical line. If price hits a key support/resistance level *at the same time* it hits a PyraTime vertical line, this is considered a high-probability "Time/Price" intersection.
**Version Comparison**
This script represents the foundational layer of the Great Pyramid system (PyraTime Apex).
* **PyraTime Intraday Cycles (This Script):** Focuses on Standard Timeframes (5m, 15m, 1h, Daily).
* **GPM Architecture (Advanced):** The full methodology extends these calculations to Esoteric Sequences (33, 144, 108), includes 3x Cycle Extensions, and features a Predictive Dashboard for complex multi-timeframe analysis.
**Disclaimer**
This tool is for educational and analytical purposes only. It identifies time cycles, not price direction. Past performance of a time cycle does not guarantee future results.

Volatility Cycle IndicatorThe Volatility Cycle Indicator is a non-directional trading tool designed to measure market volatility and cycles based on the relationship between standard deviation and Average True Range (ATR). In the Chart GBPAUD 1H time frame you can clearly see when volatility is low, market is ranging and when volatility is high market is expanding.
This innovative approach normalizes the standard deviation of closing prices by ATR, providing a dynamic perspective on volatility. By analyzing the interaction between Bollinger Bands and Keltner Channels, it also detects "squeeze" conditions, highlighting periods of reduced volatility, often preceding explosive price movements.
The indicator further features visual aids, including colored zones, plotted volatility cycles, and highlighted horizontal levels to interpret market conditions effectively. Alerts for key events, such as volatility crossing significant thresholds or entering a squeeze, make it an ideal tool for proactive trading.
Key Features:
Volatility Measurement:
Tracks the Volatility Cycle, normalized using standard deviation and ATR.
Helps identify periods of high and low volatility in the market.
Volatility Zones:
Colored zones represent varying levels of market volatility:
Blue Zone: Low volatility (0.5–0.75).
Orange Zone: Transition phase (0.75–1.0).
Green Zone: Moderate volatility (1.0–1.5).
Fuchsia Zone: High volatility (1.5–2.0).
Red Zone: Extreme volatility (>2.0).
Squeeze Detection:
Identifies when Bollinger Bands contract within Keltner Channels, signaling a volatility squeeze.
Alerts are triggered for potential breakout opportunities.
Visual Enhancements:
Dynamic coloring of the Volatility Cycle for clarity on its momentum and direction.
Plots multiple horizontal levels for actionable insights into market conditions.
Alerts:
Sends alerts when the Volatility Cycle crosses significant levels (e.g., 0.75) or when a squeeze condition is detected.
Non-Directional Nature:
The indicator does not predict the market's direction but rather highlights periods of potential movement, making it suitable for both trend-following and mean-reversion strategies.
How to Trade with This Indicator:
Volatility Squeeze Breakout:
When the indicator identifies a squeeze (volatility compression), prepare for a breakout in either direction.
Use additional directional indicators or chart patterns to determine the likely breakout direction.
Crossing Volatility Levels:
Pay attention to when the Volatility Cycle crosses the 0.75 level:
Crossing above 0.75 indicates increasing volatility—ideal for trend-following strategies.
Crossing below 0.75 signals decreasing volatility—consider mean-reversion strategies.
Volatility Zones:
Enter positions as volatility transitions through key zones:
Low volatility (Blue Zone): Watch for breakout setups.
Extreme volatility (Red Zone): Be cautious of overextended moves or reversals.
Alerts for Proactive Trading:
Configure alerts for squeeze conditions and level crossings to stay updated without constant monitoring.
Best Practices:
Pair the Volatility Cycle Indicator with directional indicators such as moving averages, trendlines, or momentum oscillators to improve trade accuracy.
Use on multiple timeframes to align entries with broader market trends.
Combine with risk management techniques, such as ATR-based stop losses, to handle volatility spikes effectively.

Hodrick-Prescott Cycle Component (YavuzAkbay)The Hodrick-Prescott Cycle Component indicator in Pine Script™ is an advanced tool that helps traders isolate and analyze the cyclical deviations in asset prices from their underlying trend. This script calculates the cycle component of the price series using the Hodrick-Prescott (HP) filter, allowing traders to observe and interpret the short-term price movements around the long-term trend. By providing two views—Percentage and Price Difference—this indicator gives flexibility in how these cyclical movements are visualized and interpreted.
What This Script Does
This indicator focuses exclusively on the cycle component of the price, which is the deviation of the current price from the long-term trend calculated by the HP filter. This deviation (or "cycle") is what traders analyze for mean-reversion opportunities and overbought/oversold conditions. The script allows users to see this deviation in two ways:
Percentage Difference: Shows the deviation as a percentage of the trend, giving a normalized view of the price’s distance from its trend component.
Price Difference: Shows the deviation in absolute price terms, reflecting how many price units the price is above or below the trend.
How It Works
Trend Component Calculation with the HP Filter: Using the HP filter, the script isolates the trend component of the price. The smoothness of this trend is controlled by the smoothness parameter (λ), which can be adjusted by the user. A higher λ value results in a smoother trend, while a lower λ value makes it more responsive to short-term changes.
Cycle Component Calculation: Percentage Deviation (cycle_pct) calculated as the difference between the current price and the trend, divided by the trend, and then multiplied by 100. This metric shows how far the price deviates from the trend in relative terms. Price Difference (cycle_price) simply the difference between the current price and the trend component, displaying the deviation in absolute price units.
Conditional Plotting: The user can choose to view the cycle component as either a percentage or a price difference by selecting the Display Mode input. The indicator will plot the chosen mode in a separate pane, helping traders focus on the preferred measure of deviation.
How to Use This Indicator
Identify Overbought/Oversold Conditions: When the cycle component deviates significantly from the zero line (shown with a dashed horizontal line), it may indicate overbought or oversold conditions. For instance, a high positive cycle component suggests the price may be overbought relative to the trend, while a large negative cycle suggests potential oversold conditions.
Mean-Reversion Strategy: In mean-reverting markets, traders can use this indicator to spot potential reversal points. For example, if the cycle component shows an extreme deviation from zero, it could signal that the price is likely to revert to the trend. This can help traders with entry and exit points when the asset is expected to correct back toward its trend.
Trend Strength and Cycle Analysis: By comparing the magnitude and duration of deviations, traders can gauge the strength of cycles and assess if a new trend might be forming. If the cycle component remains consistently positive or negative, it may indicate a persistent market bias, even as prices fluctuate around the trend.
Percentage vs. Price Difference Views: Use the Percentage Difference mode to standardize deviations and compare across assets or different timeframes. This is especially helpful when analyzing assets with varying price levels. Use the Price Difference mode when an absolute deviation (price units) is more intuitive for spotting overbought/oversold levels based on the asset’s actual price.
Using with Hodrick-Prescott: You can also use Hodrick-Prescott, another indicator that I have adapted to the Tradingview platform, to see the trend on the chart, and you can also use this indicator to see how far the price is deviating from the trend. This gives you a multifaceted perspective on your trades.
Practical Tips for Traders
Set the Smoothness Parameter (λ): Adjust the λ parameter to match your trading timeframe and asset characteristics. Lower values make the trend more sensitive, which might suit short-term trading, while higher values smooth out the trend for long-term analysis.
Cycle Component as Confirmation: Combine this indicator with other momentum or trend indicators for confirmation of overbought/oversold signals. For example, use the cycle component with RSI or MACD to validate the likelihood of mean-reversion.
Observe Divergences: Divergences between price movements and the cycle component can indicate potential reversals. If the price hits a new high, but the cycle component shows a smaller deviation than previous highs, it could signal a weakening trend.

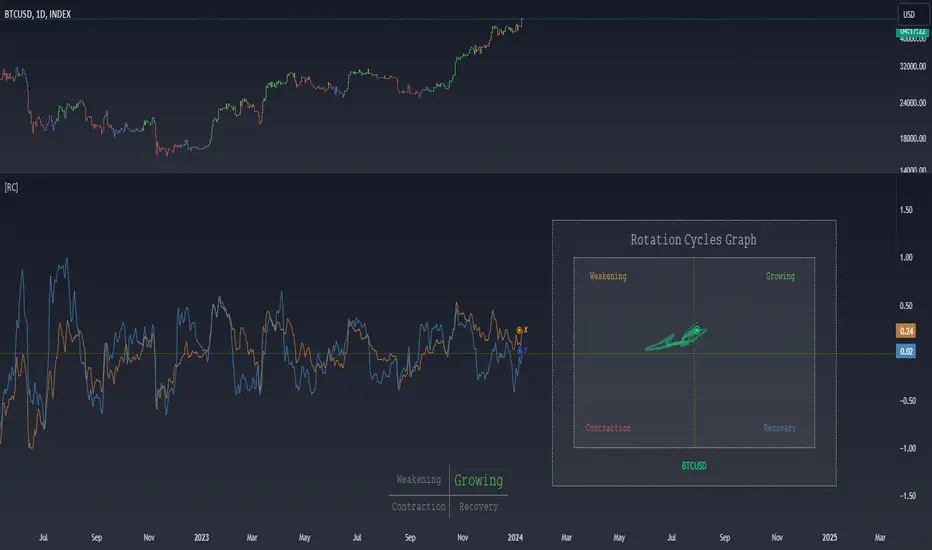
Rotation Cycles GraphRotation Cycles Graph Indicator
Overview:
The Rotation Cycles Graph Indicator is designed to visualize rotation cycles in financial markets. It aims to provide insights into shifts between various market phases, including growth, weakening, recovery, and contraction, allowing traders to potentially identify changing market dynamics.
Key Components:
Z-Score Calculation:
The indicator employs Z-score calculation to normalize data and identify deviations from the mean. This is instrumental in understanding the current state of the market relative to its historical behavior.
Ehlers Loop Visualization:
The Ehlers Loop function generates a visual representation of rotation cycles. It utilizes x and y coordinates on the chart to represent market conditions. These coordinates determine the position and categorization of the market state.
Table Visualization:
At the bottom of the chart, a table categorizes market conditions based on x and y values. This table serves as a reference to understand the current market phase.
Customizable Parameters:
The indicator offers users the flexibility to adjust several parameters:
Length and Smoothness: Users can set the length and smoothness parameters for the Z-score calculation, allowing for customization based on the market's volatility.
Graph Settings: Parameters such as bar scale, graph position, and the length of the tail for visualization can be fine-tuned to suit individual preferences.
Understanding Coordinates:
The x and y coordinates plotted on the chart represent specific market conditions. Interpretation of these coordinates aids in recognizing shifts in market behavior.
This screenshot shows visual representation behind logic of X and Y and their rotation cycles
Here is an example how rotation marker moved from growing to weakening and to the contraction quad, during a big market crush:
Note:
This indicator is a visualization tool and should be used in conjunction with other analytical methods for comprehensive market analysis.
Understanding the context and nuances of market dynamics is essential for accurate interpretation of the Rotation Cycles Graph Indicator.
Big thanks to @PineCodersTASC for their indicator, what I used as a reference
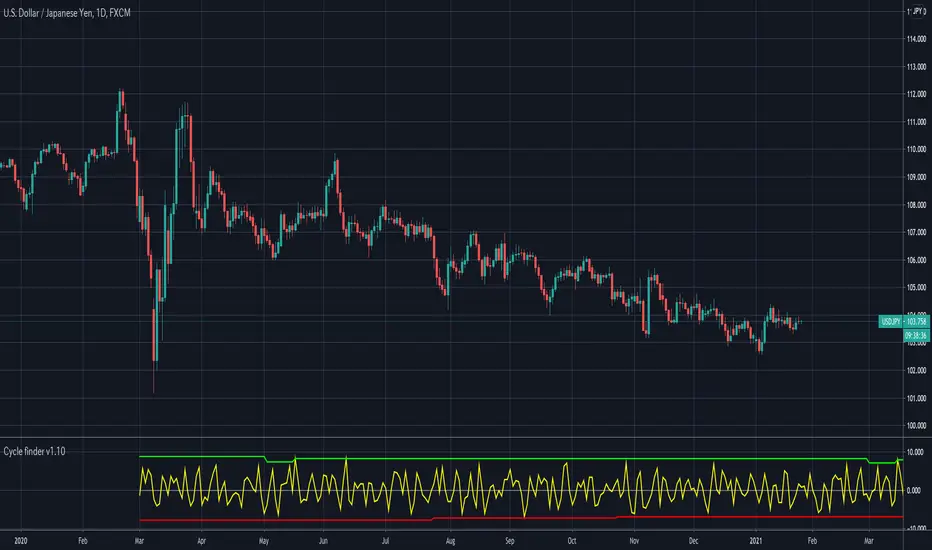
Cycle finder v1.0Watch this Morgan Stanley'(MS)'s almost perfect cycle!
This is Cycle finder v1.0.
This helps you to find cycle of your favorite stocks, commodities, forex and anything in real time.
Originally developed from scratch for tradingview.
How to use(in setting panel):
- Set up to 5 different cycle term.
- Set go back bars. *1
- Shift bars as you want to make use of cycle.
*1: This indicator compares X bar to X - (go back amount) bar to find cycle. Default: 2
*2: It won’t work if there is not enough history.
*3: This may contains some bugs since I'm still working in progress to improve.
Please give it try for 1 week free.
Message me or reply to here to unlock your experience!
//—————— Japanese below
このモルガンスタンレー(MS)のほとんど完璧なサイクルをご覧ください。
Cycle finder v1.0. をご紹介します。
Tradingview のために1から開発された、このインディケーターは
あなたのお気に入りの株、先物、FXなどのサイクルをリアルタイムに見つけるお手伝いをします。
使い方 (設定パネル):
- 5個までサイクルの期間を設定できます。
- 参照のバー数を設定 *1
- サイクルは左右にシフトできます。
*1: このインディケーターは、サイクルを見つけるために
Xバーと、X - 参照バー数を比べます。 デフォルトでは2です。
*2: チャートの履歴が少ない場合には、動きません。
*3: ブラッシュアップ中のため、バグを含む可能性があります。
ぜひ1週間無料でお試しください。
プライベートメッセージか、ここにご返信ください。
CSI Cycle Swing MomentumAdaptive Ultra-Smooth Momentum (Cycle-Swing Indicator – CSI)
The Cycle-Swing Indicator (CSI) is an advanced, adaptive momentum oscillator designed to extract clean, reliable signals from market data by focusing on the swing of the dominant market cycle rather than raw momentum. By identifying and aligning with the current dominant cycle, the CSI produces a momentum curve that is exceptionally smooth, responsive, and context-aware.
Key Advantages
The CSI offers several improvements over traditional momentum-based indicators:
Ultra-smooth signal line without sacrificing responsiveness
Zero-lag behavior, enabling timely entries and exits
Pronounced turning-point precision, enhancing signal clarity
Adaptive to real market cycles, automatically adjusting to changing conditions
Reliable deviation and divergence detection, even in noisy environments
Why Standard Indicators Fall Short
Conventional oscillators often struggle in real-world market conditions:
Excessive noise leads to frequent false signals.
Added smoothing reduces noise but introduces significant lag, delaying actionable insights.
Fixed-length parameters make indicators highly sensitive to user settings—you never truly know the "right" length.
The CSI solves all these challenges through its adaptive cyclic algorithm, which automatically aligns itself with the market’s dominant cycle—no manual tuning required.
Practical Example
In the example chart, the CSI highlights clear turning points and deviations with far less noise than the standard momentum indicator, demonstrating its superior clarity and responsiveness.
How to Use
The CSI is fully adaptive and requires no parameters. Simply apply it to any symbol and timeframe—the indicator automatically detects the dominant cycle and produces an ultra-smooth, cycle-aligned momentum curve.
Included features:
Adaptive upper and lower bands identifying extreme conditions
Automatic divergence detection (toggle on/off)
Works on any timeframe and any asset
Adaptive length - no input parameter required
How to Read the Indicator
The CSI functions similarly to a traditional momentum oscillator but with enhanced adaptive context:
Look for divergences between price and the CSI signal line — powerful early warnings of weakening trends or impending shifts.
Note on Divergence Signals:
The divergence markers displayed on the chart are generated using embedded pivot-based detection. Because pivots must be confirmed by price action, divergence signals can only be plotted after a pivot forms. For real-time monitoring on the latest bar, users should watch for early-forming divergences as they develop, since confirmed pivot-based divergences will always appear with a slight delay. Script parameters are available for precise adjustment of pivot detection behaviour.
Info: Legacy vs. Pro Version
This is the actively maintained and continuously enhanced edition of my free, open-source indicator “Cycle Swing Momentum”. The Pro Version will remain fully up to date with the latest Pine Script standards and will receive ongoing refinements and feature improvements, all while preserving the core logic and intent of the original tool. The legacy version will continue to be available for code review and educational purposes, but it will no longer receive updates. The legacy open-source version is always available in the public TV indicator repository.
Paid script

CSI Cycle Swing Momentum Indicator ProAdaptive Ultra-Smooth Momentum (Cycle-Swing Indicator – CSI)
The Cycle-Swing Indicator (CSI) is an advanced, adaptive momentum oscillator designed to extract clean, reliable signals from market data by focusing on the swing of the dominant market cycle rather than raw momentum. By identifying and aligning with the current dominant cycle, the CSI produces a momentum curve that is exceptionally smooth, responsive, and context-aware.
Key Advantages
The CSI offers several improvements over traditional momentum-based indicators:
Ultra-smooth signal line without sacrificing responsiveness
Zero-lag behavior, enabling timely entries and exits
Pronounced turning-point precision, enhancing signal clarity
Adaptive to real market cycles, automatically adjusting to changing conditions
Reliable deviation and divergence detection, even in noisy environments
Why Standard Indicators Fall Short
Conventional oscillators often struggle in real-world market conditions:
Excessive noise leads to frequent false signals.
Added smoothing reduces noise but introduces significant lag, delaying actionable insights.
Fixed-length parameters make indicators highly sensitive to user settings—you never truly know the "right" length.
The CSI solves all these challenges through its adaptive cyclic algorithm, which automatically aligns itself with the market’s dominant cycle—no manual tuning required.
Practical Example
In the example chart, the CSI highlights clear turning points and deviations with far less noise than the standard momentum indicator, demonstrating its superior clarity and responsiveness.
How to Use
The CSI is fully adaptive and requires no parameters. Simply apply it to any symbol and timeframe—the indicator automatically detects the dominant cycle and produces an ultra-smooth, cycle-aligned momentum curve.
Included features:
Adaptive upper and lower bands identifying extreme conditions
Automatic divergence detection (toggle on/off)
Works on any timeframe and any asset
Adaptive length - no input parameter required
How to Read the Indicator
The CSI functions similarly to a traditional momentum oscillator but with enhanced adaptive context:
Look for divergences between price and the CSI signal line — powerful early warnings of weakening trends or impending shifts.
Note on Divergence Signals:
The divergence markers displayed on the chart are generated using embedded pivot-based detection. Because pivots must be confirmed by price action, divergence signals can only be plotted after a pivot forms. For real-time monitoring on the latest bar, users should watch for early-forming divergences as they develop, since confirmed pivot-based divergences will always appear with a slight delay. Script parameters are available for precise adjustment of pivot detection behaviour.
Info: Legacy vs. Pro Version
This is the actively maintained and continuously enhanced edition of my free, open-source indicator “Cycle Swing Momentum”. The Pro Version will remain fully up to date with the latest Pine Script standards and will receive ongoing refinements and feature improvements, all while preserving the core logic and intent of the original tool. The legacy version will continue to be available for code review and educational purposes, but it will no longer receive updates. The legacy open-source version is always available in the public TV indicator repository.

W%R Cycle Swings - MTF Trend📄 English Description
Overview
The W%R Cycle Swings – MTF Trend indicator is a market-structure tool built on top of Williams %R cycle logic. It detects meaningful swing highs and lows from W%R behavior, then uses those swings to locate the first Market Structure Shift (MSS-first) and track multi-timeframe trend bias + cancel levels.
This is not a random mashup of indicators: all components are derived from one core concept—W%R cycles—and are combined into a single, coherent framework for reading structure and trend across timeframes.
Core Concepts
1. Williams %R Cycle Swings (Current Timeframe)
Instead of using price swings based only on highs/lows, this script uses Williams %R behavior to define swing points:
Swing High pattern: OS → OB → OS
Swing Low pattern: OB → OS → OB
The script:
Tracks overbought/oversold states using user-defined levels.
Builds a zone for each potential swing (accumulating the extremums during the OB/OS phase).
Confirms a swing only when the opposite state appears again.
Plots labels on the chart:
Swing High label above price
Swing Low label below price
Optional price display on the label (toggle in settings).
This makes the swing points cycle-based rather than purely bar-based.
2. MSS-first (Market Structure Shift on Current TF)
Once swings are defined, the script looks for the first break of the most recent swing:
Bullish MSS-first: price breaks above the last confirmed swing high.
Bearish MSS-first: price breaks below the last confirmed swing low.
You can choose whether to confirm by close or by wick (mssByClose input).
When an MSS-first is detected:
A colored label (bullish/bearish) is drawn at the relevant swing level.
A horizontal line is drawn from the swing bar to the MSS bar to visually connect the structure break.
Internal trendBias is updated to Up or Down, preventing duplicate MSS labels in the same direction.
This gives a clear, visual definition of when the structure actually shifted based on W%R-driven swings.
3. MTF MSS-first Trend & Cancel Logic
The same MSS-first concept is applied inside a function and called via request.security() on multiple timeframes (5m, 15m, 30m, 1h, 4h).
For each timeframe, the function:
Recalculates W%R swings with the same parameters.
Detects MSS-first events (bullish or bearish).
Tracks a trend state:
1 → Up trend
-1 → Down trend
0 → Unknown / Neutral
Maintains a cancel level, which represents the price that would invalidate the current trend:
In an uptrend, cancel is typically the last relevant swing low.
In a downtrend, cancel is typically the last relevant swing high.
This provides:
Trend direction per TF (Up / Down / -)
A concrete price level that acts as a structural “stop” or invalidation level.
4. MTF Trend Table (Visual Overview)
If enabled, a compact table is displayed on the chart (position configurable):
Columns: 5m, 15m, 30m, 1h, 4h
Rows:
Trend → shows Up, Down or -, with color-coded background.
Cancel → shows the current cancel price for that timeframe.
This creates a multi-timeframe structure dashboard that tells you:
Which timeframes are currently in an Up or Down MSS-based trend.
At which price the current structural view would be canceled.
5. Alert Conditions
The script includes alert conditions for:
Current timeframe MSS-first:
Bullish MSS-first (structure break up).
Bearish MSS-first (structure break down).
MTF MSS-first events for:
5m, 15m, 30m, 1h, 4h (Bullish & Bearish separately).
This allows you to receive notifications when a fresh structural shift happens on any of the tracked timeframes.
How to Use
Use Swing High / Swing Low labels to understand the current W%R cycle structure on your main timeframe.
Watch for MSS-first labels to catch the first break of structure after a swing completes.
Use the MTF Trend table:
Trade in the direction of higher-timeframe trends.
Use cancel levels as logical invalidation areas or structural stop guides.
Combine the current timeframe swings with MTF bias:
Example: look for long setups when H1/H4 show Up trend and price forms new bullish MSS on lower TF.
The tool is suitable for both intraday and swing trading, on any symbol and timeframe.
Why This Script Is Original
It links cycle-based swings from Williams %R directly to MSS-first detection, rather than using generic pivot logic.
It combines:
W%R-driven swing definition,
MSS-first structural breaks,
Multi-timeframe trend state,
Cancel (invalidation) levels,
Alerts for MSS events on multiple TFs,
into a single, coherent market-structure framework.
The MTF table is not a generic dashboard: it is specifically built around this W%R-MSS-first structural model, which gives traders both trend context and exact invalidation prices.
🇹🇭 Thai Description — คำอธิบายภาษาไทย
ภาพรวม
อินดิเคเตอร์ W%R Cycle Swings – MTF Trend เป็นเครื่องมืออ่านโครงสร้างราคา โดยใช้ “วงจรของ Williams %R” เป็นหลักในการหา Swing High / Swing Low แล้วใช้จุด Swing เหล่านั้นมาหา MSS-first (จุดเปลี่ยนโครงสร้างครั้งแรก) จากนั้นต่อยอดไปสู่ การดูแนวโน้มหลายกรอบเวลา + ระดับ Cancel (จุดที่โครงสร้างจะถูกมองว่าพัง)
แนวคิดหลัก
Swing จาก Williams %R (TF ปัจจุบัน)
ใช้รูปแบบ OS → OB → OS เพื่อยืนยัน Swing High
และ OB → OS → OB เพื่อยืนยัน Swing Low
เมื่อยืนยันแล้วจะสร้าง Label “Swing High / Swing Low” บนกราฟ และสามารถแสดงราคาบนป้ายได้
ทำให้จุด Swing มีพื้นฐานจาก “Cycle ของ W%R” ไม่ใช่แค่ high/low เฉย ๆ
MSS-first บน TF ปัจจุบัน
ถ้าราคาทะลุ Swing High ล่าสุด → มองเป็น Bullish MSS-first
ถ้าราคาทะลุ Swing Low ล่าสุด → มองเป็น Bearish MSS-first
เลือกได้ว่าจะยืนยันจาก Close หรือจาก ไส้แท่งเทียน
วาดป้าย MSS + เส้นเชื่อมจาก Swing ไปยังจุดที่เกิด MSS
มีตัวแปร trendBias ป้องกันไม่ให้ยิง MSS ซ้ำในทิศทางเดิมจนรก
MTF MSS-first + Cancel Logic
นำ Logic เดียวกันไปใช้กับ TF: 5m, 15m, 30m, 1h, 4h
สำหรับแต่ละ TF จะได้:
สถานะแนวโน้ม: Up / Down / Unknown
ระดับ Cancel: ราคาที่ถ้าหลุดจะถือว่าโครงสร้างเทรนด์นั้นถูก “ยกเลิก”
เช่น ในเทรนด์ขาขึ้น ระดับ Cancel มักมาจาก Swing Low ล่าสุด ฯลฯ
MTF Table บนกราฟ
แสดง Trend + Cancel ของ 5 TF ในรูปแบบตาราง
อ่านง่าย: แถว Trend เป็น Up/Down พร้อมสีพื้น, แถว Cancel เป็นตัวเลขราคา
ใช้ดูภาพรวมโครงสร้างหลาย TF ในมุมมองเดียว
Alert Conditions
แจ้งเตือน MSS-first ของ TF ปัจจุบัน
แจ้งเตือน MSS-first ของ TF 5m / 15m / 30m / 1h / 4h แยก Bull / Bear
วิธีใช้งาน
ใช้ Swing High / Swing Low เพื่อดูว่าโครงสร้าง cycle ปัจจุบันอยู่ตรงไหน
รอให้เกิด MSS-first เพื่อมองว่า “โครงสร้างราคาเริ่มกลับตัวแล้ว”
ใช้ Table MTF:
ดูว่า TF ไหนเป็น Up / Down
ใช้ราคาบรรทัด Cancel เป็นแนว “จุดตัดขาดทุนเชิงโครงสร้าง” หรือจุดเปลี่ยนมุมมอง
เทรดตามทิศทาง TF ใหญ่ แล้วหา Entry จาก MSS ของ TF เล็ก
จุดเด่น / ความเป็น Original
ใช้ Williams %R เป็นฐานในการสร้าง Swing Pattern แทนการใช้ Pivot ธรรมดา
เชื่อม W%R Swing เข้ากับแนวคิด MSS-first อย่างเป็นระบบ
มีทั้ง:
ป้าย Swing
ป้าย MSS + เส้นเชื่อม
MTF Trend + Cancel
Alert เตือน MSS ในหลาย TF
อยู่ในสคริปต์เดียว
เหมาะกับคนที่ต้องการอ่านโครงสร้างราคาแบบมีที่มาที่ไป ไม่ใช่แค่ตามอินดี้ตัวเดียวครับ ✅

LRI Momentum Cycles [AlgoAlpha]Discover the LRI Momentum Cycles indicator by AlgoAlpha, a cutting-edge tool designed to identify market momentum shifts using trend normalization and linear regression analysis. This advanced indicator helps traders detect bullish and bearish cycles with enhanced accuracy, making it ideal for swing traders and intraday enthusiasts alike.
Key Features :
🎨 Customizable Appearance : Set personalized colors for bullish and bearish trends to match your charting style.
🔧 Dynamic Trend Analysis : Tracks market momentum using a unique trend normalization algorithm.
📊 Linear Regression Insight : Calculates real-time trend direction using linear regression for better precision.
🔔 Alert Notifications : Receive alerts when the market switches from bearish to bullish or vice versa.
How to Use :
🛠 Add the Indicator : Favorite and apply the indicator to your TradingView chart. Adjust the lookback period, linear regression source, and regression length to fit your strategy.
📊 Market Analysis : Watch for color changes on the trend line. Green signals bullish momentum, while red indicates bearish cycles. Use these shifts to time entries and exits.
🔔 Set Alerts : Enable notifications for momentum shifts, ensuring you never miss critical market moves.
How It Works :
The LRI Momentum Cycles indicator calculates trend direction by applying linear regression on a user-defined price source over a specified period. It compares historical trend values, detecting bullish or bearish momentum through a dynamic scoring system. This score is normalized to ensure consistent readings, regardless of market conditions. The indicator visually represents trends using gradient-colored plots and fills to highlight changes in momentum. Alerts trigger when the momentum state changes, providing actionable trading signals.

Pi Cycle Bitcoin Top and Bottom (Daily)Pi Cycle Bitcoin Top and Bottom (Daily)
This indicator combines the renowned Pi Cycle Top and Pi Cycle Bottom indicators into one comprehensive tool designed to identify Bitcoin's market cycle tops and bottoms with precision.
Pi Cycle Top
The Pi Cycle Top indicator uses the 111-day moving average (111DMA) and a multiple of the 350-day moving average (350DMA x 2). Historically, this indicator has identified Bitcoin’s price cycle peaks with an accuracy of up to 3 days.
📈 When the 111DMA crosses above the 350DMA x 2, it signals a market cycle top.
Pi Cycle Bottom
The Pi Cycle Bottom indicator utilizes the 150-day exponential moving average (150EMA) and a multiple of the 471-day simple moving average (471SMA x 0.745). Over past cycles, this combination has effectively pinpointed Bitcoin’s market bottoms with the same level of accuracy.
📉 When the 150EMA crosses below the 471SMA x 0.745, it signals a market cycle bottom.
Parabola
As an additional feature, the indicator identifies moments when the 150EMA crosses back above the 471SMA x 0.745, suggesting a potential parabolic price movement.
Features
Precision: Both indicators have historically aligned with major market turning points.
Customizable settings: Adjust the short and long moving averages to fit your analysis needs.
Alerts: Real-time alerts can be enabled for identifying market tops and bottoms.
Clear visualization: Optional moving average lines and signal markers make it easy to track market trends.
Full credits to Philip Swift, PositiveCrypto, Tondy, BilzerianCandle.

Cycles 90mThe cycles are separated by vertical lines. The first cycle (Q1) is marked with a red line because it is a manipulative cycle where you should not open positions. Other cycles are green (Q2, Q3, Q4).
You can add the time of the current candle, its size and position on the chart in the settings
The time is highlighted in red in the timeframes 9:30-9:40, 10:00-10:10, 11:00-11:30, 15:30-15:40, 16:00-16:10, 17:00-17:10, 17:30-17:40, as price movements are most often expected during these timeframes.
The cycle lines automatically disappear if you open a timeframe above M15

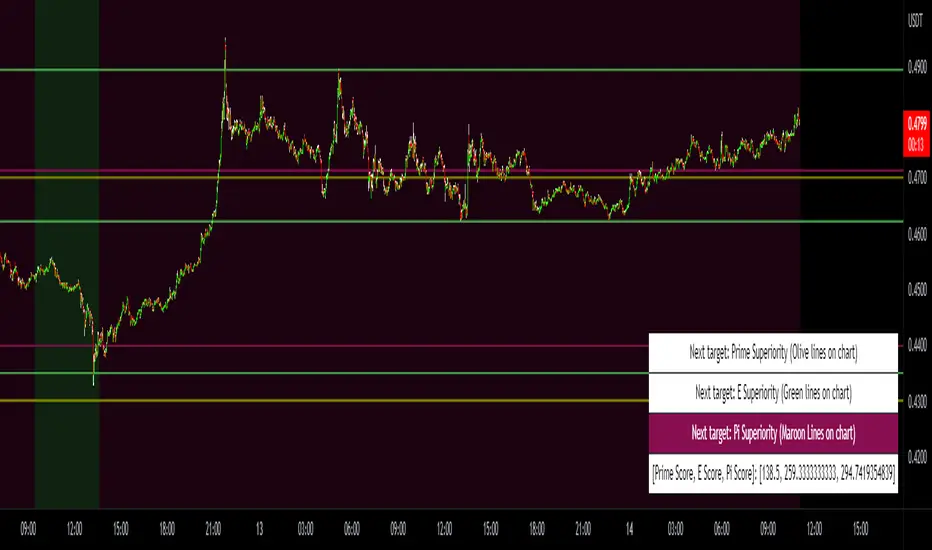
Prime, E & PI Superiority CyclesIf you have been studying the markets long enough you will probably have noticed a certain pattern. Whichever trade entry/exit logic you try to use, it will go through phases of working really well and phases where it doesn't work at all. This is the markets way of ensuring anyone who sticks to an oversimplified, one-dimensional strategy will not profit. Superiority cycles are a method I devised by which code interrogates the nature of where price has been pivoting in relation to three key structures, the Prime Frame, E Frame and Pi Frame which are plotted as horizontal lines at these values:
* Use script on 1 minute chart ONLY
prime numbers up to 100: 2.0,3.0,5.0,7.0,11.0,13.0,17.0,19.0,23.0,27.0,29.0,31.0,37.0,41.0,43.0,47.0,53.0,59.0,61.0,67.0,71.0,73.0,79.0,83.0,89.0,97.0
multiples of e up to 100: 2.71828, 5.43656, 8.15484, 10.87312, 13.5914, 16.30968, 19.02796, 21.74624, 24.46452, 27.1828, 29.90108, 32.61936, 35.33764,
38.05592, 40.7742, 43.49248, 46.21076, 48.92904, 51.64732, 54.3656, 57.08388, 59.80216, 62.52044, 65.23872, 67.957, 70.67528, 73.39356000000001, 76.11184,
78.83012, 81.5484, 84.26668000000001, 86.98496, 89.70324, 92.42152, 95.13980000000001, 97.85808
multiples of pi up to 100: 3.14159, 6.28318, 9.424769999999999, 12.56636, 15.70795, 18.849539999999998, 21.99113, 25.13272, 28.27431, 31.4159, 34.55749,
37.699079999999995, 40.840669999999996, 43.98226, 47.12385, 50.26544, 53.40703, 56.54862, 59.69021, 62.8318, 65.97339, 69.11498, 72.25657, 75.39815999999999,
78.53975, 81.68133999999999, 84.82293, 87.96452, 91.10611, 94.2477, 97.38929
These values are iterated up the chart as seen below:
The script sums the distance of pivots to each of the respective frames (olive lines for Prime Frame, green lines for E Frame and maroon lines for Pi Frame) and determines which frame price has been reacting to in the least significant way. The worst performing frame is the next frame we target reversals at. The table in the bottom right will light up a color that corresponds to the frame color we should target.
Here is an example of Prime Superiority, where we prioritize trading from prime levels:
The table and the background color are both olive which means target prime levels. In an ideal world strong moves should start and finish where the white flags are placed i.e. in this case $17k and $19k. The reason these levels are 17,000 and 19,000 and not just 17 and 19 like in the original prime number sequence is due to the scaling code in the get_scale_func() which allows the code to operate on all assets.
This is E Superiority where we would hope to see major reversals at green lines:
This is Pi Superiority where we would hope to see major reversals at maroon lines:
And finally I would like to show you a market moving from one superiority to another. This can be observed by the bgcolor which tells us what the superiority was at every historical minute
Pi Frame Superiority into E Frame Superiority example:
Prime Frame Superiority into E Frame Superiority example:
Prime Frame Superiority into Pi Frame Superiority example:
By rotating the analysis we use to enter trades in this way we hope to hide our strategy better from market makers and artificial intelligence, and overall make greater profits.
Bitcoin Pi Cycle TrackerThe Bitcoin Pi Cycle Tracker is based on the widely recognized Pi Cycle Top Indicator, a concept used to identify potential market cycle tops in Bitcoin's price. This implementation combines the 111-day Simple Moving Average (SMA) and the 350-day SMA (multiplied by 2) to detect key crossover points. When the 111-day SMA crosses above the 350-day SMA x2, it signals a potential market peak.
Key Features:
Plots the 111-day SMA (blue) and the 350-day SMA x2 (red) for clear visualization.
Displays visual markers and vertical lines at crossover points to highlight key moments.
Sends alerts for crossovers, helping traders stay ahead of market movements.
This tool is an implementation of the Pi Cycle concept originally popularized by Bitcoin market analysts. Use it to analyze historical price cycles and prepare for significant market events. Please note that while the Pi Cycle Indicator has been historically effective, it should be used alongside other tools for a comprehensive trading strategy.

Bitcoin Cycle Master [InvestorUnknown]The "Bitcoin Cycle Master" indicator is designed for in-depth, long-term analysis of Bitcoin's price cycles, using several key metrics to track market behavior and forecast potential price tops and bottoms. The indicator integrates multiple moving averages and on-chain metrics, offering a comprehensive view of Bitcoin’s historical and projected performance. Each of its components plays a crucial role in identifying critical cycle points:
Top Cap: This is a multiple of the Average Cap, which is calculated as the cumulative sum of Bitcoin’s price (price has a longer history than Market Cap) divided by its age in days. Top Cap serves as an upper boundary for speculative price peaks, multiplied by a factor of 35.
Time_dif() =>
date = ta.valuewhen(bar_index == 0, time, 0)
sec_r = math.floor(date / 1000)
min_r = math.floor(sec_r / 60)
h_r = math.floor(min_r / 60)
d_r = math.floor(h_r / 24)
// Launch of BTC
start = timestamp(2009, 1, 3, 00, 00)
sec_rb = math.floor(start / 1000)
min_rb = math.floor(sec_rb / 60)
h_rb = math.floor(min_rb / 60)
d_rb = math.floor(h_rb / 24)
difference = d_r - d_rb
AverageCap() =>
ta.cum(btc_price) / (Time_dif() + btc_age)
TopCap() =>
// To calculate Top Cap, it is first necessary to calculate Average Cap, which is the cumulative sum of Market Cap divided by the age of the market in days.
// This creates a constant time-based moving average of market cap.
// Once Average cap is calculated, those values are multiplied by 35. The result is Top Cap.
// For AverageCap the BTC price was used instead of the MC because it has more history
// (the result should have minimal if any deviation since MC would have to be divided by Supply)
AverageCap() * 35
Delta Top: Defined as the difference between the Realized Cap and the Average Cap, this metric is further multiplied by a factor of 7. Delta Top provides a historically reliable signal for Bitcoin market cycle tops.
DeltaTop() =>
// Delta Cap = Realized Cap - Average Cap
// Average Cap is explained in the Top Cap section above.
// Once Delta Cap is calculated, its values over time are then multiplied by 7. The result is Delta Top.
(RealizedPrice() - AverageCap()) * 7
Terminal Price: Derived from Coin Days Destroyed, Terminal Price normalizes Bitcoin’s historical price behavior by its finite supply (21 million bitcoins), offering an adjusted price forecast as all bitcoins approach being mined. The original formula for Terminal Price didn’t produce expected results, hence the calculation was adjusted slightly.
CVDD() =>
// CVDD stands for Cumulative Value Coin Days Destroyed.
// Coin Days Destroyed is a term used for bitcoin to identify a value of sorts to UTXO’s (unspent transaction outputs). They can be thought of as coins moving between wallets.
(MCR - TV) / 21000000
TerminalPrice() =>
// Theory:
// Before Terminal price is calculated, it is first necessary to calculate Transferred Price.
// Transferred price takes the sum of > Coin Days Destroyed and divides it by the existing supply of bitcoin and the time it has been in circulation.
// The value of Transferred Price is then multiplied by 21. Remember that there can only ever be 21 million bitcoin mined.
// This creates a 'terminal' value as the supply is all mined, a kind of reverse supply adjustment.
// Instead of heavily weighting later behavior, it normalizes historical behavior to today. By normalizing by 21, a terminal value is created
// Unfortunately the theoretical calculation didn't produce results it should, in pinescript.
// Therefore the calculation was slightly adjusted/improvised
TransferredPrice = CVDD() / (Supply * math.log(btc_age))
tp = TransferredPrice * 210000000 * 3
Realized Price: Calculated as the Market Cap Realized divided by the current supply of Bitcoin, this metric shows the average value of Bitcoin based on the price at which coins last moved, giving a market consensus price for long-term holders.
CVDD (Cumulative Value Coin Days Destroyed): This on-chain metric analyzes Bitcoin’s UTXOs (unspent transaction outputs) and the velocity of coins moving between wallets. It highlights key market dynamics during prolonged accumulation or distribution phases.
Balanced Price: The Balanced Price is the difference between the Realized Price and the Terminal Price, adjusted by Bitcoin's supply constraints. This metric provides a useful signal for identifying oversold market conditions during bear markets.
BalancedPrice() =>
// It is calculated by subtracting Transferred Price from Realized Price
RealizedPrice() - (TerminalPrice() / (21 * 3))
Each component can be toggled individually, allowing users to focus on specific aspects of Bitcoin’s price cycle and derive meaningful insights from its long-term behavior. The combination of these models provides a well-rounded view of both speculative peaks and long-term value trends.
Important consideration:
Top Cap did historically provide reliable signals for cycle peaks, however it may not be a relevant indication of peaks in the future.

Muzyorae - Quarterly CyclesQuarterly Theory — NY Session Macro Model
The Quarterly Theory is a time-based framework for analyzing intraday market behavior during the New York session. It divides the session into four sequential quarters (Q1–Q4), each reflecting institutional activity, liquidity accumulation, and directional bias.
Q1 – Accumulation (9:30–10:00 AM): Early positioning, initial liquidity sweeps, and potential early breakouts (AMDX - XAMD patterns).
Q2 – Manipulation/Expansion (10:00–11:30 AM): Main directional move with structure breaks, fair value gaps, and liquidity sweeps.
Q3 – Distribution/Retracement (11:30 AM–1:30 PM): Consolidation, profit-taking, and market chop.
Q4 – Final Expansion/Repricing (1:30–4:00 PM): Trend continuation, reversals, and session high/low formation.
Key Features:
Fractal-based cycles scalable across intraday or multi-day timeframes.
Supports AMDX (Accumulation → Manipulation → Distribution → Expansion) and XAMD reversal sequences.
Highlights early Q1 expansions, Q2 open reference, and critical liquidity zones.
Fully synchronized to NY time and compatible with ICT concepts (SMT, FVGs, OBs, BOS).
Professional visualization with optional labels and vertical markers.
Purpose:
Provides traders a systematic framework to align with institutional flow, anticipate liquidity accumulation, identify optimal entry/exit zones, and structure trades around high-probability intraday cycles.

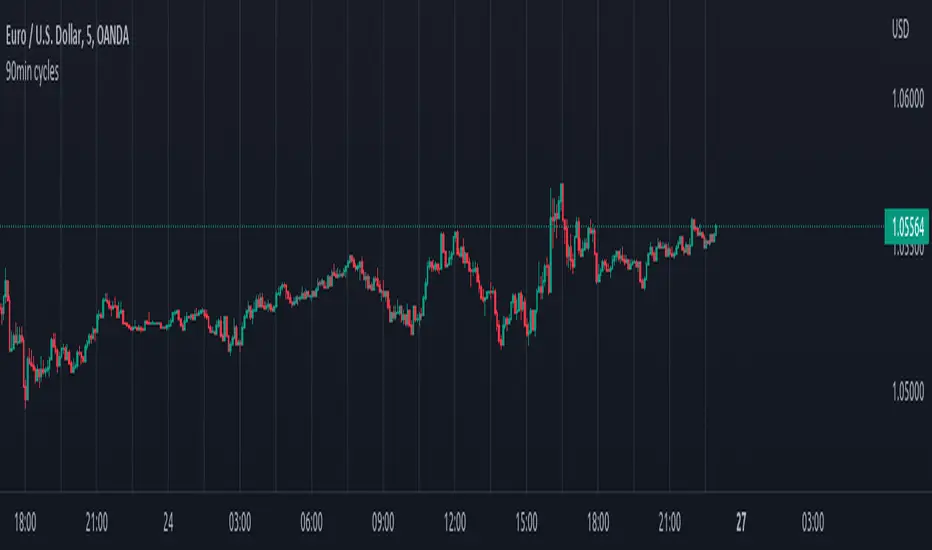
90min cyclesI did this little script to help me with the cycle I hope it will help some of you too !
For default, I have made 90 min cycle, but you can change it easily on the settings if you prefer an other time interval because it is really subjectif.
By default the cycle will begin at midnight from YOUR local time, but this can be a little annoying when you want for example to make it begin at midnght from NY or London without changing the UTC of your chart (if you still want to have your hour displayed normally).
I couldn't find an indicator to help me do that so I added a little setting which allow you to move the start hour of your cycle (so you will have to do some math to move it accordingly to what you want but that's okay ;) ).
That way you can choose the interval you like AND when it begin !
Monarch Strategies Altcoin Optimized Cycle & Trend Strategy (1W)The Altcoin Optimized Cycle & Trend Strategy (1W) is a professional, long-term cycle and trend trading strategy designed specifically for altcoins such as Stellar (XLM). It is built for traders and investors who want to systematically capture explosive altcoin cycles while avoiding emotional decision-making and excessive trading.
The strategy operates on the weekly timeframe (1W) and focuses on identifying major accumulation zones, breakout phases, and distribution tops that typically define altcoin market behavior.

Quarterly Cycles [EETrade]The idea of Quarterly Theory is -
Each timeframe is split into 4 "quarters", derived based on logical subdivisions:
- Year: Divided into calendar quarters (Jan-Mar, Apr-Jun, etc.).
- Tertiary (sub-year): Each year quarter is subdivided into 4 parts dynamically based on timestamp deltas.
- Month: Weekly-based logic using Sunday cutoffs and session switch time (18:00 US/Eastern).
- Week: Divided using daily boundaries starting from Sunday 18:00 (based on US futures session logic).
- Day: Split into 4 blocks (Asia, London, AM, PM) using 6-hour segments.
- Session and Macro Quarters: Session is divided further into 4 quarters of 6 hours, then each of those into 15-minute blocks for ultra-granular cycle mapping.
Where we split them into Q1, Q2, Q3 and Q4.
Usually we address
Q1 as accumulation,
Q2 as manipulation
Q3 as Distribution
Q4 as Continuation/Reversal
If we trade Q3 for example, we'd like to use price action mainly from previous Q3s.
Plus there are Semi Cycles which we can utilize
- Q1 with Q3
- Q2 with Q4
- Q3 with Q1
- Q4 with Q2
So we can also use Q1 price action when we are trading Q3
True Open Logic:
The open candle price of the second quarter is the true open for us, it will help us understand if we're on premium or discount area.
Plus this indicator providers a table to dynamically show the premium and discount
We can use this indicator to understand optimal times to trade as we'd like to trade mostly Q3

VWAP Breakout Strategy + EMAs + Clean Cycle/TP/SL PlotsHere’s a quick user-guide to get you up and running with your “VWAP Breakout Strategy + EMAs + Clean Cycle/TP/SL Plots” script in TradingView:
⸻
1. Installing the Script
1. Open TradingView, go to Pine Editor (bottom panel).
2. Paste in your full Pine-v6 code and hit Add to chart.
3. Save it (“Save as…”): give it a memorable name (e.g. “VWAP Breakout+EMAs”).
⸻
2. Configuring Your Inputs
Once it’s on the chart, click the ⚙️ Settings icon to tune:
Setting Default What it does
ATR Length 14 Period for average true range (volatility measure)
ATR Multiplier for Stop 1.5 How many ATRs away your stop-loss sits
TP1 / TP2 Multipliers (ATR) 1.0 / 2.0 Distance of TP1 and TP2 in ATR multiples
Show VWAP / EMAs On Toggles the blue VWAP line & EMAs (100/34/5)
Full Cycle Range Points 200 Height of the shaded “cycle zone”
Pivot Lookback 5 How many bars back to detect a pivot low
Round Number Step 500 Spacing of your dotted horizontal lines
Show TP/SL Labels On Toggles all the “ENTRY”, “TP1”, “TP2”, “STOP” tags
Feel free to adjust ATR multipliers and cycle-zone size based on the instrument’s typical range.
⸻
3. Reading the Signals
• Long Entry:
• Trigger: price crosses above VWAP
• You’ll see a green “Buy” tag at the low of the signal bar, plus an “ENTRY (Long)” label at the close.
• Stop is plotted as a red dashed line below (ATR × 1.5), and TP1/TP2 as teal and purple lines above.
• Short Entry:
• Trigger: price crosses below VWAP
• A red “Sell” tag appears at the high, with “ENTRY (Short)” at the close.
• Stop is the green line above; TP1/TP2 are dashed teal/purple lines below.
⸻
4. Full Cycle Zone
Whenever a new pivot low is detected (using your Pivot Lookback), the script deletes the old box and draws a shaded yellow rectangle from that low up by “Full Cycle Range Points.”
• Use this to visualize the “maximum expected swing” from your pivot.
• You can quickly see whether price is still traveling within a normal cycle or has overstretched.
⸻
5. Round-Number Levels
With Show Round Number Levels enabled, you’ll always get horizontal dotted lines at the nearest multiples of your “Round Number Step” (e.g. every 500 points).
• These often act as psychological support/resistance.
• Handy to see confluence with VWAP or cycle-zone edges.
⸻
6. Tips & Best-Practices
• Timeframes: Apply on any intraday chart (5 min, 15 min, H1…), but match your ATR length & cycle-points to the timeframe’s typical range.
• Backtest first: Use the Strategy Tester tab to review performance, tweak ATR multipliers or cycle size, then optimize.
• Combine with context: Don’t trade VWAP breakouts blindly—look for confluence (e.g. support/resistance zones, higher-timeframe trend).
• Label clutter: If too many labels build up, you can toggle Show TP/SL Labels off and rely just on the lines.
⸻
That’s it! Once you’ve added it to your chart and dialed in the inputs, your entries, exits, cycle ranges, and key levels will all be plotted automatically. Feel free to experiment with the ATR multipliers and cycle-zone size until it fits your instrument’s personality. Happy trading!
