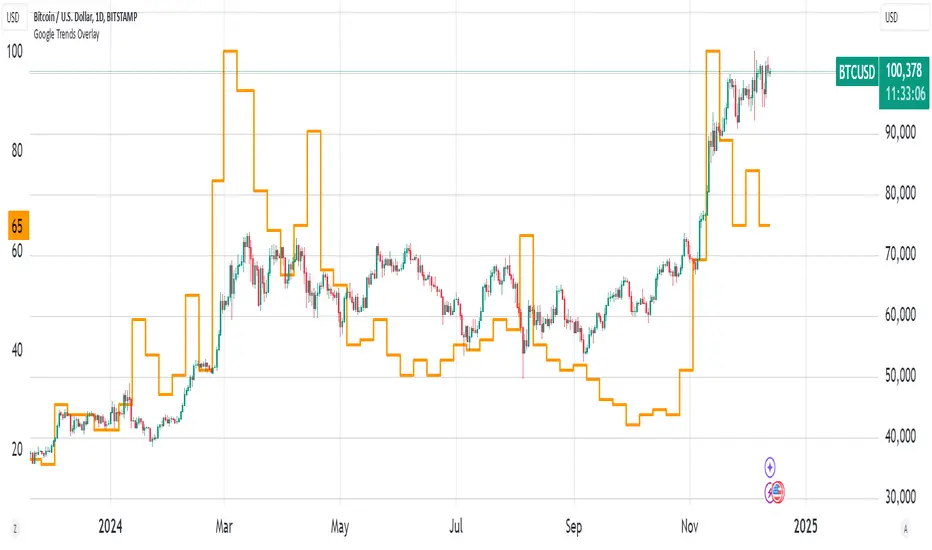
[ADDYad] Google Search Trends - Bitcoin (2012 Jan - 2025 Jan)This Pine Script shows the Google Search Trends as an indicator for Bitcoin from January 2012 to January 2025, based on monthly data retrieved from Google Trends. It calculates and displays the relative search interest for Bitcoin over time, offering a historical perspective on its popularity mainly built for BITSTAMP:BTCUSD .
Important note: This is not a live indicator. It visualizes historical search trends based on Google Trends data.
Key Features:
Data Source : Google Trends (Last retrieved in January 10 2025).
Timeframe : The script is designed to be used on a monthly chart, with the data reflecting monthly search trends from January 2012 to January 2025. For other timeframes, the data is linearly interpolated to estimate the trends at finer resolutions.
Purpose : This indicator helps visualize Bitcoin's search interest over the years, offering insights into public interest and sentiment during specific periods (e.g., major price movements or news events).
Data Handling : The data is interpolated for use on non-monthly timeframes, allowing you to view search trends on any chart timeframe. This makes it versatile for use in longer-term analysis or shorter timeframes, despite the raw data being available only on a monthly basis. However, it is most relevant for Monthly, Weekly, and Daily timeframes.
How It Works:
The script calculates the number of months elapsed since January 1, 2012, and uses this to interpolate Google Trends data values for any given point in time on the chart.
The linear interpolation function adjusts the monthly data to provide an approximate trend for intermediate months.
Why It's Useful:
Track Bitcoin's historic search trends to understand how interest in Bitcoin evolved over time, potentially correlating with price movements.
Correlate search trends with price action and other market indicators to analyze the effects of public sentiment and sentiment-driven market momentum.
Final Notes:
This script is unique because it shows real-world, non-financial dataset (Google Trends) to understand price action of Bitcoin correlating with public interest. Hopefully is a valuable addition to the TradingView community.
ADDYad
Search in scripts for "Google公司基本面分析"

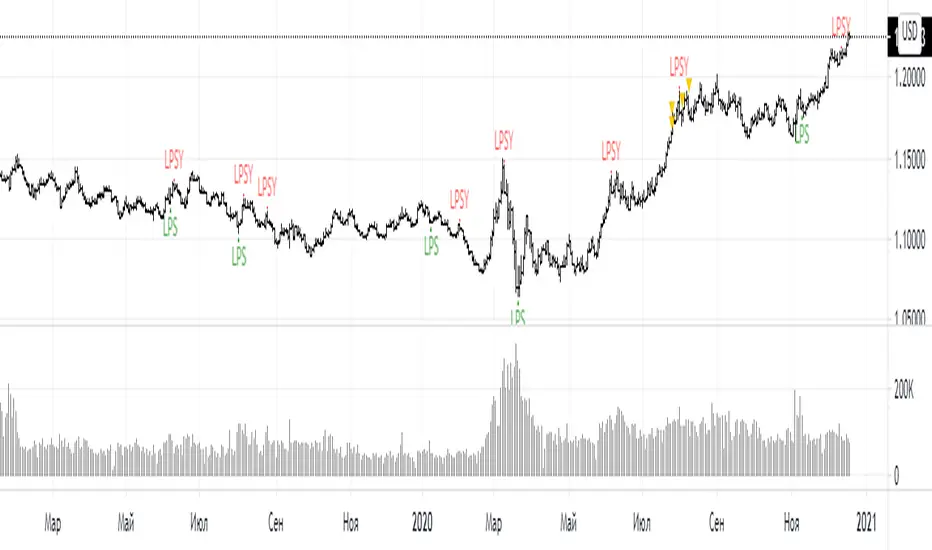
Bitcoin Google Trends OverlayThis indicator overlays Bitcoin Google trends data starting from 16/12/2018 until 10/12/2023. To have more recent data, you will need to update the data points manually.
If it is not showing properly, you need to plot the indicator to a new scale. Try also to use a logarithmic scale to better correlate the Bitcoin Google Trends data.
Interpretation:
Google Trends data and the Bitcoin price are very correlated. Google Trends data is a good indicator of market sentiment, but it usually lags.
Gap finder(google translate)
Purple line - shows the maximum gap in history on the active timeframe.
Red bars - show the size and place of the gap.
The indicator is designed to assess the risk of getting into the gap.
My observations show that the new gap record is usually multiplied by 1.5 - 2.
Фиолетовая линия - показывает максимальный гэп за всю историю на активном таймфрейме.
Красные бары - показывают величину и место гэпа.
Индикатор предназначен для оценки риска попадания на ГЭП.
Мои наблюдения показывают, что новый рекорд ГЭПа как правило бывает в 1,5 - 2 раза больше.

LPS PLSY INDICATOR for VSA( Google translation from Russian.)
Signal conditions:
1. There is a bar with an increased volume
2. The next bar after the bar with increased volume closes in the other direction
Arguments:
Comparison period - the period during which the volumes are compared with each other to calculate the bars with the increased volume.
sensitivity of increased volumes - according to the percentrank indicator - the border above which the volume will be considered large, the same as in the Volume on bar VSA indicator - indicator V2 - for clarity of how it works, I recommend looking at it.
efficiency of the next bar - (efficiency of the next bar from 0 to 100) ") - the efficiency of buying or selling on the next bar, bar field with a large volume. If the value is closer to 100, then the bars whose spread corresponds to the inserted volume will be taken into account, if closer to 0, then bars with a small spread and a large volume can be taken into account.
This argument is calculated similarly to the efficiency of bulls and bears for VSA
Attention.
In its original form, this indicator can give a large number of false signals. To filter out false signals, it should be used after studying the theory of VSA.
Russian language
Условия для сигнала:
1. Имеется бар с повышенным объёмом
2. Следующий бар после бара с повышенным объемом закрывается в другую сторону
Аргументы:
период для сравнения – период, на котором сравниваются между собой объёмы, для вычисления баров с повышенным объемом.
чувствительность повышенных объемов – согласно индикатору percentrank – граница выше которой̆ объем будет считаться большим, то же самое, что в индикаторе Volume on bar VSA - indicator V2 – для наглядности как это работает рекомендую посмотреть его.
эффективность следующего бара от 0 до 100 - эффективность покупок или продаж на следующем баре, поле бара с большим объемом. Если значение ближе к 100 то будут учитываться бары у которых спред соответствует вложенному объему, если ближе к 0 то могут учитываться бары у которых спред маленький а объем большой.
Расчёт этого аргумента производится аналогично индикатору efficiency of bulls and bears for VSA
Примечание
В исходном виде этот индикатор может давать большое количество ложных сигналов. Для отсеивания ложных сигналов его следует применять после изучения теории VSA.
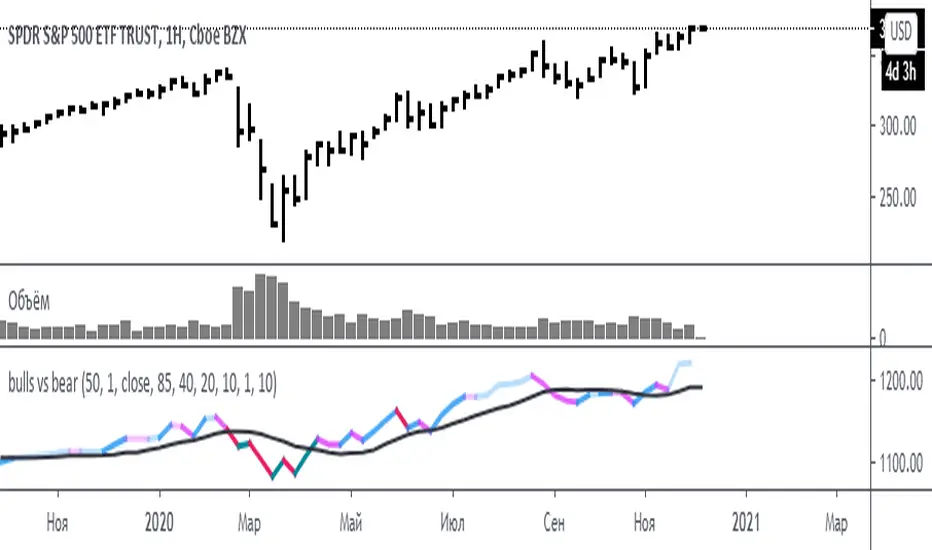
bulls vs bear for VSA(Google translation from Russian.)
This indicator is based on the efficiency of bulls and bears for VSA and has the same parameters.
Its only difference is that all the values of the efficiency of bulls and bears for VSA indicator are sequentially added here.
I want to note that the Period spread - Bars from close to close argument was made for experimental purposes, and shows interesting results for values 3-4-5, in theory this is not very logical. Because then the estimate of the spread for this interval (3-4-5) will be divided by the estimate of the volume of the current bar.
Also added here is a moving average with a default period of 10 - theoretically, if the indicator is above the moving average - the initiative is behind the bulls - if below - the initiative is behind the bears.
It is recommended to use this indicator with the indicator:
efficiency of bulls and bears for VSA
Volume on bar VSA - indicator V2
Russian language.
Этот индикатор сделан на основе efficiency of bulls and bears for VSA и имеет такие же параметры.
Единственное отличие его в том, что тут последовательно складываются все значения индикатора efficiency of bulls and bears for VSA .
Хочу отметить, что аргумент Period spread - Bars from close to close (Период спреда - Баров от закрытия до закрытия) сделан в экспериментальных целях, и показывает интересные результаты на значения 3-4-5, в теории это не очень логично. Потому-что тогда будет делиться оценка спреда за этот интервал (3-4-5), на оценку величины объема текущего бара.
Также тут добавлена скользящая средняя с периодом по умолчанию 10 – теоретически, если индикатор над скользящей средней – инициатива за быками – если ниже – инициатива за медведями.
Это индикатор рекомендуется использовать с индикатором:
efficiency of bulls and bears for VSA
Volume on bar VSA - indicator V2
efficiency of bulls and bears for VSA(Google translation from Russian.)
This indicator shows the effectiveness of selling or buying.
It is calculated as follows: using percentrank, the volume and the value of the spread are estimated (momentum = 1)
the resulting estimate of the volume value is divided by the estimate of the spread (momentum = 1) and thus we obtain the value. The larger it is, the more efficient and easier the price movement was.
If the indicator value is small, then this means that the movement was ineffective, because the volume (money) was invested. but no result.
The color of the volume bars is assigned as follows:
Buyers:
If the volume is large - Blue - green
If middle, then blue
Small - light blue
Sellers:
If the volume is large - Burgundy color
If middle, then purple
Small volume - light purple
Indicator parameters:
Comparison period - the period at which the volumes and spread are compared with each other - by default it is 50, selected as the most universal period suitable for different timeframes. But for daytime ones. Weekly and monthly timeframes may need to be shortened. This is true after significant spikes in volume that are exceptional over the long term.
Period spread - Bars from close to close - or in other words, it is momentum - defaults to 1
sensitivity of increased volumes - according to the percentrank indicator - the limit above which the volume will be considered large, the same as in the Volume on bar VSA - indicator V2 - for clarity, I recommend looking at it.
The default is 85, which means. that if the current value of the volume is greater than 85% of the remaining values in this period, then such a value of the volume will be considered high.
medium volume sensitivity - the same sensitivity of increased volumes but for medium volumes.
multiplier of increased volumes - this is an empirical factor to emphasize the importance of increased volumes - default = 20
multiplier of average volumes - the same. As above, but for medium volumes - the default is 10
reduced volume multiplier - Default is 1.
Knowledge of VSA is required to read this indicator
This indicator is recommended for use with indicators:
Volume on bar VSA - indicator V2
BAR for VSA
Russian language
Этот индикатор показывает эффективность продаж или покупок.
Рассчитывается следующим образом: с помощью percentrank оценивается величина объема и велечина спреда (momentum = 1)
полученная оценка велечины объема делится на оценку спреда (momentum = 1) и таким образом получаем значение. Чем оно больше, тем движение цены было эффективнее и легче.
Если значение индикатора маленькое, то это означает, что движение было неэффективным, поскольку объем (деньги) вложили. а результата нет.
Цвет барам объемов присваиваются следующим образом:
У покупателей:
Если объем большой - Сине – зелёный цвет
Если средний – то голубой
Маленький – свело-голубой
У продавцов:
Если объем большой - Бордовый цвет
Если средний – то пурпурный
Маленький объем – светло-пурпурный
Параметры индикатора:
Comparison period (период для сравнения) – период на котором между собой сравниваются объемы и спред – по умолчанию равно 50 , выбрано как наиболее универсальный период подходящий для различных таймфреймов. Но для дневных. Недельных и месячных таймфреймов может потребоваться уменьшить период. Это актуально после значительных всплесков объемов, которые являются исключительными на длительном периоде.
Period spread - Bars from close to close (Период спреда - Баров от закрытия до закрытия) – или другими словами это momentum – по умолчанию равно 1
sensitivity of increased volumes (чувствительность повышенных объемов) – согласно индикатору percentrank – граница выше которой объем будет считаться большим, то же самое, что в индикаторе Volume on bar VSA - indicator V2 – для наглядности как это работает рекомендую посмотреть его.
По умолчанию задано 85 – это означает. что если текущее значение объема больше, чем 85% остальных значений на этом периоде, то такое значение объема будет считаться высоким.
medium volume sensitivity (чувствительность средних объемов) – то же самое sensitivity of increased volumes но для средних объемов.
multiplier of increased volumes (множитель (вес) повышенных объемов) – это эмперический коэффициент для придания особой важности повышенным объемам- по умолчанию = 20
multiplier of average volumes (множитель (вес) средних объемов) – то же самое. Что и выше, но для средних объемов – по умолчанию равно 10
reduced volume multiplier (множитель (вес) пониженных объемов) – по умолчанию равно 1.
Для чтения данного индикатора необходимо знание VSA
Этот индикатор рекомендуется использовать с индикаторами:
Volume on bar VSA - indicator V2
BAR for VSA
VolSumGoogle Translation------------------------------------------------------------------------------------------------------------------------------------------
If the closing price is higher than the opening price, the volume is positive and reverse.
If the closing price is smaller than the opening price, the volume is negative and their defined period
It is an indicator that I thought that I would like to see how the shape changes compared to the price chart
when the sum of is calculated.
The white line is the sum of the output and the light blue line is the white line ema.
日本語---------------------------------------------------------------------------------------------------------------------------------------------------------
終値が始値より大きければ出来高をプラスに逆である終値が始値より小さければ出来高をマイナスにしそれらの定められた期間
の合計(sum)を出したら価格チャートと比較して形がどのように変化するか見てみたいと思い作ったインジケーターです。
白い線が出来高のsumで水色の線は白い線のemaになります。

VolCum
Google Translation------------------------------------------------------------------------------------------------------------------------------------------
If the closing price is greater than the opening price, the volume is positive.
If the closing price is less than the opening price, the volume is negative, and the sum of all of them is calculated.
It is an indicator that I thought that I would like to see how the shape changes when compared with the price chart.
The white line is the production cum and the light blue line is the white line ema.
日本語---------------------------------------------------------------------------------------------------------------------------------------------------------
終値が始値より大きければ出来高をプラスに逆である終値が始値より小さければ出来高をマイナスにしそれらの全ての合計(cum)を
出したら価格チャートと比較して形がどのように変化するか見てみたいと思い作ったインジケーターです。
白い線が出来高のcumで水色の線は白い線のemaになります。

VSA indicatorGoogle translation from Russian:
This is VSA bar-by-bar analysis.
Spread, volume and progress are analyzed.
Spread is the difference between the current closing price and the previous one.
Progress is determined by dividing price by volume.
For each parameter (spread, volume, progress), a score is assigned according to the following assessment system:
Great value - 3 points
Average value - 2 points
Small value - 1 point
If the volume is small, i.e. 0 points, the other parameters are not evaluated.
Green bars represent a buyer and red bars represent a seller. It is selected based on the location of the closing price between the high and low prices of the bar. If the closing price is closer to the maximum, then these are purchases, if to the minimum, then these are sales.
The higher the bar value, the stronger the player. The maximum value on the bar is 9 (indicates the maximum values for all parameters of spread, volume and progress).
The blue line is the average value for the last 5 bars (the value changes in the settings), it can be interpreted as the balance of forces for the last 5 bars. The centerline value is multiplied by a scale factor of 2 for better display.
It should be borne in mind that to use the indicator, you need to know the VSA theory, since this indicator cannot assess the result of price changes, breaking through important levels, as well as the context in general.
Это побарный анализ VSA.
Анализируется спред, объем и прогресс.
Спред это – разница между текущей ценой закрытия и предыдущей.
Прогресс определяется делением цены на объем.
По каждому параметру (спред, объем, прогресс) присваивается балл по следующей системе оценке:
Большое значение – 3 балла
Среднее значение – 2 балла
Маленько значение – 1 балл
Если объем маленький, т.е. 0 баллов, то остальные параметры не оцениваются.
Зелёные бары обозначают покупателя, а красные продавца. Выбирается на основании расположения цены закрытия между максимальной и минимальной ценой бара. Если цена закрытия расположена ближе к максимуму, то это покупки, если к минимуму, то это продажи.
Чем больше значение бара, тем сильнее игрок. Максимальное значение на баре равно 9 (указывает максимальные значения по всем параметрам спреду, объему и прогрессу).
Синяя линия это среднее значение по последним 5 барам (значение меняется в настройках), его можно интерпретировать как баланс сил по последним 5 барам. Значение средней линии умножено на масштабный коэффициент равный 2 для лучшего отображения.
Следует учитывать, что для пользования индикатором необходимо знать теорию VSA, поскольку этот индикатор не может оценить результат изменения цены, пробитие важных уровней, а также в целом контекст.

Volume on bar VSA - signal V2Google translate.
This indicator marks bars on the chart with high and medium volumes. The direction of the effort depends on whether the tail is on the bar, bullish or bearish.
In the settings you can set (sensitivity) for tinting volumes of high and medium
This indicator highlights volumes just like here
Этот индикатор помечает бары на графике с повышенными и средними объемами. Направление усилия зависимости от того какой хвост на баре, бычий или медвежий.
В настройках можно задать (чувствительность) для подкрашивания объемов повышенных и средних.
Этот индикатор выделяет объемы точно также как

Volume on bar VSA - indicator V2Google translate.
This indicator compares the volume with its average value and tints it depending on whether the tail on the bar is bullish or bearish.
In the settings you can set (sensitivity) for tinting volumes of high and medium
Этот индикатор сравнивает объем со средним его значением и подкрашивает его в зависимости от того какой хвост на баре, бычий или медвежий.
В настройках можно задать (чувствительность) для подкрашивания объемов повышенных и средних
Per Volume Price ImpactLiquidity, Information and Market Timing
* Market Liquidity
The term liquidity can refer to many things in finance. In this article, we will limit the scope of discussion to the market’s ability to transact without incurring a significant increase in volatility.
As we know, liquidity and volatility have an inversed relationship — the more ample the liquidity, the lower the volatility (attributed to transaction cost, price movement and, so on). With this understanding, we can say large movements in the market are driven by low liquidity. This does not seem to make sense because the markets are huge, how can it possibly be illiquid? Now, this has to do with how the market operates and how exchanges occur (This topic concerns the area of market microstructure).
* Order Book & the Trading Process
So how does a transaction actually occur in the market? Let’s assume we open a position with a market order. In this case, you will get the price on your quote board if there are enough units of assets people are willing to sell at that price. If there are not enough units, you will buy from the second-best price and so on until your order is filled. Now in the second case, as the order is being filled, the change in price is recorded. Therefore, if someone wishes to move the market, theoretically, they just need to buy up or sell up but it is problematic to do so.
Here is why:
while dry up the liquidity can make huge moves, it is inefficient to do so.
it takes a lot of money to do that
your position will be exposed, someone more resourceful than you may go against you and that is a huge risk
market manipulation charges
when you open a position, the entry price of the position is essentially a VWAP (volume-weighted average price). If you attempt to move the market and open a buy position at the same time, you will have a higher VWAP, eating into your own profit.
I think these reasons are sufficient in establishing why opening a position and drying up liquidity to profit is a dumb idea. But of course, the institutions are not stupid, the alternative is to enter your position first then move the market.
To measure liquidity one of the tools people use is the order book. It can offer an overview of the sentiment (by looking at the orders and changes in volume) and how people are positioned (if the broker offers such data). In my opinion, open interest is a much better tool than order as it records the transactions that have occurred, hence less prone to manipulations (google: “Navinder Singh Sarao”, the trader who used fake orders to manipulate algorithms to crash the market).
But to quantify the order book is so much work as well (there are ways, just difficult), what we can do is to make things simpler.
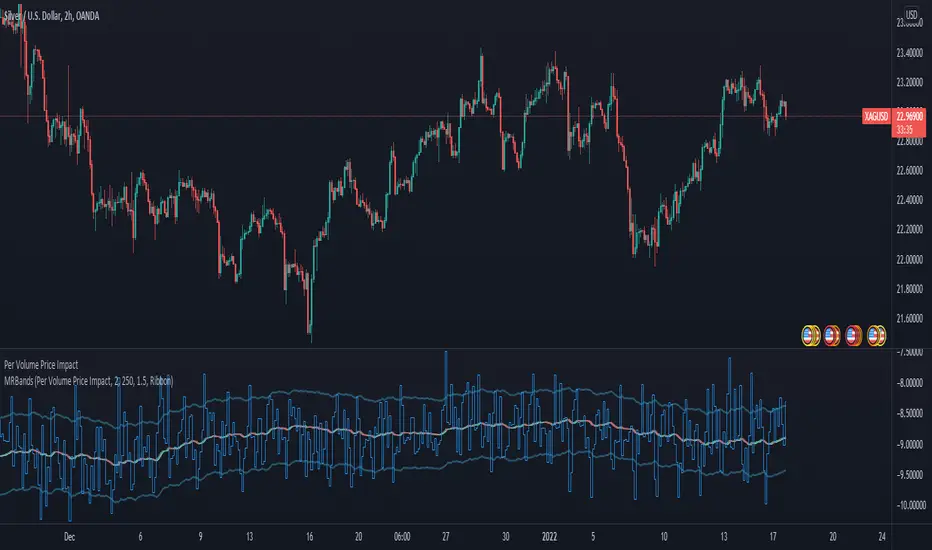
* Quantify Market Impact
We know price and volume reflect information, while the past technical information has no predictive power per semi-strong form of EMH, empirical studies have often tested this theory over a longer time horizon. In our case, precisely due to the mechanism of exchange and human behavior (The lack of incentive to move the market right away) we can, in the very short term (often intraday), foresee if the market is going to move or not. Back to the very definition of liquidity being the ability to transact without moving the market significantly, we can take this definition and quantify it with this formula:
Market Impact = (High — Low) / Volume
Why specifically “high — low”, because that’s the complete information in that moment and it is corresponding to the volume. A little crude but it is the simplest form.
A few things to take note of here:
We can only know the complete picture once the candle is complete. This is fine in most markets because it takes time to gather money and orders.
We often see high liquidity during certain time of the day, for example, when the market opens and so on. As a result, we need to take some scientific approaches to transform the data.
Now, this looks much better. To interpret this graph, the lower the value, the lower the market impact, the deeper the liquidity.
* Generate Tradable Insights
To generate trade ideas isn’t a difficult task, we all know the RSI, MOM, STOC, etc. all the indicators attempt to draw boundaries, and we can do the same but we need to be a little more advanced and critical.
step 1: we first need to normalize the data. To do that we will take the log of the values to make the skewed distribution normal. The result isn’t ideal if you zoom out but I think this is decent enough to work with. Here is
This is still not a stationary time series, but it looks stable enough and it mean-reverts. So we turn to our lovely standard deviation bands for help.
Step 2: Because this is not a stationary process (visually, you can test it statistically if you wish), we cannot just take sample mean and SD and also because we want to show off our data skills, so we turn to move averages and regressions. I’m going to use moving regression here because I think it is better (mean can be distorted by large values by a larger margin and it lags)
I’m using the moving regression band on TradingView and 1.5 SD here for convenience, you can try to optimize the parameters with codes or other regression models if you wish. But I think it is more important to understand the rationale here.
This step is essentially trying to figure out the anomalies in liquidity so that we can see when there is deep liquidity. This is also why choosing the parameter is crucial because you are essentially approximating how much informed trading is taking place (This is a concept in market microstructure for brokerages to set their spreads but it is not a good tool in a liquid market). By setting the level at 1.5 we are assuming about 86% of the time the market is in what we consider a normal liquid state. (again it is arbitrary, but based on the 68–95–99.7 rule of normal distribution). The rest of the time will be either low or high liquidity, When liquidity is deep, it perhaps, signals institutional money is pouring into the market and big moves may follow.
* Conclusion
There you have it, how to enter the market with the big bucks. But do take note there are plenty of assumptions and a lot to improve on here.
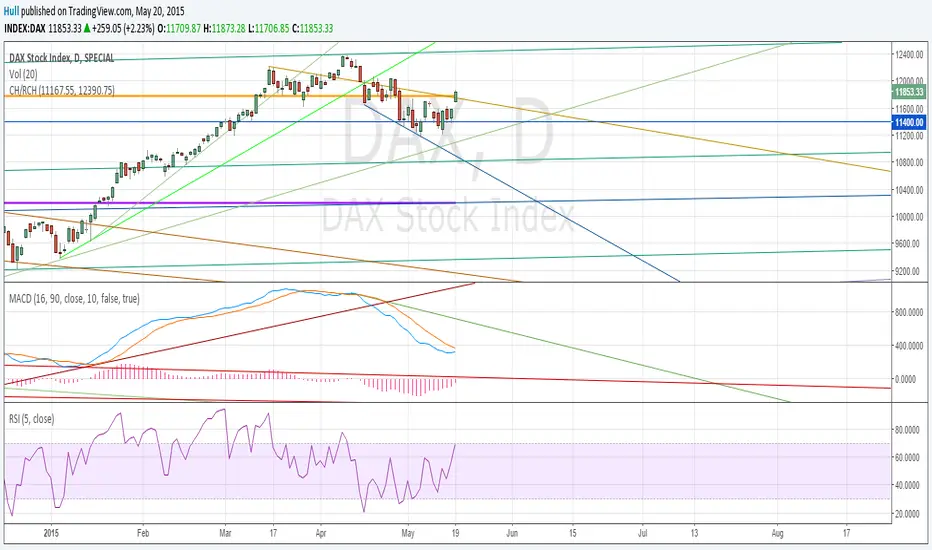
Code for Cup With Handle calculations (using Pine)Cup with Handle formation calculations using Pine.
First of all, ignore all other lines in the example chart except the two FAT lines. The two fat lines are the ones that define the Cup With handle or in the example chart: a Reversed Cup With Handle.
Note: Handle does not always develop and sometimes the final target price is reached without forming any handle.
This script can calculate both Cup With Handle ( CH ) and Reversed Cup With Handle ( RCH ). Just order the input values accordingly.
For more information about Cup With Handle, use google:
www.google.se
The script need two input parameters : The highest price in the Cup formation and the lowest price in the cup formation or vice versa for the Reversed Cup formation.
Best regards,
/Hull, 2015.05.20.16:31
base16Library "base16"
Base16 Syntax Theme Collection. dark/light Pairs placed into 2 matched groups.
included is tool for assembling your own themes, as well as all themes String names
to create your own Input menus / add to your own theme matrix, and theme selectors
addToMatrix(_mtx, _title, _choices, _theme)
To create a theme matrix with string index, use a color matrix global
add theme name to string array of theme titles
and last input a theme from above, or create your own theme arrays.
Parameters:
_mtx : (color ) matrix for storage
_title : (string ) Name of theme being added
_choices : (string ) name index
_theme : (color ) colors being added
Returns: void
addToMatrix(_mtx, _theme)
Add theme to color matrix Non-indexed
Parameters:
_mtx : (color ) matrix for storage
_theme : (color ) colors being added
dark()
Dark Themne Selection (With light Equivalent in same location)
Returns: Color matrix of dark themes
light()
light Themne Selection (With dark Equivalent in same location)
Returns: Color matrix of light themes
selectTheme(_mtx, _themes, _theme)
Get a Theme By Name
Parameters:
_mtx : (Matrix color) Name of Theme
_themes : (Array string) Array with Names of Themes
_theme : (string ) Name of Theme to select
selectTheme(_mtx, _theme)
Get a Theme By Number
Parameters:
_mtx : (Matrix color) Name of Theme
_theme : (int ) Number of Theme to select
/// all themes included:
3024
apathy
apprentice
ashes
atelier_cave_light
atelier_cave
atelier_dune_light
atelier_dune
atelier_estuary_light
atelier_estuary
atelier_forest_light
atelier_forest
atelier_heath_light
atelier_heath
atelier_lakeside_light
atelier_lakeside
atelier_plateau_light
atelier_plateau
atelier_savanna_light
atelier_savanna
atelier_seaside_light
atelier_seaside
atelier_sulphurpool_light
atelier_sulphurpool
atlas
ayu_dark
ayu_light
ayu_mirage
bespin
black_metal_bathory
black_metal_burzum
black_metal_dark_funeral
black_metal_gorgoroth
black_metal_immortal
black_metal_khold
black_metal_marduk
black_metal_mayhem
black_metal_nile
black_metal_venom
black_metal
blue_forest
blueish
brewer
bright
brogrammer
brush_trees_dark
brush_trees
catppuccin
chalk
circus
classic_dark
classic_light
codeschool
clrs
cupcake
cupertino
da_one_black
da_one_gray
da_one_ocean
da_one_paper
da_one_sea
da_one_white
danqing_light
danqing
darcula
darkmoss
darktooth
dark_violet
decaf
default_dark
default_light
dirtysea
dracula
edge_dark
edge_light
eighties
embers
emil
equilibrium_dark
equilibrium_gray_dark
equilibrium_gray_light
equilibrium_light
espresso
eva_dim
eva
everforest
flat
framer
fruit_soda
gigavolt
github
google_dark
google_light
gotham
grayscale_dark
grayscale_light
green_screen
gruber
gruvbox_dark_hard
gruvbox_dark_medium
gruvbox_dark_pale
gruvbox_dark_soft
gruvbox_light_hard
gruvbox_light_medium
gruvbox_light_soft
gruvbox_material_dark_hard
gruvbox_material_dark_medium
gruvbox_material_dark_soft
gruvbox_material_light_hard
gruvbox_material_light_medium
gruvbox_material_light_soft
hardcore
harmonic16_dark
harmonic16_light
heetch_light
heetch_dark
helios
hopscotch
horizon_dark
horizon_light
horizon_terminal_dark
horizon_terminal_light
humanoid_dark
humanoid_light
ia_dark
ia_light
icy_dark
ir_black
isotope
kanagawa
katy
kimber
lime
macintosh
marrakesh
materia
material_darker
material_lighter
material_palenight
material_vivid
material
mellow_purple
mexico_light
mocha
monokai
Nebula
nord
nova
ocean
oceanicnext
one_light
onedark
outrun_dark
pandora
papercolor_dark
papercolor_light
paraiso
pasque
phd
pico
pinky
pop
porple
primer_dark_dimmed
primer_dark
primer_light
purpledream
qualia
railscasts
rebecca
rose_pine_dawn
rose_pine_moon
rose_pine
sagelight
sakura
sandcastle
seti_ui
shades_of_purple
shadesmear_dark
shadesmear_light
shapeshifter
silk_dark
silk_light
snazzy
solar_flare_light
solar_flare
solarized_dark
solarized_light
spaceduck
spacemacs
stella
still_alive
summercamp
summerfruit_dark
summerfruit_light
synth_midnight_terminal_dark
synth_midnight_terminal_light
tango
tender
tokyo_city_dark
tokyo_city_light
tokyo_city_terminal_dark
tokyo_city_terminal_light
tokyo_night_dark
tokyo_night_light
tokyo_night_storm
tokyo_night_terminal_dark
tokyo_night_terminal_light
tokyo_night_terminal_storm
tokyodark_terminal
tokyodark
tomorrow_night_eighties
tomorrow_night
tomorrow
london_tube
twilight
unikitty_dark
unikitty_light
unikitty_reversible
uwunicorn
vice
vulcan
windows_10_light
windows_10
windows_95_light
windows_95
windows_high_contrast_light
windows_high_contrast
windows_nt_light
windows_nt
woodland
xcode_dusk
zenburn

Intra Bullish Strategy - Profit Ping v4.0ProfitPing 4.0 is a high-precision intraday swing trading strategy designed for global equity markets, including the US, South Africa, and Australia. The system identifies high-probability BUY and EXIT signals using a confluence of technical indicators and real-time volume dynamics.
🧠 Key Features:
Dual EMA Crossover (7 & 14) for short-term trend confirmation
Volume Spike Detection based on 20-period moving average
RSI Momentum Filter (ideal zone: 55–65) to avoid overbought entries
MACD Histogram & Signal Line Sync for trend momentum validation
Candlestick Pattern Filtering (e.g. bullish engulfing, flags, breakout candles)
Multi-Timeframe Confirmation (optional) for intraday trend alignment
Dynamic Risk-to-Reward Logic built into alert framework
Webhook-compatible JSON alerts for automation to Google Sheets, Power BI, and IBKR
🛠️ Alert System:
BUY alert triggers when all bullish conditions align
EXIT alert triggers only if a previous BUY exists for that ticker
Trade status is updated live in Google Sheets and integrated with Power BI dashboards
Orphaned EXITs (no matched BUY) are tracked separately for accuracy review
🔄 Ideal For:
Traders seeking 1:2 to 1:5 risk/reward setups
Automation-focused workflows (via TradingView → Google Sheets → Power BI)
Swing traders wanting clean visual logs, automated P&L tracking, and optional IBKR execution

Sladkaya Kruglaya BulochkaSladkaya Kruglaya Bulochka
Индикатор основан на индикаторе для МТ4 "Тень Кукла" и рисует "круглые уровни" (например по EURUSD 1.08900, 1,09000) на которых чаще всего встречается разворот (ну так пишут =) ). Лучше будет поискать в google про круглые уровни.
В настройках выбираете сколько числе после запятой для цены той или иной пары. Например для EURUSD на ТФ 1М или 5М лучше выбрать значение 3, для более старших значение 2. Для таких пар как USDJPY значения от 2. Поиграйтесь немного, там в настройках все равно ничего не испортишь))
И так для тех у кого туго с пониманием:
синие кружочки - это ближайший уровень к цене
черные кружочки - показывает где следующий уровень, чтобы было легче ориентироваться
красные тонкие линии - это расстояние в 30 пипсов от синего уровня, они служат как ориентир возврата цены, если цена не отскочила от синей линии и пошла дальше.
Для лучшего эффекта можете использовать этот индикатор или что нибудь свое )
Всем удачи. Если что пишите вопросы в комментарии, попытаюсь помочь.
Отдельное спасибо @DiZer за помощь
Google translate
The indicator is based on the indicator for MT4 "Shadow Doll" and draws "circular level" (eg for EURUSD 1.08900, 1,09000) on which the reversal occurs most often (well, so write =)). It would be better to look on google about the circular level.
In the settings you choose as well as after the decimal point for the price of a pair. For example, for EURUSD on TF 1M or 5M is better to choose a value of 3, for the older value of 2. For these pairs as the USDJPY value of 2. Play around a little bit, there still will not spoil anything in the settings))
And so for those who lack understanding:
Blue circles - is the closest level to the price
black circles - shows where the next level, to make it easier to navigate
red thin line - a distance of 30 pips from the blue level, they serve as a benchmark rates of return if the price has not rebounded from the blue line and went on.
can use this indicator to the best effect or anything his own)
Good luck to all. If that write questions in the comments, I will try to help.

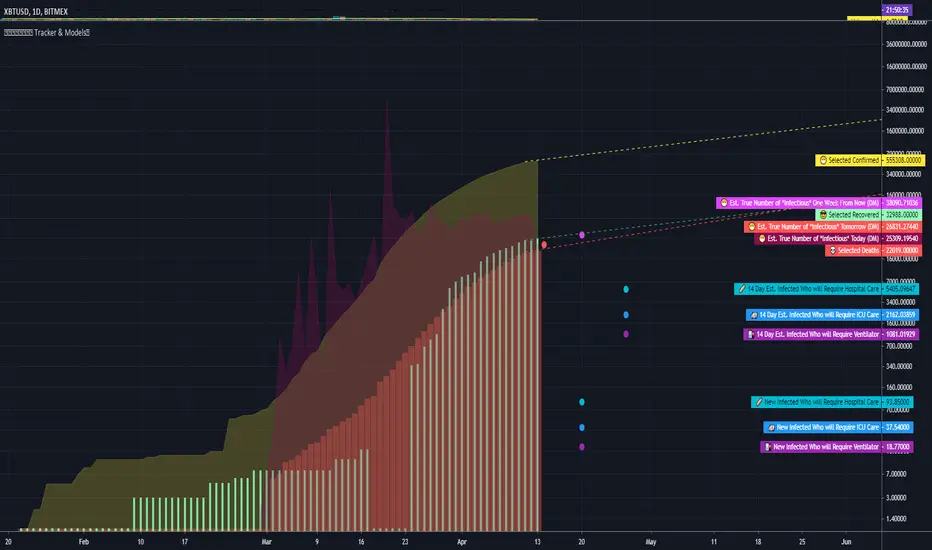
COVID Statistics Tracker & Model Projections by Cryptorhythms😷 COVID-19 Coronavirus Tracker & Statistics Tools by Cryptorhythms 😷
📜Intro
I wanted to put some more meaning behind the numbers for 2020's Covid pandemic. I hope this tool can help people analyze and deal with these hard times. With these metrics I hope to give greater depth and dimension to whats available. While also at the same time creating something that looks decently presentable and gives actionable information.
I had planned on including a few forecasting models and letting the user play with values to see how social distancing works. But alas I couldnt complete those in the scope of time I gave myself for the indicator. If you are interested in collaborating on it, I will share what I have with you and we can further work on it.
📋Description
The script contains 3 main parts you will interact with. I suggest you enable the chart labels for "indicator name" and "indicator last value" to make the charts more readable (right click on the scale of your chart and goto the "labels" pop out menu). Depending on what plots and data you choose to chart, logarithmic and regular scales can both be applied in different situations. To get similar visuals to the examples I will show below, you can goto the indicator options > style tab. I then play with the line styles, colors and transparencies to achieve the nice looking charts. Please also note there is a distinction between "Infected" and "Infectious". A model telling you the number of infected doesnt designate whether that person can still pass the virus on to others (infectious). So Infectious numbers are usually lower than total confirmed, but this isnt always the case if for example a country wasnt testing very much during the early phase or something else.
🚧Disclaimer
I am not a medical professional and none of this should be considered medical advice. All of the models, numbers and math I sourced from professional places but this is not a guarantee of the future only an approximation based on current information. Numbers change daily and so can these models!
🌐PART ONE
In this area you select a region to read the proper statistics data from tradingview. You can do global totals, country totals, or for a few places (AU, CA, CN, US) you can see state/province totals. Remember to SELECT ONLY ONE region.
🧮PART TWO
The Plots/Stats/Data section includes:
1. ) Plot the Days to Double Number of Confirmed
2. ) Plot the Infection Growth Ratio
3. ) Plot Fatality Risk Rate (Total Deaths / Total Outcomes)
4. ) Plot Overall Fatality Rate / Recovery Rate
5. ) Plot % of World Infected & % of USA Infected
6. ) Plot Daily New Deaths, Confirmed & Recovered
7. ) Plot Daily Change Percentages
🎱PART THREE
Forecasting Models and Settings:
1 .) Plot the % of Custom Population Infected (Vs. the Region Selected in Part 1 of Settings)
2 .) Plot the True Num. of Infectious (Death Model / DM)
3 .) Plot the Current and Next Weeks Cumulative Infection Projection (DM)
4 .) Plot Estimated Infection Rates? (DM)
5 .) Enable Basic Trajectory Projection?
6 .) Plot the Likelihood of > 0 **Infectious** in a Group (DM) for Today, Tomorrow and Next Week
7 .) Plot the True Num. of Infected (Confirmed/Tested Model)
8 .) Plot the Estimated Epidemiology for 7 and 14 Days Out (Hospital Beds, ICU Beds, Ventilator Units)
Planned But not completed
9.) SIR Epidemiology Model
10.) Exponential Growth Plot & Correlation
To use the Estimator for likelihood of Infected in N group of people you need to do 2 things. Select and use "Custom Population" as the population source for part 3. Then you need to enable "Custom Infected" as the source for the model. Then you enter your geographical area's population and confirmed cases. Its best to goto the smallest / most granular level of data available to accurately estimate the likelihood. So for instance in the order of least effective to most effective data source: global, country, state, county, city...etc.
If you do not understand what these terms or numbers represent, please read the source materials I have linked in the code, or use google. I dont have the time or expertise to explain all the various specific methods and terms included here. This entire project was a learning journey for me and I have zero experience in epidemiology so please excuse any errors I may have made. (and tell me, so I can change it!)
🔮Future Additions
If anyone has a model or stat they would like included I will be happy to add your code to this toolbox to make it more effective and give you credit here in the description. If you want to collaborate please message me.
📊Some Example Charts:
The Cryptorhythms Team wish you and your families all the absolute best of health!
P.S. Stay safe and act smart I dont think this will be the EOTW.

Machine Learning Gaussian Mixture Model | AlphaNattMachine Learning Gaussian Mixture Model | AlphaNatt
A revolutionary oscillator that uses Gaussian Mixture Models (GMM) with unsupervised machine learning to identify market regimes and automatically adapt momentum calculations - bringing statistical pattern recognition techniques to trading.
"Markets don't follow a single distribution - they're a mixture of different regimes. This oscillator identifies which regime we're in and adapts accordingly."
━━━━━━━━━━━━━━━━━━━━━━━━━━━━━━━━━━━━━━━━
🤖 THE MACHINE LEARNING
Gaussian Mixture Models (GMM):
Unlike K-means clustering which assigns hard boundaries, GMM uses probabilistic clustering :
Models data as coming from multiple Gaussian distributions
Each market regime is a different Gaussian component
Provides probability of belonging to each regime
More sophisticated than simple clustering
Expectation-Maximization Algorithm:
The indicator continuously learns and adapts using the E-M algorithm:
E-step: Calculate probability of current market belonging to each regime
M-step: Update regime parameters based on new data
Continuous learning without repainting
Adapts to changing market conditions
━━━━━━━━━━━━━━━━━━━━━━━━━━━━━━━━━━━━━━━━
🎯 THREE MARKET REGIMES
The GMM identifies three distinct market states:
Regime 1 - Low Volatility:
Quiet, ranging markets
Uses RSI-based momentum calculation
Reduces false signals in choppy conditions
Background: Pink tint
Regime 2 - Normal Market:
Standard trending conditions
Uses Rate of Change momentum
Balanced sensitivity
Background: Gray tint
Regime 3 - High Volatility:
Strong trends or volatility events
Uses Z-score based momentum
Captures extreme moves
Background: Cyan tint
━━━━━━━━━━━━━━━━━━━━━━━━━━━━━━━━━━━━━━━━
💡 KEY INNOVATIONS
1. Probabilistic Regime Detection:
Instead of binary regime assignment, provides probabilities:
30% Regime 1, 60% Regime 2, 10% Regime 3
Smooth transitions between regimes
No sudden indicator jumps
2. Weighted Momentum Calculation:
Combines three different momentum formulas
Weights based on regime probabilities
Automatically adapts to market conditions
3. Confidence Indicator:
Shows how certain the model is (white line)
High confidence = strong regime identification
Low confidence = transitional market state
Line transparency changes with confidence
━━━━━━━━━━━━━━━━━━━━━━━━━━━━━━━━━━━━━━━━
⚙️ PARAMETER OPTIMIZATION
Training Period (50-500):
50-100: Quick adaptation to recent conditions
100: Balanced (default)
200-500: Stable regime identification
Number of Components (2-5):
2: Simple bull/bear regimes
3: Low/Normal/High volatility (default)
4-5: More granular regime detection
Learning Rate (0.1-1.0):
0.1-0.3: Slow, stable learning
0.3: Balanced (default)
0.5-1.0: Fast adaptation
━━━━━━━━━━━━━━━━━━━━━━━━━━━━━━━━━━━━━━━━
📊 TRADING STRATEGIES
Visual Signals:
Cyan gradient: Bullish momentum
Magenta gradient: Bearish momentum
Background color: Current regime
Confidence line: Model certainty
1. Regime-Based Trading:
Regime 1 (pink): Expect mean reversion
Regime 2 (gray): Standard trend following
Regime 3 (cyan): Strong momentum trades
2. Confidence-Filtered Signals:
Only trade when confidence > 70%
High confidence = clearer market state
Avoid transitions (low confidence)
3. Adaptive Position Sizing:
Regime 1: Smaller positions (choppy)
Regime 2: Normal positions
Regime 3: Larger positions (trending)
━━━━━━━━━━━━━━━━━━━━━━━━━━━━━━━━━━━━━━━━
🚀 ADVANTAGES OVER OTHER ML INDICATORS
vs K-Means Clustering:
Soft clustering (probabilities) vs hard boundaries
Captures uncertainty and transitions
More mathematically robust
vs KNN (K-Nearest Neighbors):
Unsupervised learning (no historical labels needed)
Continuous adaptation
Lower computational complexity
vs Neural Networks:
Interpretable (know what each regime means)
No overfitting issues
Works with limited data
━━━━━━━━━━━━━━━━━━━━━━━━━━━━━━━━━━━━━━━━
📈 PERFORMANCE CHARACTERISTICS
Best Market Conditions:
Markets with clear regime shifts
Volatile to trending transitions
Multi-timeframe analysis
Cryptocurrency markets (high regime variation)
Key Strengths:
Automatically adapts to market changes
No manual parameter adjustment needed
Smooth transitions between regimes
Probabilistic confidence measure
━━━━━━━━━━━━━━━━━━━━━━━━━━━━━━━━━━━━━━━━
🔬 TECHNICAL BACKGROUND
Gaussian Mixture Models are used extensively in:
Speech recognition (Google Assistant)
Computer vision (facial recognition)
Astronomy (galaxy classification)
Genomics (gene expression analysis)
Finance (risk modeling at investment banks)
The E-M algorithm was developed at Stanford in 1977 and is one of the most important algorithms in unsupervised machine learning.
━━━━━━━━━━━━━━━━━━━━━━━━━━━━━━━━━━━━━━━━
💡 PRO TIPS
Watch regime transitions: Best opportunities often occur when regimes change
Combine with volume: High volume + regime change = strong signal
Use confidence filter: Avoid low confidence periods
Multi-timeframe: Compare regimes across timeframes
Adjust position size: Scale based on identified regime
━━━━━━━━━━━━━━━━━━━━━━━━━━━━━━━━━━━━━━━━
⚠️ IMPORTANT NOTES
Machine learning adapts but doesn't predict the future
Best used with other confirmation indicators
Allow time for model to learn (100+ bars)
Not financial advice - educational purposes
Backtest thoroughly on your instruments
━━━━━━━━━━━━━━━━━━━━━━━━━━━━━━━━━━━━━━━━
🏆 CONCLUSION
The GMM Momentum Oscillator brings institutional-grade machine learning to retail trading. By identifying market regimes probabilistically and adapting momentum calculations accordingly, it provides:
Automatic adaptation to market conditions
Clear regime identification with confidence levels
Smooth, professional signal generation
True unsupervised machine learning
This isn't just another indicator with "ML" in the name - it's a genuine implementation of Gaussian Mixture Models with the Expectation-Maximization algorithm, the same technology used in:
Google's speech recognition
Tesla's computer vision
NASA's data analysis
Wall Street risk models
"Let the machine learn the market regimes. Trade with statistical confidence."
━━━━━━━━━━━━━━━━━━━━━━━━━━━━━━━━━━━━━━━━
Developed by AlphaNatt | Machine Learning Trading Systems
Version: 1.0
Algorithm: Gaussian Mixture Model with E-M
Classification: Unsupervised Learning Oscillator
Not financial advice. Always DYOR.

Cycle Composite 3.6 WeightedThe Cycle Composite is a multi-factor market cycle model designed to classify long-term market behavior into distinct phases using normalized and weighted data inputs.
It combines ten key on-chain, dominance, volatility, sentiment, and trend-following metrics into a single composite output. The goal is to provide a clearer understanding of where the market may stand in the broader cycle (e.g., accumulation, early bull, late bull, or euphoria).
This version (3.4) introduces flexible weighting, trend strength markers, and additional context-aware signals such as risk-on confirmations and altseason flags.
Phases Identified:
The model categorizes the market into one of five zones:
Euphoria (> 85)
Late Bull (70 – 85)
Mid Bull (50 – 70)
Early Bull (30 – 50)
Fear (< 30)
Each phase is determined by a smoothed EMA of the weighted composite score.
Data Sources and Metrics Used (10 total):
BTC Dominance (CRYPTOCAP:BTC.D)
Stablecoin Dominance (USDT + USDC average) (inverted for risk-on)
ETH Dominance (CRYPTOCAP:ETH.D)
BBWP (normalized Bollinger Band Width % over 1-year window)
WVF (Williams VIX Fix for volatility spike detection)
NUPL (Net Unrealized Profit/Loss, external source)
CMF (Chaikin Money Flow, smoothed volume accumulation)
CEX Open Interest (custom input from DAO / external source)
Whale Inflows (custom input from whale exchange transfer data)
Google Trends Average (BTC, Crypto, Altcoin terms)
All inputs are normalized over a 200-bar window and combined via weighted averaging, where each weight is user-configurable.
Additional Features:
Phase Labels: Labels are printed only when a new phase is entered.
Bull Continuation Marker: Triangle up when composite makes higher highs and NUPL increases.
Weakening Marker: Triangle down when composite rolls over in Late Bull and NUPL falls.
Risk-On Signal: Green circle appears when CMF and Google Trends are both rising.
Altseason Flag: Orange diamond appears when dominance of "others.d" exceeds BTC.D and ETH.D and composite is above 50.
Background Shading: Each phase is shaded with a semi-transparent background color.
Timeframe-Aware Display: All markers and signals are shown only on weekly timeframe for clarity.
Intended Use:
This script is intended for educational and macro-trend analysis purposes.
It can be used to:
Identify macro cycle position (accumulation, bull phases, euphoria, etc.)
Spot long-term trend continuation or weakening signals
Add context to price action with external on-chain and sentiment data
Time rotation events such as altseason risk
Disclaimer:
This script does not constitute financial advice.
It is intended for informational and research purposes only.
Users should conduct their own due diligence and analysis before making investment decisions.

theme_presetsStyle Made Easy with 175 Reversable light/dark themes
Built on to of my theme engine, so any tools built with one
will work with the other.
getTheme(_input)
Get a theme by name. (see lib for copy/paste list)
Parameters:
_input : string Name of Theme to use.
apathy()
Theme preset -> "Apathy"
Returns: Theme object
apprentice()
Theme preset -> "Apprentice"
Returns: Theme object
ashes()
Theme preset -> "Ashes"
Returns: Theme object
atelier_cave()
Theme preset -> "Atelier Cave"
Returns: Theme object
atelier_dune()
Theme preset -> "Atelier Dune"
Returns: Theme object
atelier_estuary()
Theme preset -> "Atelier Estuary"
Returns: Theme object
atelier_forest()
Theme preset -> "Atelier Forest"
Returns: Theme object
atelier_heath()
Theme preset -> "Atelier Heath"
Returns: Theme object
atelier_lakeside()
Theme preset -> "Atelier Lakeside"
Returns: Theme object
atelier_plateau()
Theme preset -> "Atelier Plateau"
Returns: Theme object
atelier_savanna()
Theme preset -> "Atelier Savanna"
Returns: Theme object
atelier_seaside()
Theme preset -> "Atelier Seaside"
Returns: Theme object
atelier_sulphurpool()
Theme preset -> "Atelier Sulphurpool"
Returns: Theme object
atlas()
Theme preset -> "Atlas"
Returns: Theme object
ayu()
Theme preset -> "Ayu"
Returns: Theme object
ayu_mirage()
Theme preset -> "Ayu Mirage"
Returns: Theme object
bespin()
Theme preset -> "Bespin"
Returns: Theme object
black_metal()
Theme preset -> "Black Metal"
Returns: Theme object
black_metal_bathory()
Theme preset -> "Black Metal (bathory)"
Returns: Theme object
black_metal_burzum()
Theme preset -> "Black Metal (burzum)"
Returns: Theme object
black_metal_funeral()
Theme preset -> "Black Metal (dark Funeral)"
Returns: Theme object
black_metal_gorgoroth()
Theme preset -> "Black Metal (gorgoroth)"
Returns: Theme object
black_metal_immortal()
Theme preset -> "Black Metal (immortal)"
Returns: Theme object
black_metal_khold()
Theme preset -> "Black Metal (khold)"
Returns: Theme object
black_metal_marduk()
Theme preset -> "Black Metal (marduk)"
Returns: Theme object
black_metal_mayhem()
Theme preset -> "Black Metal (mayhem)"
Returns: Theme object
black_metal_nile()
Theme preset -> "Black Metal (nile)"
Returns: Theme object
black_metal_venom()
Theme preset -> "Black Metal (venom)"
Returns: Theme object
blue_forest()
Theme preset -> "Blue Forest"
Returns: Theme object
blueish()
Theme preset -> "Blueish"
Returns: Theme object
brewer()
Theme preset -> "Brewer"
Returns: Theme object
bright()
Theme preset -> "Bright"
Returns: Theme object
brogrammer()
Theme preset -> "Brogrammer"
Returns: Theme object
brush_trees()
Theme preset -> "Brush Trees"
Returns: Theme object
catppuccin()
Theme preset -> "Catppuccin"
Returns: Theme object
chalk()
Theme preset -> "Chalk"
Returns: Theme object
circus()
Theme preset -> "Circus"
Returns: Theme object
classic()
Theme preset -> "Classic"
Returns: Theme object
clrs()
Theme preset -> "Colors"
Returns: Theme object
codeschool()
Theme preset -> "Codeschool"
Returns: Theme object
cupcake()
Theme preset -> "Cupcake"
Returns: Theme object
cupertino()
Theme preset -> "Cupertino"
Returns: Theme object
da_one_black()
Theme preset -> "Da One Black"
Returns: Theme object
da_one_gray()
Theme preset -> "Da One Gray"
Returns: Theme object
da_one_ocean()
Theme preset -> "Da One Ocean"
Returns: Theme object
da_one_paper()
Theme preset -> "Da One Paper"
Returns: Theme object
da_one_sea()
Theme preset -> "Da One Sea"
Returns: Theme object
da_one_white()
Theme preset -> "Da One White"
Returns: Theme object
danqing()
Theme preset -> "Danqing"
Returns: Theme object
darcula()
Theme preset -> "Darcula"
Returns: Theme object
dark_violet()
Theme preset -> "Dark Violet"
Returns: Theme object
darkmoss()
Theme preset -> "Darkmoss"
Returns: Theme object
darktooth()
Theme preset -> "Darktooth"
Returns: Theme object
decaf()
Theme preset -> "Decaf"
Returns: Theme object
dirtysea()
Theme preset -> "Dirtysea"
Returns: Theme object
dracula()
Theme preset -> "Dracula"
Returns: Theme object
edge()
Theme preset -> "Edge"
Returns: Theme object
eighties()
Theme preset -> "Eighties"
Returns: Theme object
embers()
Theme preset -> "Embers"
Returns: Theme object
emil()
Theme preset -> "Emil"
Returns: Theme object
equilibrium()
Theme preset -> "Equilibrium"
Returns: Theme object
equilibrium_gray()
Theme preset -> "Equilibrium Gray"
Returns: Theme object
espresso()
Theme preset -> "Espresso"
Returns: Theme object
eva()
Theme preset -> "Eva"
Returns: Theme object
everforest()
Theme preset -> "Everforest"
Returns: Theme object
flat()
Theme preset -> "Flat"
Returns: Theme object
framer()
Theme preset -> "Framer"
Returns: Theme object
fruit_soda()
Theme preset -> "Fruit Soda"
Returns: Theme object
gigavolt()
Theme preset -> "Gigavolt"
Returns: Theme object
github()
Theme preset -> "Github"
Returns: Theme object
google()
Theme preset -> "Google"
Returns: Theme object
gotham()
Theme preset -> "Gotham"
Returns: Theme object
grayscale()
Theme preset -> "Grayscale"
Returns: Theme object
green_screen()
Theme preset -> "Green Screen"
Returns: Theme object
gruber()
Theme preset -> "Gruber"
Returns: Theme object
gruvbox_hard()
Theme preset -> "Gruvbox Dark, Hard"
Returns: Theme object
gruvbox_medium()
Theme preset -> "Gruvbox Dark, Medium"
Returns: Theme object
gruvbox_pale()
Theme preset -> "Gruvbox Dark, Pale"
Returns: Theme object
gruvbox_soft()
Theme preset -> "Gruvbox Dark, Soft"
Returns: Theme object
gruvbox_material_hard()
Theme preset -> "Gruvbox Material Dark, Hard"
Returns: Theme object
gruvbox_material_medium()
Theme preset -> "Gruvbox Material Dark, Medium"
Returns: Theme object
gruvbox_material_soft()
Theme preset -> "Gruvbox Material Dark, Soft"
Returns: Theme object
hardcore()
Theme preset -> "Hardcore"
Returns: Theme object
harmonic16()
Theme preset -> "Harmonic16"
Returns: Theme object
heetch()
Theme preset -> "Heetch"
Returns: Theme object
helios()
Theme preset -> "Helios"
Returns: Theme object
hopscotch()
Theme preset -> "Hopscotch"
Returns: Theme object
horizon()
Theme preset -> "Horizon"
Returns: Theme object
horizon_terminal()
Theme preset -> "Horizon Terminal"
Returns: Theme object
humanoid()
Theme preset -> "Humanoid"
Returns: Theme object
ia()
Theme preset -> "Ia"
Returns: Theme object
icy()
Theme preset -> "Icy"
Returns: Theme object
ir_black()
Theme preset -> "Ir Black"
Returns: Theme object
isotope()
Theme preset -> "Isotope"
Returns: Theme object
kanagawa()
Theme preset -> "Kanagawa"
Returns: Theme object
katy()
Theme preset -> "Katy"
Returns: Theme object
kimber()
Theme preset -> "Kimber"
Returns: Theme object
lime()
Theme preset -> "Lime"
Returns: Theme object
london_tube()
Theme preset -> "London Tube"
Returns: Theme object
macintosh()
Theme preset -> "Macintosh"
Returns: Theme object
marrakesh()
Theme preset -> "Marrakesh"
Returns: Theme object
materia()
Theme preset -> "Materia"
Returns: Theme object
material()
Theme preset -> "Material"
Returns: Theme object
materialdarker()
Theme preset -> "Material Darker"
Returns: Theme object
material_palenight()
Theme preset -> "Material Palenight"
Returns: Theme object
material_vivid()
Theme preset -> "Material Vivid"
Returns: Theme object
mellow_purple()
Theme preset -> "Mellow Purple"
Returns: Theme object
mocha()
Theme preset -> "Mocha"
Returns: Theme object
monokai()
Theme preset -> "Monokai"
Returns: Theme object
Nebula()
Theme preset -> "Nebula"
Returns: Theme object
nord()
Theme preset -> "Nord"
Returns: Theme object
nova()
Theme preset -> "Nova"
Returns: Theme object
ocean()
Theme preset -> "Ocean"
Returns: Theme object
oceanicnext()
Theme preset -> "Oceanicnext"
Returns: Theme object
onedark()
Theme preset -> "Onedark"
Returns: Theme object
outrun()
Theme preset -> "Outrun"
Returns: Theme object
pandora()
Theme preset -> "Pandora"
Returns: Theme object
papercolor()
Theme preset -> "Papercolor"
Returns: Theme object
paraiso()
Theme preset -> "Paraiso"
Returns: Theme object
pasque()
Theme preset -> "Pasque"
Returns: Theme object
phd()
Theme preset -> "Phd"
Returns: Theme object
pico()
Theme preset -> "Pico"
Returns: Theme object
pinky()
Theme preset -> "Pinky"
Returns: Theme object
pop()
Theme preset -> "Pop"
Returns: Theme object
porple()
Theme preset -> "Porple"
Returns: Theme object
primer()
Theme preset -> "Primer"
Returns: Theme object
purpledream()
Theme preset -> "Purpledream"
Returns: Theme object
qualia()
Theme preset -> "Qualia"
Returns: Theme object
railscasts()
Theme preset -> "Railscasts"
Returns: Theme object
rebecca()
Theme preset -> "Rebecca"
Returns: Theme object
rose_pine()
Theme preset -> "Rosé Pine"
Returns: Theme object
rose_pine_dawn()
Theme preset -> "Rosé Pine Dawn"
Returns: Theme object
rose_pine_moon()
Theme preset -> "Rosé Pine Moon"
Returns: Theme object
sagelight()
Theme preset -> "Sagelight"
Returns: Theme object
sakura()
Theme preset -> "Sakura"
Returns: Theme object
sandcastle()
Theme preset -> "Sandcastle"
Returns: Theme object
seti_ui()
Theme preset -> "Seti Ui"
Returns: Theme object
shades_of_purple()
Theme preset -> "Shades Of Purple"
Returns: Theme object
shadesmear()
Theme preset -> "Shadesmear"
Returns: Theme object
shapeshifter()
Theme preset -> "Shapeshifter"
Returns: Theme object
silk()
Theme preset -> "Silk"
Returns: Theme object
snazzy()
Theme preset -> "Snazzy"
Returns: Theme object
solar_flare()
Theme preset -> "Solar Flare"
Returns: Theme object
solarized()
Theme preset -> "Solarized"
Returns: Theme object
spaceduck()
Theme preset -> "Spaceduck"
Returns: Theme object
spacemacs()
Theme preset -> "Spacemacs"
Returns: Theme object
stella()
Theme preset -> "Stella"
Returns: Theme object
still_alive()
Theme preset -> "Still Alive"
Returns: Theme object
summercamp()
Theme preset -> "Summercamp"
Returns: Theme object
summerfruit()
Theme preset -> "Summerfruit"
Returns: Theme object
synth_midnight_terminal()
Theme preset -> "Synth Midnight Terminal"
Returns: Theme object
tango()
Theme preset -> "Tango"
Returns: Theme object
tender()
Theme preset -> "Tender"
Returns: Theme object
tokyo_city()
Theme preset -> "Tokyo City"
Returns: Theme object
tokyo_city_terminal()
Theme preset -> "Tokyo City Terminal"
Returns: Theme object
tokyo_night()
Theme preset -> "Tokyo Night"
Returns: Theme object
tokyo_night_storm()
Theme preset -> "Tokyo Night Storm"
Returns: Theme object
tokyo_night_terminal()
Theme preset -> "Tokyo Night Terminal"
Returns: Theme object
tokyo_night_terminal_storm()
Theme preset -> "Tokyo Night Terminal Storm"
Returns: Theme object
tokyodark()
Theme preset -> "Tokyodark"
Returns: Theme object
tokyodark_terminal()
Theme preset -> "Tokyodark Terminal"
Returns: Theme object
tomorrow()
Theme preset -> "Tomorrow"
Returns: Theme object
tomorrow_night()
Theme preset -> "Tomorrow Night"
Returns: Theme object
tomorrow_night_eighties()
Theme preset -> "Tomorrow Night Eighties"
Returns: Theme object
twilight()
Theme preset -> "Twilight"
Returns: Theme object
unikitty()
Theme preset -> "Unikitty"
Returns: Theme object
unikitty_reversible()
Theme preset -> "Unikitty Reversible"
Returns: Theme object
uwunicorn()
Theme preset -> "Uwunicorn"
Returns: Theme object
vice()
Theme preset -> "Vice"
Returns: Theme object
vulcan()
Theme preset -> "Vulcan"
Returns: Theme object
windows_10()
Theme preset -> "Windows 10"
Returns: Theme object
windows_95()
Theme preset -> "Windows 95"
Returns: Theme object
windows_high_contrast()
Theme preset -> "Windows High Contrast"
Returns: Theme object
windows_nt()
Theme preset -> "Windows Nt"
Returns: Theme object
woodland()
Theme preset -> "Woodland"
Returns: Theme object
xcode_dusk()
Theme preset -> "Xcode Dusk"
Returns: Theme object
Anti-Volume Stop LossFINALLY!
As everyone who tried to create, understand, or even find the Buff Pelz Dormeier Anti-volume stop-loss indicator knows that - it's not easy. Personally, I have partially, or perhaps completely figured out, the tips Buff had given in Investing with Volume Analysis book.
AVSL now is ready.
Please do some test and give me a feedback how it works in your trade strategy.
Anti-Volume stop loss - AVSL
from Investing with Volume Analysis book CHAPTER 20 • RISKY BUSINESS 253-256:
"It is important in any risk-management process to predetermine an objective decision point level (a stop loss) to exit, thereby protecting principal in case you are wrong. My objective sell point is determined by using a quantitative formula I refer to as Anti-Volume Stop Loss (AVSL). Having a quantitative, yet intelligent sell point eliminates the emotional struggles involved in deciding when to exit a position.
AVSL is a technical methodology that incorporates the concepts of support, volatility, and, most importantly, the inverse relationship between price and volume. The AVSL combines the concepts of the VPCI (Volume Price Confirmation Indicator) and John Bollinger’s Bollinger Bands to create a trailing stop loss.
AVSL = Lower Bollinger Band – (Price, Length, Standard Deviation)
Where:
Length = Round (3 + VPCI)
Price = Average (Lows × 1 / VPC × 1 / VPR, Length)
Standard Deviation = 2 × (VPCI × VM)
One of the most difficult decisions is determining what one’s maximum loss threshold should be. Some say 2 percent; others say 20 percent. I believe the more volatile a security, the looser the stop should be. A nonvolatile security, such as Coca-Cola, might move 7 percent a year, while a volatile security such as Google might move 7 percent in a day. If you use a 7 percent stop for Coca-Cola, it might take a year to be stopped out while the security underperforms.
However, if you use 7 percent for Google, you can be stopped out intraday, not allowing the investment an opportunity to develop. By using the lower Bollinger Band of the securities lows, the AVSL considers each individual security’s own volatility. Thus, a volatile security would be granted more room of the stocks low while a stable security would have a tighter leash (see Figure 20.7).
The next important step is employing the price-volume relationship into the calculation. Volume gauges the power behind price moves. In accounting for this, when a security is in an uptrend and has positive volume characteristics, it is given more room. However, if the security exhibits contracting volume characteristics, then the stop is tightened. In this way, if a negative news event affects an unhealthy security, the stop is tighter, thus preserving more of your profits.
However, if the negative news event affects a security whose price-volume relationship is healthy, the stop has been loosened, avoiding the temporary whipsaw of an otherwise strong position. In these ways, AVSL lets the market decide when to exit your position.
AVSL tailors each security for support, volatility, and the pricevolume relationship based on an investor’s time frame as calculated from the chart data. For example, my portfolio positions are continually re-evaluated with this AVSL methodology, which yields the possibility of raising the decision point threshold periodically based on the time frame of my investment objective. With my short-term Giddy-up portfolios, I use daily chart data and seek to raise my maximum loss stop on a daily basis.
My intermediate ETF and stock positions are calculated off of weekly data and then re-evaluated weekly. With my longer term stock portfolios, the decision point is calculated off data revised monthly. This analytical approach that uses measurable facts over emotion or gut instincts allows me to maintain my objectivity. Thus objectivity, not emotion, informs my investment decisions."
How look mine AVSL:
Price component = low × 1/VPC × 1/VPR : for VPC > 1 and VPC < -1 | low × 1 × 1/VPR : for 1 > VPC > 0 | low × -1 × 1/VPR : for 0 > VPC > -1
AVSL Price = sma((low × 1/VPC × 1/VPR) , length) / 100
length = round : for VPCI > 0 | round [ absolute ] : for VPCI < 0 | 3 : for VPCI=0
Standard Deviation = mult × VPCI × VM)
AVSL = sma(Actual low price - AWSL Price + Standard Deviation, 26)
It's hard to say is it the same as in Buff Pelz Dormeier book, but I encourage you to modify the script for better results.

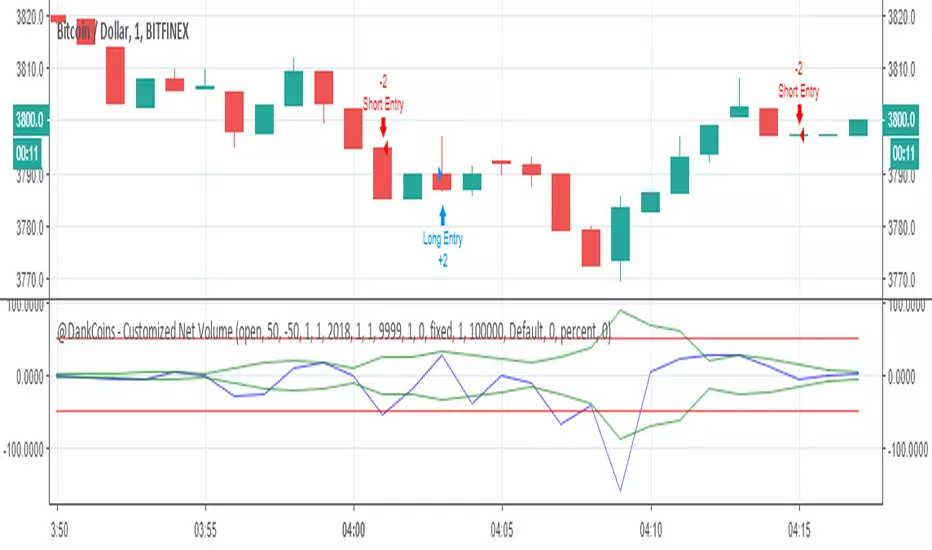
Help Requested - "Time-Slot" Delay for Crossover StrategyHello Tradingview Community,
I've been playing around with some various volume-based indicators, and recently have been experiencing a delay in the entries for my strategy for 2 minutes in this scenario. If the time is adjusted, it also is delayed 2 bars.
In this example, the "Short" position should enter when the blue line Crosses under the upper green line, and visa vera for the "Long" position. A simplified Pine Script is available below as well.
I have Googled this issue and attempted to modify the code with => criteria instead, but too no avail. Would appreciate any help or anyone who could point me in the right direction on this Time Delay Issue. Thanks!