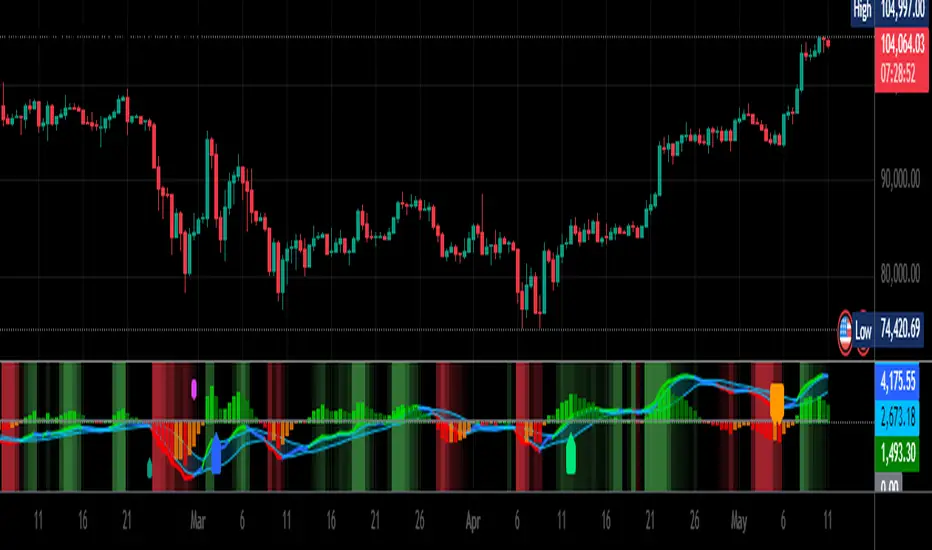
TTP VIX SpyTTP VIX Spy is an indicator that uses data from TVC:VIX to better time entries in the market.
The assumption used is that when the VIX is coming down from the top of its range then the risk on assets can move to the upside and when the VIX is is pushing higher there's a high likelihood or risk on assets going down.
This indicator observes the momentum of VIX using MACD. It offers two different signals both for longs and shorts: signal 1 and 2.
Signal 1 is activate when the begging of a new trend for the VIX is confirmed.
Signal 2 is activated when the VIX pulls back from an extreme value.
You can configure the parameters of the internal super trend and the look back for the slope applied to price and RSIs.
The indicator offers the following filter parameters:
- Price RSI slope: it filters signals that have RSI slope pointing in the opposite direction of the signal.
- Counter trend: it filters signals that are not counter trending super trend.
- Wide BBW: it filters signals that happen when there hasn't been high price volatility
- Price slope: it filters signals when the price is not pointing in the direction of the signal (buy: up, sell: down)
- VIX RSI filter: it filters VIX RSI values overextended. MACD can be in the right range, but sometimes RSI contradicts it. By default is OFF since it can cause false negatives.
- Working days only: it filters signals that occur in the weekend.
The colours below the price action show how the VIX momentum is changing. Transitions from red into pink and then green show how the fear is fading which tends to lead to lead to bullish moves, and the opposite when the transitions are from green to red.
Performance and initial thoughts.
I have tried VIX Spy on both BINANCE:BTCUSDT.P and BINANCE:ETHUSDT.P and it seems to offer a decent win ratio. As you can see I had to add many filter to remove bad entries and left toggles available to decide which ones you want to use.
I tried the signal in the 4H, 1H and 15min with mixed results. I tend to incline for the results in the 1H.
VIX signal offers a backtestable stream and alerts both for signals 1 and 2.
Search in scripts for "MACD"

McGinley Dynamic Convergence/Divergence [ChuckBanger]This is a MACD version with MaGinley Dynamic indicator invented by John R. McGinley. MaGinley Dynamic can be used as a moving average and is a highly reliable indicator. Here i use it instead of EMA witch normally is used to calculate MACD.
For more information of MaGinley Dynamic
www.investopedia.com
Multi-time Frame Trend DirectionThis is a multi-time frame trend direction indicator. It indicates whether the trend is ascending or descending across multiple time frames: 5M, 15M, 30M, 1H, 4H, and Daily.
The logic is based on the positions of EMA12 and EMA26.
These EMAs are smoothed with an SMA.
Why 12 and 26, and why are they smoothed with 9?
As you might surmise, these parameters are derived from the MACD.
I recommend not altering the parameters, but the choice is yours. Enjoy.
MAROC Fast/SlowNot sure if a similar indicator already exist, so I created my own. After creating this indicator, I realize it looks very similar to MACD. However, it strictly uses Hull moving average in its calculation for the lines.
MAROC is simply Moving Average Rate of Change. This is a trend-following indicator that calculates the rate of change on two Hull moving averages. By default it calculates the ROC on 60-period HMA (green and red) and 180-period HMA (blue and orange). The zero line represents the confirmation of change in trend. Above zero is up trend and below zero is down trend. Note the difference between the "trend reversal" and the "confirmation of a trend". I like to define trend reversal by the change in direction
The colored squares on the zero line has 4 colors that represents the overall trend. Here I include the slowdown of MAROC as the start of a trend.
- bright green = when both the slow and fast MA are trending up
- faded green = when slow MA trending up, but fast MA trending down
- faded red = when slow MA trending down, but fast MA trending up
- bright red = when both the slow MA and fast MA are trending down
Trend changes triangles are shown to signal the change in trend direction (trend reversal). Green and blue triangles are trend reversal to the upside. Red and orange triangles are trend reversal to the downside.
This indicator includes the option of displaying buy(long) and sell(short) signals that follows these rules. Use at your own discretion, as it may not apply well with your market or ticker.
- Long = Bright green square and either fast or slow MAROC changes trend direction to the upside
- Short = Bright red square and either fast or slow MAROC changes trend direction to the downside
Enjoy~! Please let me know if you find this useful and which market / ticker and timeframe you are using it on~ :)


MACD COM PONTOS//@version=5
indicator(title="MACD COM PONTOS", shorttitle="MACD COM PONTOS")
//Plot Inputs
res = input.timeframe("", "Indicator TimeFrame")
fast_length = input.int(title="Fast Length", defval=12)
slow_length = input.int(title="Slow Length", defval=26)
src = input.source(title="Source", defval=close)
signal_length = input.int(title="Signal Smoothing", minval = 1, maxval = 999, defval = 9)
sma_source = input.string(title="Oscillator MA Type", defval="EMA", options= )
sma_signal = input.string(title="Signal Line MA Type", defval="EMA", options= )
// Show Plots T/F
show_macd = input.bool(true, title="Show MACD Lines", group="Show Plots?", inline="SP10")
show_macd_LW = input.int(3, minval=0, maxval=5, title = "MACD Width", group="Show Plots?", inline="SP11")
show_signal_LW= input.int(2, minval=0, maxval=5, title = "Signal Width", group="Show Plots?", inline="SP11")
show_Hist = input.bool(true, title="Show Histogram", group="Show Plots?", inline="SP20")
show_hist_LW = input.int(5, minval=0, maxval=5, title = "-- Width", group="Show Plots?", inline="SP20")
show_trend = input.bool(true, title = "Show MACD Lines w/ Trend Color", group="Show Plots?", inline="SP30")
show_HB = input.bool(false, title="Show Highlight Price Bars", group="Show Plots?", inline="SP40")
show_cross = input.bool(false, title = "Show BackGround on Cross", group="Show Plots?", inline="SP50")
show_dots = input.bool(true, title = "Show Circle on Cross", group="Show Plots?", inline="SP60")
show_dots_LW = input.int(5, minval=0, maxval=5, title = "-- Width", group="Show Plots?", inline="SP60")
//show_trend = input(true, title = "Colors MACD Lines w/ Trend Color", group="Show Plots?", inline="SP5")
// MACD Lines colors
col_macd = input.color(#FF6D00, "MACD Line ", group="Color Settings", inline="CS1")
col_signal = input.color(#2962FF, "Signal Line ", group="Color Settings", inline="CS1")
col_trnd_Up = input.color(#4BAF4F, "Trend Up ", group="Color Settings", inline="CS2")
col_trnd_Dn = input.color(#B71D1C, "Trend Down ", group="Color Settings", inline="CS2")
// Histogram Colors
col_grow_above = input.color(#26A69A, "Above Grow", group="Histogram Colors", inline="Hist10")
col_fall_above = input.color(#B2DFDB, "Fall", group="Histogram Colors", inline="Hist10")
col_grow_below = input.color(#FF5252, "Below Grow", group="Histogram Colors",inline="Hist20")
col_fall_below = input.color(#FFCDD2, "Fall", group="Histogram Colors", inline="Hist20")
// Alerts T/F Inputs
alert_Long = input.bool(true, title = "MACD Cross Up", group = "Alerts", inline="Alert10")
alert_Short = input.bool(true, title = "MACD Cross Dn", group = "Alerts", inline="Alert10")
alert_Long_A = input.bool(false, title = "MACD Cross Up & > 0", group = "Alerts", inline="Alert20")
alert_Short_B = input.bool(false, title = "MACD Cross Dn & < 0", group = "Alerts", inline="Alert20")
// Calculating
fast_ma = request.security(syminfo.tickerid, res, sma_source == "SMA" ? ta.sma(src, fast_length) : ta.ema(src, fast_length))
slow_ma = request.security(syminfo.tickerid, res, sma_source == "SMA" ? ta.sma(src, slow_length) : ta.ema(src, slow_length))
macd = fast_ma - slow_ma
signal = request.security(syminfo.tickerid, res, sma_signal == "SMA" ? ta.sma(macd, signal_length) : ta.ema(macd, signal_length))
hist = macd - signal
// MACD Trend and Cross Up/Down conditions
trend_up = macd > signal
trend_dn = macd < signal
cross_UP = signal >= macd and signal < macd
cross_DN = signal <= macd and signal > macd
cross_UP_A = (signal >= macd and signal < macd) and macd > 0
cross_DN_B = (signal <= macd and signal > macd) and macd < 0
// Condition that changes Color of MACD Line if Show Trend is turned on..
trend_col = show_trend and trend_up ? col_trnd_Up : trend_up ? col_macd : show_trend and trend_dn ? col_trnd_Dn: trend_dn ? col_macd : na
//Var Statements for Histogram Color Change
var bool histA_IsUp = false
var bool histA_IsDown = false
var bool histB_IsDown = false
var bool histB_IsUp = false
histA_IsUp := hist == hist ? histA_IsUp : hist > hist and hist > 0
histA_IsDown := hist == hist ? histA_IsDown : hist < hist and hist > 0
histB_IsDown := hist == hist ? histB_IsDown : hist < hist and hist <= 0
histB_IsUp := hist == hist ? histB_IsUp : hist > hist and hist <= 0
hist_col = histA_IsUp ? col_grow_above : histA_IsDown ? col_fall_above : histB_IsDown ? col_grow_below : histB_IsUp ? col_fall_below :color.silver
// Plot Statements
//Background Color
bgcolor(show_cross and cross_UP ? col_trnd_Up : na, editable=false)
bgcolor(show_cross and cross_DN ? col_trnd_Dn : na, editable=false)
//Highlight Price Bars
barcolor(show_HB and trend_up ? col_trnd_Up : na, title="Trend Up", offset = 0, editable=false)
barcolor(show_HB and trend_dn ? col_trnd_Dn : na, title="Trend Dn", offset = 0, editable=false)
//Regular Plots
plot(show_Hist and hist ? hist : na, title="Histogram", style=plot.style_columns, color=color.new(hist_col ,0),linewidth=show_hist_LW)
plot(show_macd and signal ? signal : na, title="Signal", color=color.new(col_signal, 0), style=plot.style_line ,linewidth=show_signal_LW)
plot(show_macd and macd ? macd : na, title="MACD", color=color.new(trend_col, 0), style=plot.style_line ,linewidth=show_macd_LW)
hline(0, title="0 Line", color=color.new(color.gray, 0), linestyle=hline.style_dashed, linewidth=1, editable=false)
plot(show_dots and cross_UP ? macd : na, title="Dots", color=color.new(trend_col ,0), style=plot.style_circles, linewidth=show_dots_LW, editable=false)
plot(show_dots and cross_DN ? macd : na, title="Dots", color=color.new(trend_col ,0), style=plot.style_circles, linewidth=show_dots_LW, editable=false)
//Alerts
if alert_Long and cross_UP
alert("Symbol = (" + syminfo.tickerid + ") TimeFrame = (" + timeframe.period + ") Current Price (" + str.tostring(close) + ") MACD Crosses Up.", alert.freq_once_per_bar_close)
if alert_Short and cross_DN
alert("Symbol = (" + syminfo.tickerid + ") TimeFrame = (" + timeframe.period + ") Current Price (" + str.tostring(close) + ") MACD Crosses Down.", alert.freq_once_per_bar_close)
//Alerts - Stricter Condition - Only Alerts When MACD Crosses UP & MACD > 0 -- Crosses Down & MACD < 0
if alert_Long_A and cross_UP_A
alert("Symbol = (" + syminfo.tickerid + ") TimeFrame = (" + timeframe.period + ") Current Price (" + str.tostring(close) + ") MACD > 0 And Crosses Up.", alert.freq_once_per_bar_close)
if alert_Short_B and cross_DN_B
alert("Symbol = (" + syminfo.tickerid + ") TimeFrame = (" + timeframe.period + ") Current Price (" + str.tostring(close) + ") MACD < 0 And Crosses Down.", alert.freq_once_per_bar_close)
//End Code

MACD Histogram Expansion Alerts (Scalp)Purpose: Alerts when MACD histogram is expanding (momentum increasing) rather than simply crossing. Designed for 1-minute scalping and intraday momentum confirmation.
This script is for traders who are tired of late MACD cross alerts.
Instead of firing when MACD lines cross (which often happens after the move), this indicator alerts when the MACD histogram is expanding — meaning momentum is actually increasing right now, not rolling over.
I use it as a “heads up” alert, not a buy/sell signal. When it fires, I check price action, volume, VWAP, support/resistance, etc., to see if the move is worth trading.
Best suited for 1-minute charts, scalping, and fast intraday momentum.
MACD Histogram Expansion Alerts (Scalp) is a lightweight alert-focused indicator designed for intraday traders and scalpers, particularly on lower timeframes such as the 1-minute chart.
Rather than triggering alerts on standard MACD line crossovers (which tend to lag in fast or volatile markets), this script detects MACD histogram expansion — a condition that indicates momentum acceleration, not just direction.
🔍 What this script does
Uses a fast MACD configuration suitable for lower timeframes
Monitors the MACD histogram slope and magnitude
Triggers alerts only when the histogram expands for multiple consecutive bars
Alerts are fired on bar close only, reducing noise and false intrabar signals
🚀 Why focus on histogram expansion?
Histogram expansion highlights when momentum is building, which can be useful for:
Continuation setups
Early momentum confirmation
Avoiding entries when momentum is already fading
This approach is especially helpful in small caps, news-driven stocks, and volatile intraday instruments, where traditional MACD cross alerts can arrive too late.
🔔 Alert Types
Bullish MACD Histogram Expansion
Bearish MACD Histogram Expansion
Each alert can be enabled independently and is intended as an attention signal, not a standalone trading system.
⚙️ Customizable Inputs
MACD Fast / Slow / Signal lengths
Number of consecutive expanding histogram bars required
Optional minimum histogram magnitude filter
Optional directional filter (above/below zero line)
⚠️ Important Notes!!!!
This script does not place trades
Alerts should be used with additional context, such as price action, volume, VWAP, or support/resistance
Not designed for higher-timeframe or swing trading use .
If you find this helpful, feel free to adapt it to your own trading style or timeframe. This script is meant to be simple, flexible, and non-opinionated.

MACD Matrix: Angle & SettlementThis indicator is a comprehensive Multi-Timeframe (MTF) Dashboard designed for technical traders who rely on MACD not just for crossovers, but for Momentum Angle and Settlement (Hooks).
Instead of cluttering your screen with 5 different MACD charts, this Matrix calculates the math in the background and presents a clean "Heads-Up Display" of the MACD state across your specific timeframes (Default: 3m, 15m, 1h, 4h, 16h).
The Concept: "Angle Settlement"
Standard MACD indicators only show you when a cross happens. By then, the move is often halfway over. This script focuses on the Angle (Slope) of the MACD line to predict turns before they happen:
Steep Angle: Momentum is accelerating. (Strong Trend)
Settling Angle: The slope is flattening out. The MACD line is "hooking." (Reversal/Cross Imminent)
Dashboard Columns Explained
TF (Timeframe): Auto-formats your settings into readable text (e.g., "240" becomes "4h").
Zone:
> 0 (Green): MACD is above the Zero Line (Bullish Trend context).
< 0 (Red): MACD is below the Zero Line (Bearish Trend context).
Cross:
PCO (Green): Positive Crossover (MACD > Signal).
NCO (Red): Negative Crossover (MACD < Signal).
Deg (°):
The calculated mathematical angle of the MACD line.
Positive (+): Momentum is rising.
Negative (-): Momentum is falling.
State (The Strategy):
STEEP (Bright Color): The angle is increasing. Do not trade against this momentum.
SETTLE (Dim Color): The angle is decreasing compared to the previous bar. The momentum is "cooling off," often signaling a "Hook" or an upcoming crossover.
Settings & Customization
Custom Timeframes: You can freely change TF-1, TF-2, etc., in the settings. The table labels will auto-update (e.g., if you change 4h to 1D, the table will display "1D").
MACD Lengths: Fully customizable (Default 12, 26, 9).
Angle Sensitivity: A multiplier to calibrate the "Degrees" to your specific asset class (Crypto, Forex, or Indices). If angles look too small, increase this value.

MACD + Divergence Indicator [Dynamic Filter]Title: MACD + Divergence
Description: This is an enhanced momentum analysis suite based on the classic Moving Average Convergence Divergence (MACD). It addresses the common weakness of the standard MACD—false signals during low-volatility consolidation—by integrating a Dynamic Volatility Filter and a Multi-Timeframe (MTF) Dashboard.
The Problem It Solves: Standard MACD indicators often generate "whipsaw" crossovers when the market is ranging (moving sideways). Traders often struggle to identify these consolidation zones until it is too late. This script solves this by calculating a dynamic "Consolidation Zone" based on Standard Deviation, visually warning traders when momentum is too weak to be reliable.
Key Features:
1. Dynamic Consolidation Filter (The Grey Zone)
The script calculates Upper and Lower bands around the MACD line using Standard Deviation (Volatility).
Grey Fill: When the MACD line is inside the grey bands, the market is in a "Squeeze" or low-volatility consolidation. Crossovers in this zone are often lower probability.
Breakout: When the MACD line exits the bands, it indicates a volatility expansion and a potentially stronger trend.
2. Automated Divergence Detection
Automatically scans for both Regular (Reversal) and Hidden (Continuation) divergences between Price and Momentum.
Bullish: Marked with Green lines/labels.
Bearish: Marked with Red lines/labels.
Customization: You can choose to calculate divergence based on the MACD Line or the Histogram via settings.
3. Multi-Timeframe (MTF) Dashboard
A customizable information table (optional) displays the MACD state across 4 different timeframes (e.g., 15m, 1H, 4H, Daily).
It checks for Trend Alignment (e.g., are all timeframes Bullish?) to help you trade in the direction of the higher timeframes.
4. Enhanced Visuals
4-Color Histogram: Visualizes momentum growing (bright) vs. momentum fading (pale) for both bullish and bearish phases.
Line Highlights: The MACD and Signal lines are clearly distinct, with configurable smoothing options (EMA/SMA).
Settings Guide:
Consolidation Filter: Increase the Dynamic Filter Multiplier (Default: 0.5) to widen the grey zone if you want to filter out more noise.
Oscillator Source: Switch between "MACD Line" or "Histogram" for divergence detection depending on your strategy.
Table: You can toggle the dashboard on/off or change its position to fit your chart layout.
Credits: Base MACD logic derived from standard technical analysis concepts. Dynamic filtering logic adapted from volatility band theories.

macd sma20
### MACD_sma20 – Multi-Timeframe MACD Pullback & SMA20 Dashboard
This script is a complete trading toolkit built around a **MACD pullback strategy** combined with **multi-timeframe SMA20 filters**, volume analysis, and a compact information panel.
It is designed for traders who like to:
* Trade **MACD pullbacks above the moving average**
* Track **key SMA20 levels across multiple timeframes** (Daily, 3-Day, Weekly, Monthly)
* Quickly see whether **current price is above or below those reference levels**
* Use **clean visual signals** for entries and exits, instead of staring at raw indicator values
---
### Core Features
#### 1. MACD Pullback Long Signal (Green Triangle Up)
The script detects a **bullish MACD pullback** pattern:
* MACD line is still **above** the signal line
* Both MACD line and histogram **pull back** for several bars
* Then MACD turns back up again, with price trading **above the local SMA20**
When this “pullback and re-acceleration” is confirmed, a **green triangle below the bar** is plotted as a **long entry signal**.
There is also an optional filter:
* **Weekly SMA20 filter**:
If enabled, long signals are only triggered when **current price is above the Weekly SMA20**, helping you stay on the right side of the higher-timeframe trend.
---
#### 2. Bearish Pullback Confirmation Signal (Red Triangle Down)
On the short side, the script detects a **bearish pullback confirmation** based on:
* A recent **high-volume bearish candle** (large down bar with volume above a multiple of the 20-period volume average)
* At least a minimum number of **negative MACD histogram bars**
* MACD line moving closer to the signal line (loss of momentum)
* Price recovering back up near the **top of that high-volume bearish candle**, then starting to fall again while MACD stays positive
When all conditions align, the script prints a **red triangle above the bar**, indicating a **bearish pullback confirmation** – often a good area to take profits on longs or consider short/hedge setups.
---
#### 3. Signal History Tracking
For both long and short signals, the script internally tracks the **most recent three signals**:
* Timestamp of the signal
* Price at the signal
* Short-term percentage change into the signal
This is mainly for internal use and future expansion, but already gives you a structured signal history if you want to extend or connect the logic later.
---
### Multi-Timeframe SMA20 Dashboard (Bottom-Right Panel)
One of the most useful parts of this script is the **compact dashboard table** in the **bottom-right corner** of the chart. It updates in real time and shows:
1. **Current Price**
2. **Daily SMA20** – value + whether price is above/below
3. **3-Day SMA20** – value + whether price is above/below
4. **Weekly SMA20** – value + whether price is above/below
5. **Monthly SMA20** – value + whether price is above/below
6. **RSI** (current timeframe)
For each timeframe’s SMA20:
* If **price ≥ SMA20**, the status cell is **green** with a ✓
* If **price < SMA20**, the status cell is **red** with a ✗
This gives you, at a glance:
* Is the market in a **short-term uptrend or downtrend** (Daily SMA20)?
* Is the **swing / position trend** healthy (3D & Weekly SMA20)?
* Is the broader **macro structure** supportive (Monthly SMA20)?
You don’t need to manually switch timeframes or add multiple moving averages – the script does all of that for you automatically using `request.security`.
---
### Alerts
The script comes with two built-in alert conditions:
* **MACD回踩转多信号 (MACD pullback bullish signal)**
* **空头回抽确认信号 (Bearish pullback confirmation signal)**
You can attach TradingView alerts to these conditions to get notified whenever a new long or bearish-confirmation setup appears, even when you’re not watching the chart.
---
### How to Use It in Your Trading
1. **Choose your main trading timeframe**
* For intraday swing: 15m / 1h / 4h
* For swing / position: 4h / Daily
2. **Watch the bottom-right SMA20 panel**
* If most higher-timeframe SMA20 rows are **green**, you are trading **with the larger trend**.
* If they are **mixed or mostly red**, you’re either counter-trend or in a choppy transition zone.
3. **Use the green MACD pullback signals**
* Prefer long setups when:
* The **Weekly and Monthly SMA20 rows are green**, and
* The signal appears **above the Daily SMA20**
* This stacks multiple edges: trend + pullback + momentum re-acceleration.
4. **Use the red bearish confirmation signals for risk management**
* Take partial profits on longs when a red signal appears near resistance.
* Consider hedge/short opportunities if higher-timeframe SMA20 rows are already red or turning red.
5. **Use RSI as a context indicator**
* Combine with overbought/oversold zones or your own RSI thresholds for additional confirmation.
---
### Why This Script Is Useful
* **Trend awareness across timeframes**:
You always know where current price sits relative to the Daily / 3-Day / Weekly / Monthly SMA20 – without switching charts.
* **Clear, rule-based signals**:
The MACD logic is explicit and systematic, focused on **pullbacks within trends** rather than random crossovers.
* **Volume-aware bearish logic**:
High-volume bearish candles often mark important supply zones. The script builds this idea directly into the short-side confirmation logic.
* **Visual and intuitive**:
Green/Red triangles + Green/Red table cells make it easy to interpret even if you are not a heavy indicator user.
* **Flexible**:
All key parameters (MACD lengths, SMA length, volume threshold, lookback period, RSI length, weekly filter) are customizable, so you can adapt it to different markets (crypto, stocks, FX) and timeframes.
---
In short, this script is a **multi-timeframe MACD pullback system with an integrated SMA20 dashboard**, suitable for swing traders and position traders who want a structured, visually clean way to align entries with trend and momentum while keeping an eye on higher-timeframe levels.

MACD Volume VWAP Scalping (2min) by Obiii📘 Strategy Description (for TradingView)
MACD Volume VWAP Scalping Strategy (2-Minute Intraday Momentum)
This strategy is designed for scalpers and short-term intraday traders who focus on capturing small, high-probability moves during the most active hours of the trading session — typically between 9:45 AM and 11:30 AM (New York time).
The system combines three key momentum confirmations:
MACD crossovers to detect short-term trend shifts,
Volume spikes to validate real market participation, and
VWAP / EMA alignment to filter trades in the direction of the prevailing intraday trend.
🔹 Entry Logic
Long Entry:
MACD line crosses above the signal line
Both MACD and Signal are above zero
Current volume > average of the last 10 candles
Price is above VWAP and (optionally) above EMA 9 and EMA 20
Short Entry:
MACD line crosses below the signal line
Both MACD and Signal are below zero
Current volume > average of the last 10 candles
Price is below VWAP and (optionally) below EMA 9 and EMA 20
🎯 Exit Logic
Fixed Take Profit: +0.25%
Fixed Stop Loss: -0.15% to -0.20%
Optionally, switch to the 5-minute chart after entry to monitor momentum and manage exits more smoothly.
⚙️ Recommended Settings
Timeframe: 2 minutes (entries), 5 minutes (monitoring)
Market Session: 9:45 AM – 11:30 AM EST
Assets: Highly liquid instruments such as SPY, QQQ, NVDA, TSLA, AAPL, or large-cap momentum stocks.
💡 Notes
This is a momentum-based scalping strategy — precision and discipline are key.
It performs best in high-volume environments where clear direction emerges after the morning volatility settles.
The system can be fine-tuned for different profit targets, MACD settings, or volume thresholds depending on volatility.

MACD Overlay v1 [JopAlgo]Meet the MACD you can trade directly from the chart.
MACD Overlay v1 doesn’t just plot an oscillator somewhere below—
it puts value, momentum, and participation on your candles, and it refuses to fire inside chop.
When a triangle prints, it’s because energy released (expansion), not because the chart looked cute.
What it is:
An execution-ready MACD overlay with phase gating (Expansion-Only), participation gating (Weakness-Lite), and one-click Classic vs VW-MACD Compare—all adaptive, with minimal inputs.
What’s in v1 (feature set)
Overlay ribbon on price: Fast/Slow MACD value rendered as a price-level ribbon with contextual fill and optional candle tint.
Dual value model: Classic MA-MACD (EMA/SMA) and VW-MACD (Rolling VWAP fast/slow).
Compare mode: A/B Classic vs VW-MACD with a VW ghost ribbon.
Weakness-Lite (1-bar, adaptive): Gates/fades low-participation crosses using
RVOL deficit, Effort-vs-Result failure, and over-extension vs value/ATR (Strict adds wick pressure).
Expansion-Only (Impulse/Squeeze): Triangles print only when a cross coincides with a true-range burst and a histogram-slope ignition out of compression.
Signal hygiene: ±1-bar proximity around crosses, slope awareness, 2-bar debounce.
Explainable filtering: Tiny gray dots show crosses that were intentionally filtered (weak and/or no expansion).
How to use:
Use defaults: Mode Classic, Gate by Weakness ON, Expansion-Only ON, Sensitivity Auto.
Read signals fast:
Solid triangle = cross + expansion confirmed (+ not weak if gate is ON).
Faded triangle = cross + expansion but weak participation (visible only when gate is OFF).
Gray dot = there was a cross, but it was filtered (no genuine expansion or weak & gated).
Validate quickly: Flip Compare to check VW-MACD agreement. Classic + VW alignment usually improves confidence.
Why overlay > sub-pane oscillator
You see where the cross occurs: relative to value, local structure, and S/R, right on price.
The ribbon exposes regime shifts; tint hints expansion vs contraction at a glance.
Execution becomes more context-aware and less “signal-in-a-vacuum.”
Signals & visuals
Triangles (solid): MACD crossed Signal and market showed expansion out of compression; if Gate by Weakness is ON, triangle prints only with acceptable participation.
Triangles (faded): Same as above but weak (shown only when you turn the gate OFF).
Gray dots: Crosses that were filtered (no expansion and/or Weakness gate).
Ribbon: Fast vs Slow value (Classic or VW, according to Mode). Fill and candle tint reflect expansion/contraction.
Inputs
Calculation Mode: Classic | VW | Compare
VW uses Rolling VWAP fast/slow.
Compare: Classic is primary; VW shows as a ghost ribbon for A/B checks.
Gate triangles by Weakness: ON/OFF
Uses RVOL, Effort-vs-Result, extension vs value/ATR (Strict adds wick-pressure).
Sensitivity: Off / Auto / Strict (default Auto).
Expansion-Only (Impulse/Squeeze): ON/OFF
Requires compression → release: tight ribbon + flat momentum, then TR/ATR burst with hist slope flip / cross proximity.
Display: Ribbon / Candle Tint / Weakness Markers.
Advanced (optional): Evaluate Weakness only near signals, Channel (k × |MACD|), Style Preset.
No numeric thresholds to tune—all filters self-calibrate from rolling stats.
Best practices
4H crypto: Defaults are strong—Auto, Gate ON, Expansion-Only ON.
Clean trends: If you feel you miss some tidy resumptions, briefly toggle Expansion-Only OFF.
Choppy regimes: Set Sensitivity → Strict to cut more noise without adding lag.
Confirmation: Use Compare; Classic + VW alignment typically yields better follow-through.
Alerts
MACD Signal Cross Up/Down — execution-grade (use Once per bar close).
Weakness-Lite Flag — optional context alert to help audit filtered crosses.
Attribution & License
Attribution: Based on the algorithmic concept of TradingView’s built-in MACD (fast MA – slow MA, signal, histogram).
No original TradingView source code is redistributed; overlay rendering, VW-MACD, Weakness-Lite, Expansion-Only, gating visuals, and UX are new work.
License: MPL-2.0. Educational purposes only—not financial advice.

MACD-V with RSI Gradient## Overview
MACD-V is a volatility-adjusted momentum indicator that normalizes MACD using ATR. This version adds a dynamic RSI-based background gradient to highlight momentum zones visually.
## Features
- **MACD-V Line**: EMA-based momentum normalized by ATR
- **Signal Line**: EMA of MACD-V
- **Histogram**: Color-coded based on slope and polarity
- **RSI Gradient Background**: Shading from bright green (RSI > 75) to bright red (RSI < 30), with intermediate tones for momentum context
## Use Case
Designed for 30-minute oil futures charts, this indicator helps identify:
- Trend strength and reversals
- Momentum zones using RSI shading
- Pullback opportunities and exhaustion zones
## Inputs
- Fast EMA (default: 12)
- Slow EMA (default: 26)
- Signal EMA (default: 9)
- ATR Length (default: 26)
## Notes
- RSI shading is purely visual—no alerts are wired in yet
- Histogram renders behind MACD-V and Signal lines for clarity
- Colors are tuned for dark charts
## Credits
The MACD-v is an indicator created in 2015 by Alex Spiroglou
and presented to the public in 2022
as a paper called: "𝗠𝗔𝗖𝗗-𝘃: 𝗩𝗼𝗹𝗮𝘁𝗶𝗹𝗶𝘁𝘆 𝗡𝗼𝗿𝗺𝗮𝗹𝗶𝘀𝗲𝗱 𝗠𝗼𝗺𝗲𝗻𝘁𝘂𝗺"
It received the following Awards:
1. “𝐅𝐨𝐮𝐧𝐝𝐞𝐫𝐬 𝐀𝐰𝐚𝐫𝐝” (2022),
for advances in Active Investment Management
from the National Association of Active Investment Managers (NAAIM)
2. “𝐂𝐡𝐚𝐫𝐥𝐞𝐬 𝐇. 𝐃𝐨𝐰 𝐀𝐰𝐚𝐫𝐝” (2022)
for outstanding research in Technical Analysis,
from the Chartered Market Technicians Association (CMTA)
The RSI Gradient was my idea, but quite frankly, if I go looking around I suppose I'll find that others had the same idea.
This is the first time I've ever published any code, so if I stepped on anyone's toes. I'm sorry.

MACD-V - Volatility(ATR) normalized MACDThe MACD-V indicator modifies the traditional MACD formula by dividing the difference between the two Exponential Moving Averages (EMAs) by the Average True Range (ATR)
The key advantages of this indicator over MACD are:
Cross-market comparability: The classic MACD gives different readings for different instruments (like a stock versus a commodity) that are not directly comparable. MACD-V's normalization makes momentum readings comparable across different markets.
Time-based stability: Classic MACD readings can't be reliably compared over long periods of time due to changes in an asset's price and volatility. MACD-V's volatility adjustment creates more stable and consistent readings over time.
Reduction of false signals: In sideways or low-momentum markets, the traditional MACD can generate numerous false crossover signals near the zero line. MACD-V filters out these false signals by defining specific "neutral zones," typically between -50 and +50, where crossovers are ignored.
Consistent Thresholds : MACD-V overbought and oversold thresholds (e.g., +150 and -150) are independent of instrument price, allowing for a more objective framework for analyzing momentum.

MACD Scaled Overlay█ OVERVIEW
The "MACD Scaled Overlay" indicator is an advanced version of the classic MACD (Moving Average Convergence Divergence) oscillator that displays signals directly on the price chart. Instead of a traditional separate panel, the MACD line, signal line, and histogram are scaled and overlaid on the price chart, making it easier to identify key price levels and potential reversal points. The indicator also supports the detection of divergences (regular and hidden) and offers extensive customization options, such as adjusting colors, line thickness, and enabling/disabling visual elements.
█ CONCEPTS
The "MACD Scaled Overlay" indicator is designed to simplify trend and reversal analysis by integrating MACD signals with the price chart. The MACD Scaled Overlay is scaled relative to the average candle range, allowing the lines and histogram to dynamically adjust to market volatility. Additionally, the indicator enables the detection of divergences (bullish and bearish, both regular and hidden) based on the traditional MACD histogram (before scaling), ensuring consistency with classic divergence analysis. The indicator is most effective when combined with other technical analysis tools, such as Fibonacci levels, pivot points, or trend lines.
█ MACD Calculations and Scaling
The indicator is based on the classic MACD formula, which includes:
-MACD Line: The difference between the fast EMA (default: 12) and the slow EMA (default: 26).
-Signal Line: The EMA of the MACD line (default: 9).
-Histogram: The difference between the MACD line and the signal line.
Scaling is achieved by normalizing the MACD values relative to the standard deviation and the average candle range. This makes the lines and histogram dynamically adjust to market volatility, improving their readability and utility on the price chart. The scaling formulas are:
-MACD Scaled: macdNorm * avgRangeLines * scaleFactor
-Signal Scaled: signalNorm * avgRangeLines * scaleFactor
-Histogram Scaled: histNorm * avgRangeHist * scaleFactor
Where:
-macdNorm and signalNorm are the normalized MACD and signal line values.
-avgRangeLines and avgRangeHist are the average candle ranges.
-scaleFactor is the scaling multiplier (default: 2).
The positioning of the lines and histogram is relative to the candle midpoint (candleMid = (high + low) / 2), ensuring proper display on the price chart. Divergences are calculated based on the traditional MACD histogram (before scaling), maintaining consistency with standard divergence detection methodology.
█INDICATOR FEATURES
-Dynamic MACD and Signal Lines: Scaled and overlaid on the price chart, facilitating the identification of reversal points.
-Histogram: Displays the difference between the MACD and signal lines, dynamically adjusted to market volatility.
-Divergence Detection: Ability to detect regular and hidden divergences (bullish and bearish) based on the traditional MACD histogram, with options to enable/disable their display.
-Visual Customization: Options to adjust colors, line thickness, transparency, and enable/disable elements such as the zero line, MACD line, signal line, or histogram.
-Smoothing: Smoothing length for lines (default: 1) and histogram (default: 3). Smoothing may delay crossover signals, which should be considered during analysis.
-Alerts: Alert conditions for MACD and signal line crossovers, enabling notifications for potential buy/sell signals.
█ HOW TO SET UP THE INDICATOR
-Add the "MACD Scaled Overlay" indicator to your TradingView chart.
-Configure parameters in the settings, such as EMA lengths, scaling multiplier, or smoothing periods, to match your trading style.
-Enable or disable the display of the zero line, MACD line, signal line, or histogram based on your needs.
-Adjust colors and line thickness in the "Style" section and transparency settings in the input section to optimize visualization.
█ HOW TO USE
Add the indicator to your chart, configure the parameters, and observe the interactions of the price with the MACD line, signal line, and histogram to identify potential entry and exit points. Key signals include:
-MACD and Signal Line Crossovers: A crossover of the MACD line above the signal line may indicate a buy signal (bullish cross), while a crossover below the signal line may indicate a sell signal (bearish cross).
-Crossings Through the Price Line (Zero): The MACD line or histogram crossing the price line (candle midpoint) may indicate a change in momentum. For example, the histogram moving from negative to positive values near the price line may signal increasing bullish trend strength.
-Divergences: Detection of regular and hidden divergences (bullish and bearish) based on the traditional MACD histogram can help predict trend reversals. Divergences are not standalone signals, as they are delayed by the specified pivot length (default: 3). However, they help strengthen the significance of other signals, such as crossovers or support/resistance levels.
The indicator is most effective when combined with other tools, such as Fibonacci levels, pivot points, or support/resistance lines, to confirm signals.

MACD Positive & Negative AlertThe MACD (Moving Average Convergence Divergence) is a momentum and trend-following indicator that helps traders identify the strength and direction of a trend, spot potential reversals, and fine-tune entry/exit timing.
Core Components
- MACD Line:
The difference between the 12-period and 26-period EMA (Exponential Moving Averages). This line highlights shifts in momentum and identifies the prevailing trend direction.
- Signal Line:
A 9-period EMA of the MACD line, acting as a trigger for buy/sell signals. When the MACD line crosses above the signal line, it suggests a bullish signal; when it crosses below, it suggests a bearish one.
- Histogram:
Shows the difference between the MACD line and the signal line as a bar graph. The histogram helps traders gauge the strength of the momentum and can warn of possible reversals. A rapidly growing histogram means strengthening momentum, while a shrinking one indicates weakening momentum.
Main Uses
- Trend Identification:
A positive MACD value typically signals a bullish trend, while a negative value signals a bearish trend.
- Momentum Analysis:
Divergences between MACD and price can warn of upcoming reversals. Increasing MACD histogram bars confirm strong momentum; shrinking bars suggest consolidation or reversal.
- Signal Generation:
Crossovers between the MACD line and the signal line generate trade signals—bullish (buy) if the MACD moves above the signal, bearish (sell) if it falls below l.
Example Interpretation
- MACD Crossover:
If the MACD line crosses above the signal line, it's often considered a buy signal; a cross below is a sell signal.
- Zero Line Cross:
If the MACD histogram moves from below zero to above, this is considered a bullish momentum shift; above zero to below is a bearish move.
The MACD is most effective in trending markets and should ideally be used alongside additional indicators for robust trading decisions.

MACD-V (Volatility-Normalised Momentum) — Spiroglou, 2022Volatility-normalized MACD per Alex Spiroglou (2022):
MACD-V = (EMA12 − EMA26) / ATR26 × 100, so momentum is expressed in ATR units and stays comparable across assets/timeframes.
What you get
• Trend-colored line: green when price ≥ EMA200, red otherwise.
• Guides: ±50 / ±100 / 0; Extremes: ±140 (editable).
• Regime shading: OB ≥ +140 shaded red; OS ≤ −140 shaded green.
• Clean, on-curve markers: small circles on the MACD-V line at the four edge events — OB (enter ≥ +threshold), OBX (cross back down), OS (enter ≤ −threshold), OSX (cross back up).
• Text labels are off by default; optional toggle only for OB/OBX.
• Signal & histogram: EMA(9) of MACD-V and (MACD-V − Signal) columns.
• Alerts: OB/OS entries & exits included.
How to use
• Favor longs when MACD-V > 0 (ideally > +50); respect OB for possible exhaustion.
• Favor shorts when MACD-V < 0 (ideally < −50); respect OS for possible exhaustion.
• Because it’s ATR-normalized, thresholds transfer well across symbols and timeframes.

day trading check indicatorDay Trading Check Indicator
By Trades per Minute · Creator: Trader Malik
Overview
The Day Trading Check Indicator is an on‐chart status panel that gives you a quick “go/no-go” snapshot of four key metrics—MACD, VWAP, Float, and Bearish Sell-Off—directly in TradingView’s top-right corner. It’s designed for fast decision-making during high-velocity intraday sessions, letting you instantly see whether each metric is “bullish” (green) or “bearish” (red), plus live float data.
What It Shows
Column Description
Metric The name of each metric: MACD, VWAP, Float, Bearish Sell-Off
Status/Value A color-coded status (“GREEN”/“RED” or “YES”/“NO”) or the float value formatted in K/M/B
Metrics & Calculations
MACD (1-Minute)
Calculation: Standard MACD using EMA (12) – EMA (26) with a 9-period signal line, all fetched from the 1-minute timeframe via request.security().
Status:
GREEN if MACD ≥ Signal
RED if MACD < Signal
VWAP (Session-Anchored)
Calculation: Built-in session VWAP (ta.vwap(close)) resets each new trading session.
Status:
GREEN if current price ≥ VWAP
RED if current price < VWAP
Float
Calculation: Retrieves syminfo.shares_outstanding_float (total float), then scales it into thousands (K), millions (M), or billions (B), e.g. “12.3 M.”
Display: Always shown as the absolute float value, white on semi-transparent black.
Bearish Sell-Off
Calculation: Checks the last five 1-minute bars for any “high-volume down” candle (volume above its 20-bar SMA and close < open).
Status:
YES if at least one such bar occurred in the past 5 minutes
NO otherwise
Key Features
Dynamic Table: Automatically shows only the metrics you enable via the Display Options group.
Size Selector: Choose Small, Medium, or Large text for easy visibility.
Clean Styling: Distinct header row with custom background, consistent row shading, centered status text, and a subtle gray border.
Lightweight Overlay: No cluttering plots—just a concise status panel in the corner.
Published by Trader Malik / Trades per Minute
Version: Pine Script v5

ANDROMEDA - TrendSyncANDROMEDA - TrendSync
Pedro Canto - Portfolio Manager | CGA/CGE
OVERVIEW
Trend Sync is a multi-layered trend-following indicator designed to help traders identify high-probability trend continuation setups while avoiding low-quality entries caused by overbought or oversold market conditions.
This indicator combines the power of Moving Averages (MA), MACD , and a visual RSI-based filter to validate both trend direction and timing for entries. It's goal is simple: filter out noise and highlight only the most technically relevant buy and sell signals based on objective momentum and trend criteria.
---
WALKTHROUGH
This indicator is built for traders seeking to operate in the direction of established trends. It's core principle is to identify and validate current trend conditions, and then signal entry opportunities during pullbacks to key moving averages.
Trend identification is achieved through the alignment of two moving averages. When these MAs are crossed and angled in the same direction, they confirm that a trend is in progress. To double-confirm trend direction, the MACD histogram is used—only. When both the MAs and MACD are aligned in the same direction, then the trend is considered valid.
Once all trend criteria are met, a dynamic coloring system is activated to visually reinforce the trend across the candles and moving averages.
To avoid poor entries during market exhaustion, an RSI-based filter is used. This short-term RSI highlights overbought or oversold zones, helping traders filter trades in extreme price conditions.
Only when the trend is validated and price pulls back to one of the MAs will a buy/sell signal be triggered, aligning momentum, price action and timing into a single actionable setup.
This combination ensures that each component plays a specific role:
i) Moving Averages define the trend
ii) MACD validates it
iii) RSI filters noise
iv) Intrabar price action triggers entries
This synchronism helps improve decision-making and entry timing, especially for swing and intraday traders.
---
USE CASES
- Identifying trend continuation setups
- Filtering false signals during consolidation phases
- Avoiding trades in overbought or oversold zones
- Enhancing entry timing for both swing and intraday strategies
- Providing visual confirmation of trend strength and momentum alignment
---
KEY FEATURES
1. Dual Moving Average Setup
The indicator allows full customization of two moving averages (MA1 and MA2), supporting both EMA and SMA types. The slope of the longer MA (MA2) acts as an essential trend filter, ensuring signals are only generated when the market shows clear directional bias.
2. MACD Histogram Trend Confirmation
A classic MACD Histogram calculation is used to validate the momentum of the prevailing trend.
- Bullish Trend: Histogram > 0
- Bearish Trend: Histogram < 0
This step filters out counter-trend signals and ensures trades are aligned with momentum.
3. Intrabar Price Trigger
Unlike standard crossover systems, this indicator waits for intrabar price action to trigger entries:
- Buy Signal: Price crosses below one of the MAs during an uptrend (dip-buy logic)
- Sell Signal: Price crosses above one of the MAs during a downtrend (rally-sell logic)
This intrabar trigger improves entry timing and helps capture retracement-based opportunities.
4. RSI Visual Filter
A short-term RSI is plotted and color-coded to visually highlight overbought and oversold conditions, acting as a discretionary filter for users to avoid low-probability trades during exhaustion points.
5. Dynamic Coloring System
Bar Colors:
- Blue: Bullish trend
- Red: Bearish trend
- Orange: RSI Overbought/Oversold zones
MA Colors:
- Blue for bullish conditions
- Red for bearish conditions
- Gray for neutral/no-trend phases
6. Signal Markers and Alerts
Clear visual buy and sell markers are plotted directly on the chart.
Additionally, the indicator includes real-time alerts for both Buy and Sell signals, helping traders stay informed even when away from the screen.
---
INPUTS AND CUSTOMIZATION OPTIONS
- Moving Average Types: EMA or SMA for both MA1 and MA2.
- MACD Settings: Customizable fast, slow, and signal periods.
- RSI Settings: Source, length, and overbought/oversold levels fully adjustable.
- Color Customization: Adjust RSI zone colors to suit your chart theme.
---
DISCLAIMER
This indicator is a technical analysis tool designed for educational and informational purposes only. It should not be used as a standalone trading system. Always combine it with sound risk management, price action analysis, and, where applicable, fundamental context.
Past performance does not guarantee future results.

MACD Support and Resistance [ChartPrime]⯁ OVERVIEW
MACD Support and Resistance is a dynamic support/resistance mapping tool powered by MACD crossover logic. Each time the MACD line crosses the signal line, the indicator scans for recent price extremes and locks them in as potential support or resistance zones. These levels are automatically cleaned up if price breaks them, keeping the chart focused on active market structure. The system includes a built-in MACD display with visual markers, along with contextual highs and lows to help define the current environment.
⯁ MACD-BASED SUPPORT/RESISTANCE GENERATION
The core logic uses the MACD oscillator crossover as a trigger event to generate structural levels:
When MACD crosses above its signal line:
→ The script scans the last 5 bars for the lowest low .
→ A support level is plotted at that price.
When MACD crosses below its signal line:
→ The script scans the last 5 bars for the highest high .
→ A resistance level is plotted at that price.
These dynamic levels reflect where price recently reversed or paused, making them prime zones for reaction, continuation, or invalidation.
⯁ LEVEL MANAGEMENT AND VALIDATION
To keep the chart clean and relevant:
A maximum of 20 active levels are allowed at once.
Older levels are automatically removed if the list exceeds the limit.
If price closes below a support level or above a resistance level , the corresponding line is deleted.
This ensures that only currently respected levels remain on the chart — a major advantage for active traders.
⯁ MACD VISUALIZATION + SIGNAL MARKERS
A full MACD system is rendered on the lower panel for visual confirmation:
The MACD line and Signal line are both plotted and color-coded dynamically.
A filled area] highlights the spread between them to emphasize momentum strength.
A diamond marker is drawn each time MACD crosses its signal line, alerting traders to potential trend shifts.
These visuals make it easy to understand the timing of the support/resistance updates.
⯁ LOCAL EXTREME REFERENCE LINES
To help contextualize current price position relative to recent market extremes:
A Local High line is plotted based on the highest MACD value over the past 100 bars].
A Local Low line is plotted based on the lowest MACD value over the past 100 bars].
These levels are rendered lightly and serve as dynamic range boundaries.
They assist traders in identifying overextended or compressed MACD behavior.
⯁ USAGE
Use the generated S/R levels as breakout or reversal zones.
Watch for MACD diamond markers to confirm the timing of new levels.
Combine these reactive zones with other ChartPrime confluence tools for higher-confidence entries.
Use the Local High/Low zones as a volatility envelope to guide risk and trend continuation potential.
⯁ CONCLUSION
MACD Support and Resistance takes a classic momentum indicator and adds real-time structural awareness. By linking MACD crossover events to recent price extremes, it identifies the zones where market sentiment shifted — and continues to monitor their strength. Whether you're a breakout trader or looking to fade key reaction points, this tool delivers clean, actionable levels based on momentum and structure — not guesswork.

4 colour MACD with Delta % + Div LabelMACD 4C + Delta % + Divergence Label
This advanced MACD-based indicator is designed for professional traders seeking enhanced momentum analysis with visual clarity. It offers a multi-faceted view of MACD behavior with real-time insights into trend strength, acceleration, and divergence signals.
Key Features:
4-Color MACD Histogram:
Visually distinguishes between rising and falling MACD bars in both bullish and bearish zones for quicker momentum assessment.
Delta % Labels:
Each bar displays the percentage change in MACD compared to the previous bar, providing instant feedback on MACD acceleration and shift in momentum.
Automatic Divergence Detection:
Identifies regular bullish and bearish divergences using pivot-based logic. Displays clear, compact labels near MACD bars to highlight potential reversal zones.
Clean, Minimalist Design:
Divergence labels are sized for readability and positioned to avoid overlapping with MACD data, ensuring clean chart presentation.
No repainting or lag:
All divergence calculations are based on confirmed pivots, ensuring reliable signal generation without false alerts.
This tool is ideal for scalpers, swing traders, and momentum traders who rely on MACD dynamics for precise timing and directional bias. Use it to improve your entry and exit accuracy by combining traditional MACD signals with real-time volume and divergence insight.
🔹 Usage Notes
Recommended Timeframes:
Works well on all timeframes. For scalping, use 1m–5m; for swing trading, use 15m–1H+.
Best for:
Traders looking for a fast, visual way to assess trend strength and spot divergence-based reversal opportunities.
Pair With:
Can be used alongside price action, volume profile, RSI, or order flow-based indicators for confirmation.
How to Read:
Green/Red MACD bars indicate bullish/bearish momentum.
Delta % shows MACD change rate — increasing positive delta = strengthening trend.
Arrows/text labels signal potential divergence — pay attention when divergence aligns with support/resistance or price structure.
Notes:
No repainting — divergence is only drawn after pivots are confirmed.
All labels are automatically managed for clean display.
Can be customized further for hidden divergences or alert integration.
Gap Reversal Signal with Indicators🔍 Gap Reversal Signal with Indicators — 結合 KD、MACD、SAR 與背離分析的多功能指標
🔍 Gap Reversal Signal with Indicators — A Multi-Tool Signal Indicator Combining KD, MACD, SAR, and Divergence Analysis
中文說明:
本指標結合多種常用技術分析工具,包括 KD 隨機指標、MACD 動能交叉、SAR 趨勢方向、以及 MACD 背離偵測,用以辨識潛在的價格反轉區域。適用於日內交易與波段操作,支援各類市場,如加密貨幣、股票與外匯等。
English Description:
This indicator combines several popular technical tools: Stochastic KD, MACD momentum crossovers, SAR trend direction, and MACD divergence detection. It helps traders identify potential reversal areas and is ideal for both intraday and swing trading. Works well on crypto, stocks, and forex markets.
🧠 功能特點 | Key Features
✅ KD指標(慢速隨機指標)檢測超買超賣並提供%K與%D交叉訊號
✅ Stochastic KD (slow) to detect overbought/oversold zones and crossover signals
✅ MACD金叉/死叉與零軸突破捕捉趨勢轉變與動能反轉
✅ MACD Crossovers + Zero-Line Breaks to capture trend changes and momentum reversals
✅ SAR指標即時顯示多空方向
✅ Parabolic SAR for real-time trend direction indication
✅ MACD背離偵測協助辨識潛在反轉區域
✅ MACD Divergence Detection for identifying hidden trend reversals
✅ 圖形提示與標籤提示可視化呈現各類訊號
✅ Visual Alerts and Labels for easy and quick signal recognition
📈 支援市場 | Supported Markets
📊 台股 / 美股 / 外匯 / 加密貨幣
📊 Taiwan Stocks / US Stocks / Forex / Cryptocurrencies (e.g. BTC, ETH)
🔧 推薦用法 | Recommended Use
搭配缺口策略與支撐壓力位使用
Use with gap-trading strategies and support/resistance zones
用於盤整末期或趨勢反轉的提示
Helpful for end-of-consolidation signals or trend reversals
支援短線與波段交易風格
Suitable for scalping and swing trading styles
💡 把這個指標加入你的圖表,立即體驗多重技術分析所帶來的交易優勢!
💡 Add this indicator to your chart now and experience the power of multi-tool technical analysis!

BK AK-47 Divergence🚨 Introducing BK AK-47 Divergence — Multi-Timeframe Precision Firepower for True Traders 🚨
After months of development, I’m proud to release my fifth weapon in the arsenal — BK AK-47 Divergence.
💥 Why “AK-47”? The Meaning Behind the Name
The AK-47 isn’t just a rifle. It’s the symbol of reliability, versatility, and raw stopping power. It performs in every environment — from the mud to the mountains — just like this indicator cuts through noise on any timeframe, any asset, any condition.
🔸 “AK” honors the same legacy as before — my mentor, A.K., whose discipline and vision forged my trading edge.
🔸 “47” signifies layered precision: 4 = structure, 7 = spiritual completion. Together, it’s the weapon of divine order that adapts, reacts, and strikes with purpose.
🔍 What Is BK AK-47 Divergence?
It’s a next-generation divergence detector — a smart hybrid of MACD, Bollinger Bands, and multi-timeframe divergence logic wrapped in a custom volatility engine and real-time flash alerts.
Designed for snipers in the market — those who only take the highest-probability shots.
⚙️ Core Weapon Systems
✅ MACD + BB Precision Overlay → MACD plotted inside dynamic Bollinger Bands — reveals hidden pressure zones where most indicators fail.
✅ Smart Histogram Scaling → Adaptive amplification based on volatility. No more weak histograms in strong markets.
✅ Full Multi-Timeframe Divergence Detection:
🔻 Current TF Divergence
🕐 Higher TF Divergence
⏱️ Lower TF Divergence
Each plotted with clean visual alerts, color-coded by direction and timeframe. You get instant divergence recognition across dimensions.
✅ Background Flash Alerts → When MACD hits BB extremes, the background lights up in red or green. Eyes instantly lock in on key moments.
✅ Advanced Pivot Lookback Control → New lookback system compares multiple pivot layers, not just the last swing. This gives true structural divergence, not just noise.
✅ Dynamic Fill Zones:
🔴 Oversold
🟢 Overbought
🔵 Neutral
Built to filter false signals and highlight hidden edge.
🛡️ Why This Indicator Changes the Game
🔹 Built for divergence snipers — not lagging MACD watchers.
🔹 Perfect for traders who sync with:
• Elliott Waves
• Fibonacci Time/Price Clusters
• Harmonic Patterns
• Gann Angles or Squares
• Price Action & Trendlines
🔹 Lets you visually map:
• Converging divergences (multi-TF confirmation)
• High-volatility histograms in low-volatility price zones (entry sweet spots)
• Flash-momentum warnings at BB pressure zones
🎯 How to Use BK AK-47 Divergence
🔹 Breakout Confirmation → MACD breaches upper BB with bullish divergence = signal to ride momentum.
🔹 Mean Reversion Reversals → MACD breaks lower BB + bullish div = setup for sniper long.
🔹 Top/Bottom Detection → Bearish divergence + MACD failure at upper BB = early reversal signal.
🔹 TF Sync Strategy → Align current TF with higher or lower divergences for laser-confirmed entries.
🧠 Final Thoughts
This isn’t just a divergence tool. It’s a battlefield reconnaissance system — one that lets you see when, where, and why the next pivot is forming.
🔹 Built in honor of the AK-legacy — reliability, discipline, and firepower.
🔹 Designed to cut through noise, expose structure, and alert you to what really matters.
🔹 Crafted for those who trade with intent, vision, and respect for the craft.
🙏 And most importantly: All glory to Gd — the One who gives wisdom, clarity, and purpose.
Without Him, the markets are chaos. With Him, we move in structure, order, and divine timing.
—
⚡ Stay dangerous. Stay precise. Stay aligned.
🔥 BK AK-47 Divergence — Locked. Loaded. Laser-focused. 🔥
May the markets bend to your discipline.
Gd bless. 🙏