ATR with Take and StopThis simple indicator will plot the take profit and stop loss values based on the ATR indicator.
It's possible to set how many times the ATR value will be applied to the closing price and
what trade type is used, Long or Short.
Search in scripts for "TAKE"

Take Session High/Low Alert [MsF]Japanese below / 日本語説明は英文の後にあります。
-------------------------
This indicator that displays High/Low lines for each session. The Key Levels of each session can be visually recognized, which is useful for PD Array analysis. You can display the last 3 days. Based on trinity by ICT.
The biggest feature is that the color shape of the line changes when reaching High/Low. Of course, you can also set alerts.
Unreached High/Low lines can be extended to the right. hides all timeframes over 1 hour. (alert is alive)
You can choose 4 sessions. If you only want to use 3 sessions, you can do that by setting the same session time for 2 of the 4 session settings.
About Parameter Settings
Session Time: Please set it to be a 24-hour cycle. You can also specify the time zone. The default is NY time.
Basis/Other color: The first time specified in "Session Time" in this indicator's parameter is the "Basis color". "Other color" is a line other than that.
Enable Time Lines: You can turn on/off the display of vertical lines.
High/Low color: High/Low line setting that has not been reached.
Taken color: High/Low line setting that has already been reached.
Extend Lines: Allows unreached High/Low lines to be extended to the right in the chart.
-------------------------
セッションごとのHigh/Lowをライン表示するインジケーターです。
過去約3日分を表示することができます。
最大の特徴はHigh/Low到達時にラインの色形が変わることです。もちろんアラート設定も可能です。
未到達のHigh/Lowラインは右側に延長することができます。
チャート表示がビジーとなる為、1時間を超える時間足ではすべて非表示とする仕様です。(アラートは生きてます)
セッションは4つ指定できます。
もしセッションを3つのみ使用したい場合は、4つのセッション設定の内2つに同じセッション時間を設定することで実現可能です。
■パラメータ設定
Session Time:24時間周期となるように設定してください。またタイムゾーンが指定できます。デフォルトはNY timeです。
Basis/Other color:パラメータの"Session Time"にて一番最初に指定した時間が基準=Basisとなります。Otherはそれ以外のラインとなります。
Enable Time Lines:垂直ラインの表示ON/OFFが可能です。
High/Low color:未到達のHigh/Lowライン設定となります。
Taken color:到達済みのHigh/Lowライン設定となります。
Extend Lines:未到達のHigh/Lowラインを右に延長できます。

Take Profit CalculatorRelease Notes: Take Profit Calculator v1.0
Introduction
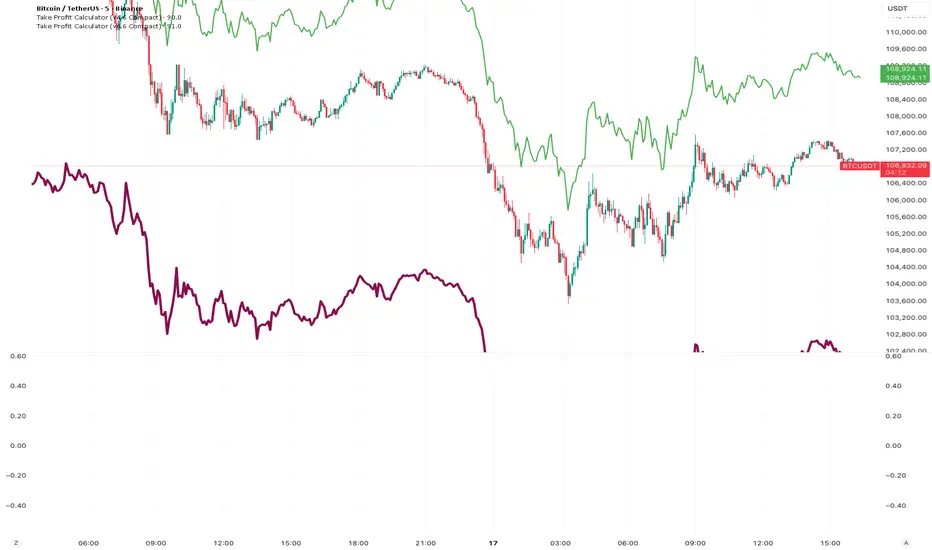
Introducing the Real-Time Take Profit Calculator, a dynamic tool for TradingView designed to instantly calculate and display your target exit price. This indicator eliminates the need for manual calculations, allowing scalpers and day traders to see their profit targets directly on the chart as the market moves.
Key Features
Dynamic Target Calculation: The take-profit line is not static. It recalculates on every tick, moving with the current price to show you the exact target based on a real-time entry point.
Full Trade Customization:
Margin: Set the amount of capital (in USDT) you are allocating to the trade.
Leverage: Input your desired leverage to accurately calculate the total position size.
Desired Profit: Specify your target profit in USDT, and the indicator will calculate the corresponding price level.
Long & Short Support: Easily switch between "Long" and "Short" trade directions. The indicator will adjust the calculation and the visual style accordingly.
Customizable Display:
Change the color and width of the take-profit line for both long and short scenarios.
Toggle a price label on or off for a cleaner chart view.
How to Use
Add to Chart: Apply the "Take Profit Calculator" indicator to your chart.
Open Settings: Double-click the indicator name or the line itself to open the settings panel.
Enter Your Parameters: Under "Trade Parameters," fill in your Margin, Leverage, and Desired Profit.
Select Direction: Choose either "Long" or "Short" from the Trade Direction dropdown.
Analyze: The horizontal line on your chart now represents the exact price you need to reach
Take Profit ModelThis Indicator allows you to define 9 Taking Profit levels between your floor price and a target price you define for 10 selectable Assets and tweak the levels to your preference. It does not do any fancy dynamic calculations, it just draws lines on the chart where you want them so that you have an easy reference for when to take profit (or not).
Example:
So, if your floor price for an asset is e.g. $10 and your target price is $110 (its up to you to define, who knows right, I do not have a crystal ball), You have a range of $100 where you can set your levels as follows
The first level is the Floor price you entered = $10
Formula: Level x (Target - Floor) + Floor = Take Profit level
Levels
0.1 x (110 - 10) + 10 = $20
0.2 x (110 - 10) + 10 = $30
0.3 x (110 - 10) + 10 = $40
0.4 x (110 - 10) + 10 = $50
0.5 x (110 - 10) + 10 = $60
0.6 x (110 - 10) + 10 = $70
0.7 x (110 - 10) + 10 = $80
0.8 x (110 - 10) + 10 = $90
0.9 x (110 - 10) + 10 = $100
And finally the last level is drawn for the target price
Target Price = $110
To change the settings, go to the cog icon of the Indicator, select the assets (Tickers) you have and next enter a value between 0 and 1 (as shown above) for each level, and if you want a different color. Instead of using 0.1-0.9 you e.g. can also use Fibonacci numbers like 0.235, 0.382, 0.618, 0.786 and disable (using the check mark) the rest of the levels. Experiment with this as you see fit.
Make sure that the chart you are looking at in TradingView is the same as you select in the indicator configuration e.g. COINBASE:BTCUSD should be selected as the chart as well as the Ticker in the configuration.
The Start date of the script is configurable (one date across all assets and levels)
The colors of the Levels is configurable (I am colorblind so go wild)
The standard values in the script are just examples, you need to determine the values that apply in your case and do your own research.
Your feedback is most welcome

Multi-Step Vegas SuperTrend - strategy [presentTrading]Long time no see! I am back : ) Please allow me to gain some warm-up.
█ Introduction and How it is Different
The "Vegas SuperTrend Strategy" is an enhanced trading strategy that leverages both the Vegas Channel and SuperTrend indicators to generate buy and sell signals.
What sets this strategy apart from others is its dynamic adjustment to market volatility and its multi-step take profit mechanism. Unlike traditional single-step profit-taking approaches, this strategy allows traders to systematically scale out of positions at predefined profit levels, thereby optimizing their risk-reward ratio and maximizing potential gains.
BTCUSD 6hr performance
█ Strategy, How it Works: Detailed Explanation
The Vegas SuperTrend Strategy combines the strengths of the Vegas Channel and SuperTrend indicators to identify market trends and generate trade signals. The following subsections delve into the details of how each component works and how they are integrated.
🔶 Vegas Channel Calculation
The Vegas Channel is based on a simple moving average (SMA) and the standard deviation (STD) of the closing prices over a specified period. The channel is defined by upper and lower bounds that are dynamically adjusted based on market volatility.
Simple Moving Average (SMA):
SMA_vegas = (1/N) * Σ(Close_i) for i = 0 to N-1
where N is the length of the Vegas Window.
Standard Deviation (STD):
STD_vegas = sqrt((1/N) * Σ(Close_i - SMA_vegas)^2) for i = 0 to N-1
Vegas Channel Upper and Lower Bounds:
VegasChannelUpper = SMA_vegas + STD_vegas
VegasChannelLower = SMA_vegas - STD_vegas
The details are here:
🔶 Trend Detection and Trade Signals
The strategy determines the current market trend based on the closing price relative to the SuperTrend bounds:
Market Trend:
MarketTrend = 1 if Close > SuperTrendPrevLower
-1 if Close < SuperTrendPrevUpper
Previous Trend otherwise
Trade signals are generated when there is a shift in the market trend:
Bullish Signal: When the market trend shifts from -1 to 1.
Bearish Signal: When the market trend shifts from 1 to -1.
🔶 Multi-Step Take Profit Mechanism
The strategy incorporates a multi-step take profit mechanism that allows for partial exits at predefined profit levels. This helps in locking in profits gradually and reducing exposure to market reversals.
Take Profit Levels:
The take profit levels are calculated as percentages of the entry price:
TakeProfitLevel_i = EntryPrice * (1 + TakeProfitPercent_i/100) for long positions
TakeProfitLevel_i = EntryPrice * (1 - TakeProfitPercent_i/100) for short positions
Multi-steps take profit local picture:
█ Trade Direction
The trade direction can be customized based on the user's preference:
Long: The strategy only takes long positions.
Short: The strategy only takes short positions.
Both: The strategy can take both long and short positions based on the market trend.
█ Usage
To use the Vegas SuperTrend Strategy, follow these steps:
Configure Input Settings:
- Set the ATR period, Vegas Window length, SuperTrend Multiplier, and Volatility Adjustment Factor.
- Choose the desired trade direction (Long, Short, Both).
- Enable or disable the take profit mechanism and set the take profit percentages and amounts for each step.
█ Default Settings
The default settings of the strategy are designed to provide a balanced approach to trading. Below is an explanation of each setting and its effect on the strategy's performance:
ATR Period (10): This setting determines the length of the ATR used in the SuperTrend calculation. A longer period smoothens the ATR, making the SuperTrend less sensitive to short-term volatility. A shorter period makes the SuperTrend more responsive to recent price movements.
Vegas Window Length (100): This setting defines the period for the Vegas Channel's moving average. A longer window provides a broader view of the market trend, while a shorter window makes the channel more responsive to recent price changes.
SuperTrend Multiplier (5): This base multiplier adjusts the sensitivity of the SuperTrend to the ATR. A higher multiplier makes the SuperTrend less sensitive, reducing the frequency of trade signals. A lower multiplier increases sensitivity, generating more signals.
Volatility Adjustment Factor (5): This factor dynamically adjusts the SuperTrend multiplier based on the width of the Vegas Channel. A higher factor increases the sensitivity of the SuperTrend to changes in market volatility, while a lower factor reduces it.
Take Profit Percentages (3.0%, 6.0%, 12.0%, 21.0%): These settings define the profit levels at which portions of the trade are exited. They help in locking in profits progressively as the trade moves in favor.
Take Profit Amounts (25%, 20%, 10%, 15%): These settings determine the percentage of the position to exit at each take profit level. They are distributed to ensure that significant portions of the trade are closed as the price reaches the set levels, reducing exposure to reversals.
Adjusting these settings can significantly impact the strategy's performance. For instance, increasing the ATR period or the SuperTrend multiplier can reduce the number of trades, potentially improving the win rate but also missing out on some profitable opportunities. Conversely, lowering these values can increase trade frequency, capturing more short-term movements but also increasing the risk of false signals.

Trend Trader-Remastered StrategyOfficial Strategy for Trend Trader - Remastered
Indicator: Trend Trader-Remastered (TTR)
Overview:
The Trend Trader-Remastered is a refined and highly sophisticated implementation of the Parabolic SAR designed to create strategic buy and sell entry signals, alongside precision take profit and re-entry signals based on marked Bill Williams (BW) fractals. Built with a deep emphasis on clarity and accuracy, this indicator ensures that only relevant and meaningful signals are generated, eliminating any unnecessary entries or exits.
Please check the indicator details and updates via the link above.
Important Disclosure:
My primary objective is to provide realistic strategies and a code base for the TradingView Community. Therefore, the default settings of the strategy version of the indicator have been set to reflect realistic world trading scenarios and best practices.
Key Features:
Strategy execution date&time range.
Take Profit Reduction Rate: The percentage of progressive reduction on active position size for take profit signals.
Example:
TP Reduce: 10%
Entry Position Size: 100
TP1: 100 - 10 = 90
TP2: 90 - 9 = 81
Re-Entry When Rate: The percentage of position size on initial entry of the signal to determine re-entry.
Example:
RE When: 50%
Entry Position Size: 100
Re-Entry Condition: Active Position Size < 50
Re-Entry Fill Rate: The percentage of position size on initial entry of the signal to be completed.
Example:
RE Fill: 75%
Entry Position Size: 100
Active Position Size: 50
Re-Entry Order Size: 25
Final Active Position Size:75
Important: Even RE When condition is met, the active position size required to drop below RE Fill rate to trigger re-entry order.
Key Points:
'Process Orders on Close' is enabled as Take Profit and Re-Entry signals must be executed on candle close.
'Calculate on Every Tick' is enabled as entry signals are required to be executed within candle time.
'Initial Capital' has been set to 10,000 USD.
'Default Quantity Type' has been set to 'Percent of Equity'.
'Default Quantity' has been set to 10% as the best practice of investing 10% of the assets.
'Currency' has been set to USD.
'Commission Type' has been set to 'Commission Percent'
'Commission Value' has been set to 0.05% to reflect the most realistic results with a common taker fee value.

VAWSI and Trend Persistance Reversal Strategy SL/TPThis is a completely revamped version of my "RSI and ATR Trend Reversal Strategy."
What's New?
The RSI has been replaced with an original indicator of mine, the "VAWSI," as I've elected to call it.
The standard RSI measures a change in an RMA to determine the strength of a movement.
The VAWSI performs very similarly, except it uses another original indicator of mine, the VAWMA.
VAWMA stands for "Volume (and) ATR Weight Moving Average." It takes an average of the volume and ATR and uses the ratio of each bar to weigh a moving average of the source.
It has the same formula as an RSI, but uses the VAWMA instead of an RMA.
Next we have the Trend Persistence indicator, which is an index on how long a trend has been persisting for. It is another original indicator. It takes the max deviation the source has from lowest/highest of a specified length. It then takes a cumulative measure of that amount, measures the change, then creates a strength index with that amount.
The VAWSI is a measure of an emerging trend, and the Trend Persistence indicator is a measure of how long a trend has persisted.
Finally, the 3rd main indicator, is a slight variation of an ATR. Rather than taking the max of source - low or high- source and source - source , it instead takes the max of high-low and the absolute value of source - the previous source. It then takes the absolute value of the change of this, and normalizes it with the source.
Inputs
Minimum SL/TP ensures that the Stop Loss and Take Profit still exist in untrendy markets. This is the minimum Amount that will always be applied.
VAWSI Weight is a divided by 100 multiplier for the VAWSI. So value of 200 means it is multiplied by 2. Think of it like a percentage.
Trend Persistence weight and ATR Weight are applied the same. Higher the number, the more impactful on the final calculation it is.
Combination Mult is an outright multiplier to the final calculation. So a 2.0 = * 2.0
Trend Persistence Smoothing Length is the length of the weighted moving average applied to the Trend Persistence Strength index.
Length Cycle Decimal is a replacement of length for the script.
Here we used BlackCat1402's Dynamic Length Calculation, which can be found on his page. With his permission we have implemented it into this script. Big shout out to them for not only creating, but allowing us to use it here.
The Length Cycle Decimal is used to calculate the dynamic length. Because TradingView only allows series int for their built-in library, a lot of the baseline indicators we use have to be manually recreated as functions in the following section.
The Strategy
As usual, we use Heiken Ashi values for calculations.
We begin by establishing the minimum SL/TP for use later.
Next we determine the amount of bars back since the last crossup or crossdown of our threshold line.
We then perform some normalization of our multipliers. We want a larger trend or larger VAWSI amount to narrow the threshold, so we have 1 divide them. This way, a higher reading outputs a smaller number and vice versa. We do this for both Trend Persistence, and the VAWSI.
The VAWSI we also normalize, where rather than it being a 0-100 reading of trend direction and strength, we absolute it so that as long as a trend is strong, regardless of direction, it will have a higher reading. With these normalized values, we add them together and simply subtract the ATR measurement rather than having 1 divide it.
Here you can see how the different measurements add up. A lower final number suggests imminent reversal, and a higher final number suggests an untrendy or choppy market.
ATR is in orange, the Trend Persistence is blue, the VAWSI is purple, and the final amount is green.
We take this final number and depending on the current trend direction, we multiply it by either the Highest or Lowest source since the last crossup or crossdown. We then take the highest or lowest of this calculation, and have it be our Stop Loss or Take Profit. This number cannot be higher/lower than the previous source to ensure a rapid spike doesn't immediately close your position on a still continuing trend. As well, the threshold cannot be higher/ lower than the the specified Stop Loss and Take Profit
Only after the source has fully crossed these lines do we consider it a crossup or crossdown. We confirm this with a barstate.isconfirmed to prevent repainting. Next, each time there is a crossup or crossdown we enter a long or a short respectively and plot accordingly.
I have the strategy configured to "process on order close" to ensure an accurate backtesting result. You could also set this to false and add a 1 bar delay to the "if crossup" and "if crossdown" lines under strategy so that it is calculated based on the open of the next bar.
Final Notes
The amounts have been preconfigured for performance on RIOT 5 Minute timeframe. Other timeframes are viable as well. With a few changes to the parameters, this strategy has backtested well on NVDA, AAPL, TSLA, and AMD. I recommend before altering settings to try other timeframes first.
This script does not seem to perform nearly as well in typically untrendy and choppy markets such as crypto and forex. With some setting changes, I have seen okay results with crypto, but overfitting could be the cause there.
Thank you very much, and please enjoy.

Machine Learning: SuperTrend Strategy TP/SL [YinYangAlgorithms]The SuperTrend is a very useful Indicator to display when trends have shifted based on the Average True Range (ATR). Its underlying ideology is to calculate the ATR using a fixed length and then multiply it by a factor to calculate the SuperTrend +/-. When the close crosses the SuperTrend it changes direction.
This Strategy features the Traditional SuperTrend Calculations with Machine Learning (ML) and Take Profit / Stop Loss applied to it. Using ML on the SuperTrend allows for the ability to sort data from previous SuperTrend calculations. We can filter the data so only previous SuperTrends that follow the same direction and are within the distance bounds of our k-Nearest Neighbour (KNN) will be added and then averaged. This average can either be achieved using a Mean or with an Exponential calculation which puts added weight on the initial source. Take Profits and Stop Losses are then added to the ML SuperTrend so it may capitalize on Momentum changes meanwhile remaining in the Trend during consolidation.
By applying Machine Learning logic and adding a Take Profit and Stop Loss to the Traditional SuperTrend, we may enhance its underlying calculations with potential to withhold the trend better. The main purpose of this Strategy is to minimize losses and false trend changes while maximizing gains. This may be achieved by quick reversals of trends where strategic small losses are taken before a large trend occurs with hopes of potentially occurring large gain. Due to this logic, the Win/Loss ratio of this Strategy may be quite poor as it may take many small marginal losses where there is consolidation. However, it may also take large gains and capitalize on strong momentum movements.
Tutorial:
In this example above, we can get an idea of what the default settings may achieve when there is momentum. It focuses on attempting to hit the Trailing Take Profit which moves in accord with the SuperTrend just with a multiplier added. When momentum occurs it helps push the SuperTrend within it, which on its own may act as a smaller Trailing Take Profit of its own accord.
We’ve highlighted some key points from the last example to better emphasize how it works. As you can see, the White Circle is where profit was taken from the ML SuperTrend simply from it attempting to switch to a Bullish (Buy) Trend. However, that was rejected almost immediately and we went back to our Bearish (Sell) Trend that ended up resulting in our Take Profit being hit (Yellow Circle). This Strategy aims to not only capitalize on the small profits from SuperTrend to SuperTrend but to also capitalize when the Momentum is so strong that the price moves X% away from the SuperTrend and is able to hit the Take Profit location. This Take Profit addition to this Strategy is crucial as momentum may change state shortly after such drastic price movements; and if we were to simply wait for it to come back to the SuperTrend, we may lose out on lots of potential profit.
If you refer to the Yellow Circle in this example, you’ll notice what was talked about in the Summary/Overview above. During periods of consolidation when there is little momentum and price movement and we don’t have any Stop Loss activated, you may see ‘Signal Flashing’. Signal Flashing is when there are Buy and Sell signals that keep switching back and forth. During this time you may be taking small losses. This is a normal part of this Strategy. When a signal has finally been confirmed by Momentum, is when this Strategy shines and may produce the profit you desire.
You may be wondering, what causes these jagged like patterns in the SuperTrend? It's due to the ML logic, and it may be a little confusing, but essentially what is happening is the Fast Moving SuperTrend and the Slow Moving SuperTrend are creating KNN Min and Max distances that are extreme due to (usually) parabolic movement. This causes fewer values to be added to and averaged within the ML and causes less smooth and more exponential drastic movements. This is completely normal, and one of the perks of using k-Nearest Neighbor for ML calculations. If you don’t know, the Min and Max Distance allowed is derived from the most recent(0 index of data array) to KNN Length. So only SuperTrend values that exhibit distances within these Min/Max will be allowed into the average.
Since the KNN ML logic can cause these exponential movements in the SuperTrend, they likewise affect its Take Profit. The Take Profit may benefit from this movement like displayed in the example above which helped it claim profit before then exhibiting upwards movement.
By default our Stop Loss Multiplier is kept quite low at 0.0000025. Keeping it low may help to reduce some Signal Flashing while not taking extra losses more so than not using it at all. However, if we increase it even more to say 0.005 like is shown in the example above. It can really help the trend keep momentum. Please note, although previous results don’t imply future results, at 0.0000025 Stop Loss we are currently exhibiting 69.27% profit while at 0.005 Stop Loss we are exhibiting 33.54% profit. This just goes to show that although there may be less Signal Flashing, it may not result in more profit.
We will conclude our Tutorial here. Hopefully this has given you some insight as to how Machine Learning, combined with Trailing Take Profit and Stop Loss may have positive effects on the SuperTrend when turned into a Strategy.
Settings:
SuperTrend:
ATR Length: ATR Length used to create the Original Supertrend.
Factor: Multiplier used to create the Original Supertrend.
Stop Loss Multiplier: 0 = Don't use Stop Loss. Stop loss can be useful for helping to prevent false signals but also may result in more loss when hit and less profit when switching trends.
Take Profit Multiplier: Take Profits can be useful within the Supertrend Strategy to stop the price reverting all the way to the Stop Loss once it's been profitable.
Machine Learning:
Only Factor Same Trend Direction: Very useful for ensuring that data used in KNN is not manipulated by different SuperTrend Directional data. Please note, it doesn't affect KNN Exponential.
Rationalized Source Type: Should we Rationalize only a specific source, All or None?
Machine Learning Type: Are we using a Simple ML Average, KNN Mean Average, KNN Exponential Average or None?
Machine Learning Smoothing Type: How should we smooth our Fast and Slow ML Datas to be used in our KNN Distance calculation? SMA, EMA or VWMA?
KNN Distance Type: We need to check if distance is within the KNN Min/Max distance, which distance checks are we using.
Machine Learning Length: How far back is our Machine Learning going to keep data for.
k-Nearest Neighbour (KNN) Length: How many k-Nearest Neighbours will we account for?
Fast ML Data Length: What is our Fast ML Length?? This is used with our Slow Length to create our KNN Distance.
Slow ML Data Length: What is our Slow ML Length?? This is used with our Fast Length to create our KNN Distance.
If you have any questions, comments, ideas or concerns please don't hesitate to contact us.
HAPPY TRADING!

Fibonacci ATR Fusion - Strategy [presentTrading]Open-script again! This time is also an ATR-related strategy. Enjoy! :)
If you have any questions, let me know, and I'll help make this as effective as possible.
█ Introduction and How It Is Different
The Fibonacci ATR Fusion Strategy is an advanced trading approach that uniquely integrates Fibonacci-based weighted averages with the Average True Range (ATR) to identify and capitalize on significant market trends.
Unlike traditional strategies that rely on single indicators or static parameters, this method combines multiple timeframes and dynamic volatility measurements to enhance precision and adaptability. Additionally, it features a 4-step Take Profit (TP) mechanism, allowing for systematic profit-taking at various levels, which optimizes both risk management and return potential in long and short market positions.
BTCUSD 6hr Performance
█ Strategy, How It Works: Detailed Explanation
The Fibonacci ATR Fusion Strategy utilizes a combination of technical indicators and weighted averages to determine optimal entry and exit points. Below is a breakdown of its key components and operational logic.
🔶 1. Enhanced True Range Calculation
The strategy begins by calculating the True Range (TR) to measure market volatility accurately.
TR = max(High - Low, abs(High - Previous Close), abs(Low - Previous Close))
High and Low: Highest and lowest prices of the current trading period.
Previous Close: Closing price of the preceding trading period.
max: Selects the largest value among the three calculations to account for gaps and limit movements.
🔶 2. Buying Pressure (BP) Calculation
Buying Pressure (BP) quantifies the extent to which buyers are driving the price upwards within a period.
BP = Close - True Low
Close: Current period's closing price.
True Low: The lower boundary determined in the True Range calculation.
🔶 3. Ratio Calculation for Different Periods
To assess the strength of buying pressure relative to volatility, the strategy calculates a ratio over various Fibonacci-based timeframes.
Ratio = 100 * (Sum of BP over n periods) / (Sum of TR over n periods)
n: Length of the period (e.g., 8, 13, 21, 34, 55).
Sum of BP: Cumulative Buying Pressure over n periods.
Sum of TR: Cumulative True Range over n periods.
This ratio normalizes buying pressure, making it comparable across different timeframes.
🔶 4. Weighted Average Calculation
The strategy employs a weighted average of ratios from multiple Fibonacci-based periods to smooth out signals and enhance trend detection.
Weighted Avg = (w1 * Ratio_p1 + w2 * Ratio_p2 + w3 * Ratio_p3 + w4 * Ratio_p4 + Ratio_p5) / (w1 + w2 + w3 + w4 + 1)
w1, w2, w3, w4: Weights assigned to each ratio period.
Ratio_p1 to Ratio_p5: Ratios calculated for periods p1 to p5 (e.g., 8, 13, 21, 34, 55).
This weighted approach emphasizes shorter periods more heavily, capturing recent market dynamics while still considering longer-term trends.
🔶 5. Simple Moving Average (SMA) of Weighted Average
To further smooth the weighted average and reduce noise, a Simple Moving Average (SMA) is applied.
Weighted Avg SMA = SMA(Weighted Avg, m)
- m: SMA period (e.g., 3).
This smoothed line serves as the primary signal generator for trade entries and exits.
🔶 6. Trading Condition Thresholds
The strategy defines specific threshold values to determine optimal entry and exit points based on crossovers and crossunders of the SMA.
Long Condition = Crossover(Weighted Avg SMA, Long Entry Threshold)
Short Condition = Crossunder(Weighted Avg SMA, Short Entry Threshold)
Long Exit = Crossunder(Weighted Avg SMA, Long Exit Threshold)
Short Exit = Crossover(Weighted Avg SMA, Short Exit Threshold)
Long Entry Threshold (T_LE): Level at which a long position is triggered.
Short Entry Threshold (T_SE): Level at which a short position is triggered.
Long Exit Threshold (T_LX): Level at which a long position is exited.
Short Exit Threshold (T_SX): Level at which a short position is exited.
These conditions ensure that trades are only executed when clear trends are identified, enhancing the strategy's reliability.
Previous local performance
🔶 7. ATR-Based Take Profit Mechanism
When enabled, the strategy employs a 4-step Take Profit system to systematically secure profits as the trade moves in the desired direction.
TP Price_1 Long = Entry Price + (TP1ATR * ATR Value)
TP Price_2 Long = Entry Price + (TP2ATR * ATR Value)
TP Price_3 Long = Entry Price + (TP3ATR * ATR Value)
TP Price_1 Short = Entry Price - (TP1ATR * ATR Value)
TP Price_2 Short = Entry Price - (TP2ATR * ATR Value)
TP Price_3 Short = Entry Price - (TP3ATR * ATR Value)
- ATR Value: Calculated using ATR over a specified period (e.g., 14).
- TPxATR: User-defined multipliers for each take profit level.
- TPx_percent: Percentage of the position to exit at each TP level.
This multi-tiered exit strategy allows for partial position closures, optimizing profit capture while maintaining exposure to potential further gains.
█ Trade Direction
The Fibonacci ATR Fusion Strategy is designed to operate in both long and short market conditions, providing flexibility to traders in varying market environments.
Long Trades: Initiated when the SMA of the weighted average crosses above the Long Entry Threshold (T_LE), indicating strong upward momentum.
Short Trades: Initiated when the SMA of the weighted average crosses below the Short Entry Threshold (T_SE), signaling robust downward momentum.
Additionally, the strategy can be configured to trade exclusively in one direction—Long, Short, or Both—based on the trader’s preference and market analysis.
█ Usage
Implementing the Fibonacci ATR Fusion Strategy involves several steps to ensure it aligns with your trading objectives and market conditions.
1. Configure Strategy Parameters:
- Trading Direction: Choose between Long, Short, or Both based on your market outlook.
- Trading Condition Thresholds: Set the Long Entry, Short Entry, Long Exit, and Short Exit thresholds to define when to enter and exit trades.
2. Set Take Profit Levels (if enabled):
- ATR Multipliers: Define how many ATRs away from the entry price each take profit level is set.
- Take Profit Percentages: Allocate what percentage of the position to close at each TP level.
3. Apply to Desired Chart:
- Add the strategy to the chart of the asset you wish to trade.
- Observe the plotted Fibonacci ATR and SMA Fibonacci ATR indicators for visual confirmation.
4. Monitor and Adjust:
- Regularly review the strategy’s performance through backtesting.
- Adjust the input parameters based on historical performance and changing market dynamics.
5. Risk Management:
- Ensure that the sum of take profit percentages does not exceed 100% to avoid over-closing positions.
- Utilize the ATR-based TP levels to adapt to varying market volatilities, maintaining a balanced risk-reward ratio.
█ Default Settings
Understanding the default settings is crucial for optimizing the Fibonacci ATR Fusion Strategy's performance. Here's a precise and simple overview of the key parameters and their effects:
🔶 Key Parameters and Their Effects
1. Trading Direction (`tradingDirection`)
- Default: Both
- Effect: Determines whether the strategy takes both long and short positions or restricts to one direction. Selecting Both allows maximum flexibility, while Long or Short can be used for directional bias.
2. Trading Condition Thresholds
Long Entry (long_entry_threshold = 58.0): Higher values reduce false positives but may miss trades.
Short Entry (short_entry_threshold = 42.0): Lower values capture early short trends but may increase false signals.
Long Exit (long_exit_threshold = 42.0): Exits long positions early, securing profits but potentially cutting trends short.
Short Exit (short_exit_threshold = 58.0): Delays short exits to capture favorable movements, avoiding premature exits.
3. Take Profit Configuration (`useTakeProfit` = false)
- Effect: When enabled, the strategy employs a 4-step TP mechanism to secure profits at multiple levels. By default, it is disabled to allow users to opt-in based on their trading style.
4. ATR-Based Take Profit Multipliers
TP1 (tp1ATR = 3.0): Sets the first TP at 3 ATRs for initial profit capture.
TP2 (tp2ATR = 8.0): Targets larger trends, though less likely to be reached.
TP3 (tp3ATR = 14.0): Optimizes for extreme price moves, seldom triggered.
5. Take Profit Percentages
TP Level 1 (tp1_percent = 12%): Secures 12% at the first TP.
TP Level 2 (tp2_percent = 12%): Exits another 12% at the second TP.
TP Level 3 (tp3_percent = 12%): Closes an additional 12% at the third TP.
6. Weighted Average Parameters
Ratio Periods: Fibonacci-based intervals (8, 13, 21, 34, 55) balance responsiveness.
Weights: Emphasizes recent data for timely responses to market trends.
SMA Period (weighted_avg_sma_period = 3): Smoothens data with minimal lag, balancing noise reduction and responsiveness.
7. ATR Period (`atrPeriod` = 14)
Effect: Sets the ATR calculation length, impacting TP sensitivity to volatility.
🔶 Impact on Performance
- Sensitivity and Responsiveness:
- Shorter Ratio Periods and Higher Weights: Make the weighted average more responsive to recent price changes, allowing quicker trade entries and exits but increasing the likelihood of false signals.
- Longer Ratio Periods and Lower Weights: Provide smoother signals with fewer false positives but may delay trade entries, potentially missing out on significant price moves.
- Profit Taking:
- ATR Multipliers: Higher multipliers set take profit levels further away, targeting larger price movements but reducing the probability of reaching these levels.
- Fixed Percentages: Allocating equal percentages at each TP level ensures consistent profit realization and risk management, preventing overexposure.
- Trade Direction Control:
- Selecting Specific Directions: Restricting trades to Long or Short can align the strategy with market trends or personal biases, potentially enhancing performance in trending markets.
- Risk Management:
- Take Profit Percentages: Dividing the position into smaller percentages at multiple TP levels helps lock in profits progressively, reducing risk and allowing the remaining position to ride further trends.
- Market Adaptability:
- Weighted Averages and ATR: By combining multiple timeframes and adjusting to volatility, the strategy adapts to different market conditions, maintaining effectiveness across various asset classes and timeframes.
---
If you want to know more about ATR, can also check "SuperATR 7-Step Profit".
Enjoy trading.

Price Action Trend and Margin EquityThe Price Action Trend and Margin Equity indicator is a multifunctional market analysis tool that combines elements of money management and price pattern analysis. The indicator helps traders identify key price action patterns and determine optimal entry, exit and stop loss levels based on the current trend.
The main components of the indicator:
Money Management:
Allows the trader to set risk management parameters such as the percentage of possible loss on the position, the use of fixed leverage and the total capital.
Calculates the required leverage level to achieve a specified percentage of loss.
Price Action:
Correctly identifies various price patterns such as Pin Bar, Engulfing Bar, PPR Bar and Inside Bar.
Displays these patterns on the chart with the ability to customize candle colors and display styles.
Allows the trader to customize take profit and stop loss points to display them on the chart.
The ability to display patterns only in the direction of the trend.
Trend: (some code taken from ChartPrime)
Uses a trend cloud to visualize the current market direction.
The trend cloud is displayed on the chart and helps traders determine whether the market is in an uptrend or a downtrend.
Alert:
Allows you to set an alert that will be triggered when the pattern is formed.
Example of use:
Let's say a trader uses the indicator to trade the crypto market. He sets the money management parameters, setting the maximum loss per position to 5% and using a fixed leverage of 1:100. The indicator automatically calculates the required position size to meet these parameters ($: on the label). Or displays the leverage (X: on the label) to achieve the required risk.
The trader receives an alert when a Pin Bar is formed. The indicator displays the entry, exit, and stop loss levels based on this pattern. The trader opens a position for the recommended amount in the direction indicated by the indicator and sets the stop loss and take profit at the recommended levels.
General Settings:
Position Loss Percentage: Sets the maximum loss percentage you are willing to take on a single position.
Use Fixed Leverage: Enables or disables the use of fixed leverage.
Fixed Leverage: Sets the fixed leverage level.
Total Equity: Specifies the total equity you are using for trading. (Required for calculation when using fixed leverage)
Turn Patterns On/Off: You can turn on or off the display of various price patterns such as Pin Bar, Outside Bar (Engulfing), Inside Bar, and PPR Bar.
Pattern Colors: Sets the colors for displaying each pattern on the chart.
Candle Color: Allows you to set a neutral color for candles that do not match the price action.
Show Lines: Allows you to turn on or off the display of labels and lines.
Line Length: Sets the length of the stop, entry, and take profit lines.
Label color: One color for all labels (configured below) or the color of the labels in the color of the candle pattern.
Pin entry: Select the entry point for the pin bar: candle head, bar close, or 50% of the candle.
Coefficients for stop and take lines.
Use trend for price action: When enabled, will show price action signals only in the direction of the trend.
Display trend cloud: Enables or disables the display of the trend cloud.
Cloud calculation period: Sets the period for which the maximum and minimum values for the cloud are calculated. The longer the period, the smoother the cloud will be.
Cloud colors: Sets the colors for uptrends and downtrends, as well as the transparency of the cloud.
The logic of the indicator:
Pin Bar is a candle with a long upper or lower shadow and a short body.
Logic: If the length of one shadow is twice the body and the opposite shadow of the candle, it is considered a Pin Bar.
An Inside Bar is a candle that is completely engulfed by the previous candle.
Logic: If the high and low of the current candle are inside the previous candle, it is an Inside Bar.
An Outside Bar or Engulfing is a candle that completely engulfs the previous candle.
Logic: If the high and low of the current candle are outside the previous candle and close outside the previous candle, it is an Outside Bar.
A PPR Bar is a candle that closes above or below the previous candle.
Logic: If the current candle closes above the high of the previous candle or below its low, it is a PPR Bar.
Stop Loss Levels: Calculated based on the specified ratios. If set to 1.0, it shows the correct stop for the pattern by pushing away from the entry point.
Take Profit Levels: Calculated based on the specified ratios.
Create a Label: The label is created at the stop loss level and contains information about the potential leverage and loss.
The formula for calculating the $ value is:
=(Total Capital x (Maximum Loss Percentage on Position/100)) / (Difference between Entry Level and Stop Loss Level × Ratio that sets the stop loss level relative to the length of the candlestick shadow × Fixed Leverage Value) .
Labels contain the following information:
The percentage of price change from the recommended entry point to the stop loss level.
Required Leverage (X: ): The amount of leverage required to achieve the specified loss percentage. (Or a fixed value if selected).
Required Capital ($: ): The amount of capital required to open a position with the specified leverage and loss percentage (only displayed when using fixed leverage).
The trend cloud identifies the maximum and minimum price values for the specified period.
The cloud value is set depending on whether the current price is equal to the high or low values.
If the current closing price is equal to the high value, the cloud is set at the low value, and vice versa.
RU
Индикатор "Price Action Trend and Margin Equity" представляет собой многофункциональный инструмент для анализа рынка, объединяющий в себе элементы управления капиталом и анализа ценовых паттернов. Индикатор помогает трейдерам идентифицировать ключевые прайс экшн паттерны и определять оптимальные уровни входа, выхода и стоп-лосс на основе текущего тренда.
Основные компоненты индикатора:
Управление капиталом:
Позволяет трейдеру задавать параметры управления рисками, такие как процент возможного убытка по позиции, использование фиксированного плеча и общий капитал.
Рассчитывает необходимый уровень плеча для достижения заданного процента убытка.
Price Action:
Правильно идентифицирует различные ценовые паттерны, такие как Pin Bar, Поглащение Бар, PPR Bar и Внутренний Бар.
Отображает эти паттерны на графике с возможностью настройки цветов свечей и стилей отображения.
Позволяет трейдеру настраивать точки тейк профита и стоп лосса для отображения их на графике.
Возможность отображения паттернов только в натправлении тренда.
Trend: (часть кода взята у ChartPrime)
Использует облако тренда для визуализации текущего направления рынка.
Облако тренда отображается на графике и помогает трейдерам определить, находится ли рынок в восходящем или нисходящем тренде.
Оповещение:
Дает возможность установить оповещение которое будет срабатывать при формировании паттерна.
Пример применения:
Предположим, трейдер использует индикатор для торговли на крипто рынке. Он настраивает параметры управления капиталом, устанавливая максимальный убыток по позиции в 5% и используя фиксированное плечо 1:100. Индикатор автоматически рассчитывает необходимый объем позиции для соблюдения этих параметров ($: на лейбле). Или отображает плечо (Х: на лейбле) для достижения необходимого риска.
Трейдер получает оповещение о формировании Pin Bar. Индикатор отображает уровни входа, выхода и стоп-лосс, основанные на этом паттерне. Трейдер открывает позицию на рекомендуемую сумму в направлении, указанном индикатором, и устанавливает стоп-лосс и тейк-профит на рекомендованных уровнях.
Общие настройки:
Процент убытка по позиции: Устанавливает максимальный процент убытка, который вы готовы понести по одной позиции.
Использовать фиксированное плечо: Включает или отключает использование фиксированного плеча.
Уровень фиксированного плеча: Задает уровень фиксированного плеча.
Общий капитал: Указывает общий капитал, который вы используете для торговли. (Необходим для расчета при использовании фиксированного плеча)
Включение/отключение паттернов: Вы можете включить или отключить отображение различных ценовых паттернов, таких как Pin Bar, Outside Bar (Поглощение), Inside Bar и PPR Bar.
Цвета паттернов: Задает цвета для отображения каждого паттерна на графике.
Цвет свечей: Позволяет задать нейтральный цвет для свечей неподходящих под прйс экшн.
Показывать линии: Позволяет включить или отключить отображение лейблов и линий.
Длинна линий: Настройка длинны линий стопа, линии входа и тейк профита.
Цвет лейбла: Один цвет для всех лейблов (настраивается ниже) или цвет лейблов в цвет паттерна свечи.
Вход в пин: Выбор точки входа для пин бара: голова свечи, точка закрытия бара или 50% свечи.
Коэффиценты для стоп и тейк линий.
Использовать тренд для прайс экшна: При включении будет показывать прайс экшн сигналы только в направлении тренда.
Отображение облака тренда: Включает или отключает отображение облака тренда.
Период расчета облака: Устанавливает период, за который рассчитываются максимальные и минимальные значения для облака. Чем больше период, тем более сглаженным будет облако.
Цвета облака: Задает цвета для восходящего и нисходящего трендов, а также прозрачность облака.
Логика работы индикатора:
Pin Bar — это свеча с длинной верхней или нижней тенью и коротким телом.
Логика: Если длина одной тени вдвое больше тела и противоположной тени свечи, считается, что это Pin Bar.
Inside Bar — это свеча, полностью поглощенная предыдущей свечой.
Логика: Если максимум и минимум текущей свечи находятся внутри предыдущей свечи, это Inside Bar.
Outside Bar или Поглощение — это свеча, которая полностью поглощает предыдущую свечу.
Логика: Если максимум и минимум текущей свечи выходят за пределы предыдущей свечи и закрывается за пределами предыдущей свечи, это Outside Bar.
PPR Bar — это свеча, которая закрывается выше или ниже предыдущей свечи.
Логика: Если текущая свеча закрывается выше максимума предыдущей свечи или ниже ее минимума, это PPR Bar.
Уровни стоп-лосс: Рассчитываются на основе заданных коэффициентов. При значении 1.0 показывает правильный стоп для паттерна отталкиваясь от точки входа.
Уровки тейк-профита: Рассчитываются на основе заданных коэффициентов.
Создание метки: Метка создается на уровне стоп-лосс и содержит информацию о потенциальном плече и убытке.
Формула для вычисления значения $:
=(Общий капитал x (Максимальный процент убытка по позиции/100)) / (Разница между уровнем входа и уровнем стоп-лосс × Коэффициент, задающий уровень стоп-лосс относительно длины тени свечи × Значение фиксированного плеча).
Метки содержат следующую информацию:
Процент изменения цены от рекомендованной точки входа до уровня стоп-лосс.
Необходимое плечо (Х: ): Уровень плеча, необходимый для достижения заданного процента убытка. (Или фиксированное значение если оно выбрано).
Необходимый капитал ($: ): Сумма капитала, необходимая для открытия позиции с заданным плечом и процентом убытка (отображается только при использовании фиксированного плеча).
Облако тренда определяет максимальные и минимальные значения цены за указанный период.
Значение облака устанавливается в зависимости от того, совпадает ли текущая цена с максимальными или минимальными значениями.
Если текущая цена закрытия равна максимальному значению, облако устанавливается на уровне минимального значения, и наоборот.

ATR Bands with Optional Risk/Reward Colors█ OVERVIEW
This indicator projects ATR bands and, optionally, colors them based on a risk/reward advantage for those who trade breakouts/breakdowns using moving averages as partial or full exit points.
█ DEFINITIONS
► True Range
The True Range is a measure of the volatility of a financial asset and is defined as the maximum difference among one of the following values:
- The high of the current period minus the low of the current period.
- The absolute value of the high of the current period minus the closing price of the previous period.
- The absolute value of the low of the current period minus the closing price of the previous period.
► Average True Range
The Average True Range was developed by J. Welles Wilder Jr. and was introduced in his 1978 book titled "New Concepts in Technical Trading Systems". It is calculated as an average of the true range values over a certain number of periods (usually 14) and is commonly used to measure volatility and set stop-loss and profit targets (1).
For example, if you are looking at a daily chart and you want to calculate the 14-day ATR, you would take the True Range of the previous 14 days, calculate their average, and this would be the ATR for that day. The process is then repeated every day to obtain a series of ATR values over time.
The ATR can be smoothed using different methods, such as the Simple Moving Average (SMA), the Exponential Moving Average (EMA), or others, depending on the user's preferences or analysis needs.
► ATR Bands
The ATR bands are created by adding or subtracting the ATR from a reference point (usually the closing price). This process generates bands around the central point that expand and contract based on market volatility, allowing traders to assess dynamic support and resistance levels and to adapt their trading strategies to current market conditions.
█ INDICATOR
► ATR Bands
The indicator provides all the essential parameters for calculating the ATR: period length, time frame, smoothing method, and multiplier.
It is then possible to choose the reference point from which to create the bands. The most commonly used reference points are Open, High, Low, and Close, but you can also choose the commonly used candle averages: HL2, HLC3, HLCC4, OHLC4. Among these, there is also a less common "OC2", which represents the average of the candle body. Additionally, two parameters have been specifically created for this indicator: Open/Close and High/Low.
With the "Open/Close" parameter, the upper band is calculated from the higher value between Open and Close, while the lower one is calculated from the lower value between Open and Close. In the case of bullish candles, therefore, the Close value is taken as the starting point for the upper band and the Open value for the lower one; conversely, in bearish candles, the Open value is used for the upper band and the Close value for the lower band. This setting can be useful for precautionally generating broader bands when trading with candlesticks like hammers or inverted hammers.
The "High/Low" parameter calculates the upper band starting from the High and the lower band starting from the Low. Among all the available options, this one allows drawing the widest bands.
Other possible options to improve the drawing of ATR bands, aligning them with the price action, are:
• Doji Smoothing: When the current candle is a doji (having the same Open and Close price), the bands assume the values they had on the previous candle. This can be useful to avoid steep fluctuations of the bands themselves.
• Extend to High/Low: Extends the bands to the High or Low values when they exceed the value of the band.
• Round Last Cent: Expands the upper band by one cent if the price ends with x.x9, and the lower band if the price ends with x.x1. This function only works when the asset's tick is 0.01.
► Risk/Reward Advantage
The indicator optionally colors the ATR bands after setting a breakpoint, one or two risk/reward ratios, and a series of moving averages. This function allows you to know in advance whether entering a trade can provide an advantage over the risk. The band is colored when the ratio between the distance from the break point to the band and the distance from the break point to the first available moving average reaches at least the set ratio value. It is possible to set two colorings, one for a minimum risk/reward ratio and one for an optimal risk/reward ratio.
The break point can be chosen between High/Low (High in case of breakout, Low in case of breakdown) or Open/Close (on breakouts, Close with bullish candles or Open with bearish candles; on breakdowns, Close with bearish candles or Open with bullish candles).
It is possible to choose up to 10 moving averages of various types, including the VWAP with the Anchor Period (2).
Depending on the "Price to MA" setting, the bands can be individually or simultaneously colored.
By selecting "Single Direction," the risk/reward calculation is performed only when all moving averages are above or below the break point, resulting in only one band being colored at a time. For this reason, when the break point is in between the moving averages, the calculation is not executed. This setting can be useful for strategies involving price movement from a level towards a series of specific moving averages (for example, in reversals starting from a certain level towards the VWAP with possible partial take profits on some previous moving averages, or simply in trend following towards one or more moving averages).
Choosing "Both Directions" the risk/reward ratio is calculated based on the first available moving averages both above and below the price. This setting is useful for those who operate in range bound markets or simply take advantage of movements between moving averages.
█ NOTE
This script may not be suitable for scalping strategies that require immediate entries due to the inability to know the ATR of a candle in advance until its closure. Once the candle is closed, you should have time to place a stop or stop-limit order, so your strategy should not anticipate an immediate start with the next candle. Even more conveniently, if your strategy involves an entry on a pullback, you can place a limit order at the breakout level.
(1) www.tradingview.com
(2) For convenience, the code for the Anchor Period has been entirely copied from the VWAP code provided by TradingView.

R:R Trading System FrameworkFirst off, huge thanks to @fikira! He was able to adapt what I built to work much more efficiently, allowing for more strategies to be used simultaneously. Simply put, I could not have gotten to this point without you. Thanks for what you do for the TV community. Second, I am fairly new to pinescript writing, so I welcome criticism, thoughtful input and improvement suggestions. I would love to grow this concept into something even better, if possible. So please let me know if you have any ideas for improvement. However I do juggle a lot of different things outside of TV, so implementations may be delayed.
I have decided, at this time, not to add alerts. First, because I feel most people looking to adapt this framework can add their own pretty easily. Also, given how customized the framework is currently, while also attempting to account for all the possible ways in which people may want alerts to function after they customize it, it seems best to leave them out as it doesn't exactly fit the idea of a framework.
For best viewing, I recommend hovering over the script's name > ... > Visual order > Bring to front. Also I found hollow candles with mono-toned colors (like pictured) are more visually appealing for me personally. I HIGHLY RECOMMEND USING WITH BAR REPLAY TO BETTER UNDERSTAND THE FRAMEWORK'S FUNCTIONALITY.
▶️ WHAT THIS FRAMEWORK IS
- A huge collection of concepts and capabilities for those trying to better understand, learn, or teach pinescript.
- A system designed to showcase Risk:Reward concepts more holistically by providing all of the most popular components of retail trading to include backtesting, trade visual plotting, position tracking, market condition shifts, and useful info while positioned to help highlight changes in your risk:reward based decision-making processes.
- A system that can showcase individual strategies regardless of trade direction, allowing you to develop hedging strategies without having multiple indicators that do not correlate with each other.
- Designed around the idea that you trade less numbers of assets but manage your positions and risk based on multiple concurrently running strategies to manage your risk exposure and reward potential.
- An attempt to combine all the things you need to execute with an active trading management style.
- A framework that uses backtested results (in this case the number of averaged bars it takes to hit key levels) in real-time to inform your risk:reward decision-making while in-trade (in this case in your Trade Tracking Table using dynamic color to show how you might be early, on-time, or late compared to the average amount of backtested time it normally takes to hit that specific key level).
▶️ WHAT THIS FRAMEWORK IS NOT
- A complete trading product. DO NOT USE as-is. It is a FRAMEWORK for you to generate ideas of your own and fairly easily implement your own triggering conditions in the appropriate sections of the script.
▶️ USE CASES
- If you decide you like the Stop, Target, Trailing Stop, and Risk:Reward components as-is, then just understanding how to plug in your Entry and Bullish / Bearish conditions (Triangles) and adjust the input texts to match your custom naming will be all you need to make it your own!
- If you want to adapt certain components, then this system gives you a great starting point to adapt your different concepts and ideas from.
▶️ SYSTEM COMPONENTS
- Each of the system's components are described via tooltips both in the input menu and in the tables' cells.
- Each label on the chart displays the corresponding price at those triggered conditions on hover with tooltips.
- The Trailing Stop only becomes active once it is above the Entry Price for that trade, and brightens to show it is active. The STOP line (right of price) moves once it takes over for the Entry Stop representing the level of the Trailing Stop at that time for that trade.
- The Lines / Labels to the right of price will brighten once price is above for Longs or below for Shorts. The Trade Tracking Table cells will add ☑️ once price is above for Longs or below for Shorts.
- The brighter boxes on the chart show the trades that occurred based on your criteria and are color coded for all components of each trade type to ensure your references are consistent. (Defaults are TV built-in strategies)
- The lighter boxes on the chart show the highest and lowest price levels reached during those trades, to highlight areas where improvements can be made or additional considerations can be accounted for by either adjusting Entry triggers or Bullish / Bearish triggers.
- Default Green and Red Triangles (Bullish / Bearish) default to having the same triggering condition as the Entry it corresponds to. This is to highlight either a pyramiding concept, early exit, or you can change to account for other things occurring during your trades which could help you with Stop and Target management/considerations.
TradingView and many of its community members have done a lot for me, so this is my attempt to give back.

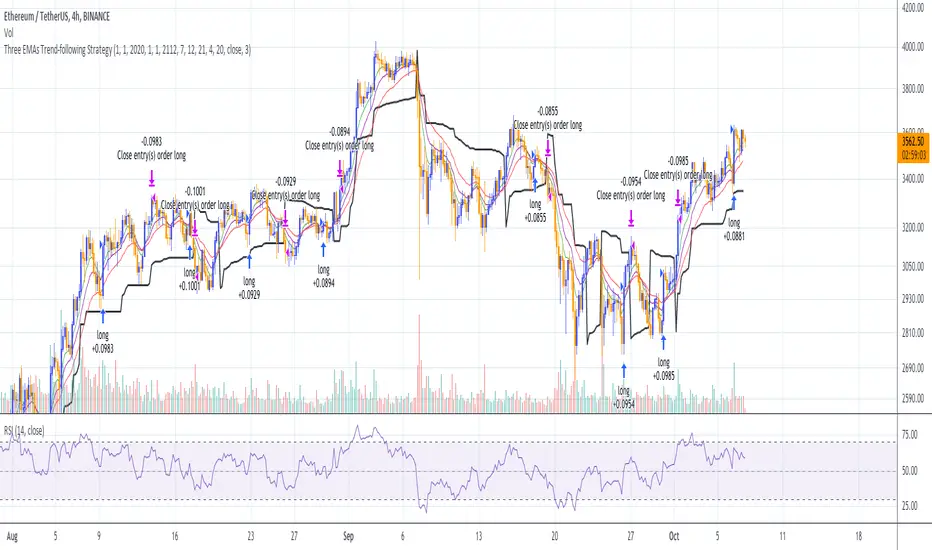
Three EMAs Trend-following Strategy (by Coinrule)Trend-following strategies are great because they give you the peace of mind that you're trading in line with the market.
However, by definition, you're always following . That means you're always a bit later than your want to be. The main challenges such strategies face are:
Confirming that there is a trend
Following the trend, hopefully, early enough to catch the majority of the move
Hopping off the trade when it seems to have run its course
This EMA Trend-following strategy attempts to address such challenges while allowing for a dynamic stop loss.
ENTRY
The trading system requires three crossovers on the same candle to confirm that a new trend is beginning:
Price crossing over EMA 7
Price crossing over EMA 14
Price crossing over EMA 21
The first benefit of using all three crossovers is to reduce false signals. The second benefit is that you know that a strong trend is likely to develop relatively soon, with the help of the fast setup of the three EMAs.
EXIT
The strategy comes with a fixed take profit and a volatility stop, which acts as a trailing stop to adapt to the trend's strength. That helps you get out of the way as soon as market conditions change. Depending on your long term confidence in the asset, you can edit the fixed take profit to be more conservative or aggressive.
The position is closed when:
The price increases by 4%
The price crosses below the volatility stop.
The best time frame for this strategy based on our backtest is the 4-hr. Shorter timeframes can also work well, although they exhibit larger volatility in their returns. In general, this approach suits medium timeframes. A trading fee of 0.1% is taken into account. The fee is aligned to the base fee applied on Binance, which is the largest cryptocurrency exchange.
You can execute this strategy on your favourite exchange at coinrule.com
MACD + DMI Scalping with Volatility Stop by (Coinrule)Trend-following strategies are cool because they allow you to catch potential high returns.
The main limit of such strategies are:
False signals > the asset is not experiencing a strong trend. The strategy gets stuck with a sideways move or, worst, with the beginning of a downtrend.
The sell signal may come later than the actual top, leading in some cases to turn a trade in profit into a loss.
This strategy tries to address these limitations to develop a trading system that optimises the entry and closes trade once the profit achieves a pre-set level.
ENTRY
The trading system uses the MACD and the DMI to confirm when is the best time for buying. Combining these two indicators prevents trading during downtrends and reduces the likelihood of getting stuck in a market with low volatility.
The system confirms the entry when:
The MACD histogram turns bullish.
When the positive DMI is greater than the negative DMI, there are more chances that the asset is trading in a sustained uptrend.
EXIT
The strategy comes with a fixed take profit combined with a volatility stop, which acts as a trailing stop to adapt to the trend's strength. Depending on your long term confidence in the asset, you can edit the fixed take profit to be more conservative or aggressive.
The position is closed when:
The price increases by 3%
The price crosses below the volatility stop.
The best time frame for this strategy based on our backtest is the 3-hr . The 4-hr can work well. In general, this approach suits medium to long term strategies
The strategy assumes each order to trade 30% of the available capital to make the results more realistic. A trading fee of 0.1% is taken into account. The fee is aligned to the base fee applied on Binance, which is the largest cryptocurrency exchange.

RSI and Smoothed RSI Bull Div Strategy [BigBitsIO]This strategy focuses on finding a low RSI value, then targeting a low Smoothed RSI value while the price is below the low RSI in the lookback period to trigger a buy signal.
Features Take Profit, Stop Loss, and Plot Target inputs. As well as many inputs to manage how the RSI and Smoothed RSI are configured within the strategy.
Explanation of all the inputs
Take Profit %: % change in price from position entry where strategy takes profit
Stop Loss %: % change in price from position entry where strategy stops losses
RSI Lookback Period: # of candles used to calculate RSI
Buy Below Lowest Low In RSI Divergence Lookback Target %: % change in price from lowest RSI candle in divergence lookback if set
Source of Buy Below Target Price: Source of price (close, open, high, low, etc..) used to calculated buy below %
Smoothed RSI Lookback Period: # of candles used to calculate RSI
RSI Currently Below: Value the current RSI must be below to trigger a buy
RSI Divergence Lookback Period: # of candles used to lookback for lowest RSI in the divergence lookback period
RSI Lowest In Divergence Lookback Currently Below: Require the lowest RSI in the divergence lookback to be below this value
RSI Sell Above: If take profit or stop loss is not hit, the position will sell when RSI rises above this value
Minimum SRSI Downtrend Length: Require that the downtrend length of the SRSI be this value or higher to trigger a buy
Smoothed RSI Currently Below: Value the current SRSI must be below to trigger a buy

Squeeze Momentum Strategy [LazyBear] Buy Sell TP SL Alerts-Modified version of Squeeze Momentum Indicator by @LazyBear.
-Converted to version 5,
-Taken inspiration from @KivancOzbilgic for its buy sell calculations,
-Used @Bunghole strategy template with Take Profit, Stop Loss and Enable/Disable Toggles
-Added Custom Date Backtesting Module
------------------------------------------------------------------------------------------------------------------------
All credit goes to above
Problem with original version:
The original Squeeze Momentum Strategy did not have buy sell signals and there was alot of confusion as to when to enter and exit.
There was no proper strategy that would allow backtesting on which further analysis could be carried out.
There are 3 aspects this strategy:
1 ) Strategy Logic (easily toggleable from the dropdown menu from strategy settings)
- LazyBear (I have made this simple by using Kivanc technique of Momentums Moving Average Crossover, BUY when MA cross above signal line, SELL when crossdown signal line)
- Zero Crossover Line (BUY signal when crossover zero line, and SELL crossdown zero line)
2) Long Short TP and SL
- In strategies there is usually only 1 SL and 1 TP, and it is assumed that if a 2% SL giving a good profit %, then it would be best for both long and short. However this is not the case for many. Many markets/pairs, go down with much more speed then they go up with. Hence once we have a profitable backtesting setting, then we should start optimizing Long and Short SL's seperately. Once that is done, we should start optimizing for Long and Short TP's separately, starting with Longs first in both cases.
3) Enable and Disable Toggles of Long and Short Trades
- Many markets dont allow short trades, or are not suitable for short trades. In this case it would be much more feasible to disable "Short" Trading and see results of Long Only as a built in graphic view of backtestor provides a more easy to understand data feed as compared to the performance summary in which you have to review long and short profitability separately.
4) Custom Data Backtesting
- One of most crucial aspects while optimizing for backtesting is to check a strategies performance on uptrends, downtrend and sideways markets seperately as to understand the weak points of strategy.
- Once you enable custom date backtesting, you will see lines on the chart which can be dragged left right based on where you want to start and end the backtesting from and to.
Note:
- Not a financial advise
- Open to feedback, questions, improvements, errors etc.
- More info on how the squeeze momentum works visit LazyBear indicator link:
Happy Trading!
Cheers
M Tahreem Alam @mtahreemalam

Buy the Dips (by Coinrule)Taking your first steps into automated trading may be challenging. Coinrule's mission is to make it as easy as possible, also for beginners.
Here follows the best trading strategy to get started with Coinrule. This strategy doesn't involve complex indicators, yet was proved to be effective in the long term for many coins. Results seem to be improved when trading a coin vs Bitcoin.
The strategy buys the dips of a coin to sell with a profit. A stop-loss protects every trade.
Crypto markets offer high volatility and, thus, excellent opportunities for trading. Excluding times of severe downtrend, buying the dip is a simple and effective long-term trading strategy. The buy-signal is set to a 2% drop in a 30-minutes time frame.
Each trade comes with a take profit and a stop loss. Both set at 2%.
You can adjust these percentages to the market volatility as an advanced setup. You can backtest the outcomes using the backtesting tool from Tradingview
The strategy assumes each order to trade 30% of the available capital. A trading fee of 0.1% is taken into account. The fee is aligned to the base fee applied on Binance, which is the largest cryptocurrency exchange.

Experimental Entry Interface (Buy Arrows with TP & SL)This script provides high probability entry points and includes Take Profit and Stop Loss targets.
It attempts to predict when the market conditions are set to move up, and prints long positions.
In addition to Long Entry Arrows, it will print Take Profit / Stop Loss targets.
This indicator is highly adjustable. Hence the name 'Experimental' in the title. Experiment with it to find the results you want.
Designed for use on the 1H timeframe in Forex, but could possibly be useful elsewhere. Do your own testing.
This indicator can repaint. It is best used with alerts set for once per bar close, so that your alerts do not repaint and your trades are solid.
Not ever signal is a winner. Backtest thoroughly. Adjust accordingly.
Arrows
Four sets of colored arrows are included.
💵 💶 Green and Blue Entry Arrows are formed when the market is in an uptrend, and has a momentary pullback.
💴 💷 Yellow and Purple Entry Arrows are formed when the market is just starting to recover from being severely oversold.
Backtest Mode
Turn on Backtest Mode to easily see if an entry ended up as a winner or loser. A Take Profit and Stop Loss line will be drawn to show results.
Take Profit & Stop Loss Targets
You have two options for this.
Price will show you where your TP/SL exits should be placed. These values will show up under the arrow, based on your Risk/Reward ratio.
Pips are much more simple, and will only show you the market entry point and how many pips up/down to place your SL/TP. Warning: This is fixed at a 1:1 RRR .
Risk/Reward Adjustment
Each entry arrow color allows custom risk/reward ratio adjustment.
Dollar Amounts Displayed
Change your account value and leverage to see how much you would have won on each trade.
How to trade with it?
(Forex, 1H) Open the settings, and turn on all the arrow entries. Turn on Backtest mode to see how past trades would have played out. Turn on TakeProfit/StopLoss Targets to see where to set your targets, for each arrow. Set an alert to notify you once per candle close when there is an Entry. Trade happy!
Bill Williams Alligators are also included, if you want. Not necessary though. Some of the calculations depend on them for trend direction analysis.

MA ExtensionThis indicator measures the vertical distance form the current close to the MA of your choice. I find that it does not work best as an oscillator, but it works well for providing early signals for taking profits when trend continuating. For example, if you go short due to a retracement to the MA (of your choice) take profits when a bearish trendline is broken (signalling the start of a bullish correction) that corresponds to the highs of the chart. The logic behind this indicator is that the breakouts of trendlines of an assets difference from an MA will precede corresponding breakouts of trendlines drawn on raw price. Kind of like Momentum, except it takes trend into account. Momentum has the same leading feature when it comes to drawing trendlines , but trendlines will be harder to draw due to the Momentum indicators oscillatory behavior.
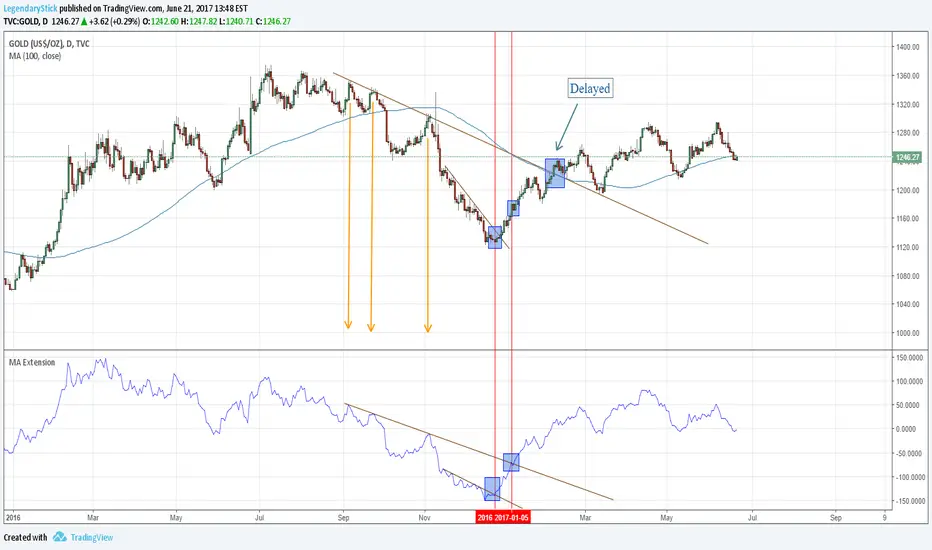
MA ExtensionThis indicator measures the vertical distance form the current close to the MA of your choice. I find that it does not work best as an oscillator, but it works well for providing early signals for taking profits when trend continuating. For example, if you go short due to a retracement to the MA (of your choice) take profits when a bearish trendline is broken (signalling the start of a bullish correction) that corresponds to the highs of the chart. The logic behind this indicator is that the breakouts of trendlines of an assets difference from an MA will precede corresponding breakouts of trendlines drawn on raw price. Kind of like Momentum, except it takes trend into account. Momentum has the same leading feature when it comes to drawing trendlines , but trendlines will be harder to draw due to the Momentum indicators oscillatory behavior.

Crypto Strategy SUSDT 10 minThis strategy is designed to trade the **SUSDT** pair on a **10-minute time frame**, using a combination of an Exponential Moving Average (EMA) and percentage-based Stop Loss (SL) and Take Profit (TP) levels.
### How the strategy works:
1. **EMA Calculation**:
- The strategy calculates a 24-period Exponential Moving Average (EMA) based on the closing price.
- This EMA serves as the primary trend indicator.
2. **Entry Conditions**:
- **Long Position**: A long position is entered when the closing price is above the EMA and the opening price is below the EMA. This indicates a potential upward trend.
- **Short Position**: A short position is entered when the closing price is below the EMA and the opening price is above the EMA. This indicates a potential downward trend.
3. **Stop Loss and Take Profit**:
- Both Stop Loss (SL) and Take Profit (TP) are calculated based on the entry price of the position.
- **For Long Positions**:
- Stop Loss is set as a percentage below the entry price.
- Take Profit is set as a percentage above the entry price.
- **For Short Positions**:
- Stop Loss is set as a percentage above the entry price.
- Take Profit is set as a percentage below the entry price.
- The percentage values for SL and TP can be adjusted in the strategy's settings (default: SL = 2%, TP = 4%).
4. **Exit Conditions**:
- The position is closed automatically when either the Stop Loss or Take Profit level is reached.
5. **Visualization**:
- The 24-period EMA is plotted on the chart as a blue line, helping visualize the trend direction.
### Key Features:
- **Pair and Time Frame**: The strategy is optimized for the SUSDT pair on a 10-minute time frame.
- **Customizable Parameters**: Users can adjust the Stop Loss and Take Profit percentages to suit their risk tolerance and trading style.
- **Trend-Following Approach**: The strategy uses the EMA to identify and follow the current market trend.
This strategy is simple yet effective for capturing trends while managing risk through predefined Stop Loss and Take Profit levels.

BullBear with Volume-Percentile TP - Strategy [presentTrading] Happy New Year, everyone! I hope we have a fantastic year ahead.
It's been a while since I published an open script, but it's time to return.
This strategy introduces an indicator called Bull Bear Power, combined with an advanced take-profit system, which is the main innovative and educational aspect of this script. I hope all of you find some useful insights here. Welcome to engage in meaningful exchanges. This is a versatile tool suitable for both novice and experienced traders.
█ Introduction and How it is Different
Unlike traditional strategies that rely solely on price or volume indicators, this approach combines Bull Bear Power (BBP) with volume percentile analysis to identify optimal entry and exit points. It features a dynamic take-profit mechanism based on ATR (Average True Range) multipliers adjusted by volume and percentile factors, ensuring adaptability to diverse market conditions. This multifaceted strategy not only improves signal accuracy but also optimizes risk management, distinguishing it from conventional trading methods.
BTCUSD 6hr performance
Disable the visualization of Bull Bear Power (BBP) to clearly view the Z-Score.
█ Strategy, How it Works: Detailed Explanation
The BBP Strategy with Volume-Percentile TP utilizes several interconnected components to analyze market data and generate trading signals. Here's an overview with essential equations:
🔶 Core Indicators and Calculations
1. Exponential Moving Average (EMA):
- **Purpose:** Smoothens price data to identify trends.
- **Formula:**
EMA_t = (Close_t * (2 / (lengthInput + 1))) + (EMA_(t-1) * (1 - (2 / (lengthInput + 1))))
- Usage: Baseline for Bull and Bear Power.
2. Bull and Bear Power:
- Bull Power: `BullPower = High_t - EMA_t`
- Bear Power: `BearPower = Low_t - EMA_t`
- BBP:** `BBP = BullPower + BearPower`
- Interpretation: Positive BBP indicates bullish strength, negative indicates bearish.
3. Z-Score Calculation:
- Purpose: Normalizes BBP to assess deviation from the mean.
- Formula:
Z-Score = (BBP_t - bbp_mean) / bbp_std
- Components:
- `bbp_mean` = SMA of BBP over `zLength` periods.
- `bbp_std` = Standard deviation of BBP over `zLength` periods.
- Usage: Identifies overbought or oversold conditions based on thresholds.
🔶 Volume Analysis
1. Volume Moving Average (`vol_sma`):
vol_sma = (Volume_1 + Volume_2 + ... + Volume_vol_period) / vol_period
2. Volume Multiplier (`vol_mult`):
vol_mult = Current Volume / vol_sma
- Thresholds:
- High Volume: `vol_mult > 2.0`
- Medium Volume: `1.5 < vol_mult ≤ 2.0`
- Low Volume: `1.0 < vol_mult ≤ 1.5`
🔶 Percentile Analysis
1. Percentile Calculation (`calcPercentile`):
Percentile = (Number of values ≤ Current Value / perc_period) * 100
2. Thresholds:
- High Percentile: >90%
- Medium Percentile: >80%
- Low Percentile: >70%
🔶 Dynamic Take-Profit Mechanism
1. ATR-Based Targets:
TP1 Price = Entry Price ± (ATR * atrMult1 * TP_Factor)
TP2 Price = Entry Price ± (ATR * atrMult2 * TP_Factor)
TP3 Price = Entry Price ± (ATR * atrMult3 * TP_Factor)
- ATR Calculation:
ATR_t = (True Range_1 + True Range_2 + ... + True Range_baseAtrLength) / baseAtrLength
2. Adjustment Factors:
TP_Factor = (vol_score + price_score) / 2
- **vol_score** and **price_score** are based on current volume and price percentiles.
Local performance
🔶 Entry and Exit Logic
1. Long Entry: If Z-Score crosses above 1.618, then Enter Long.
2. Short Entry: If Z-Score crosses below -1.618, then Enter Short.
3. Exiting Positions:
If Long and Z-Score crosses below 0:
Exit Long
If Short and Z-Score crosses above 0:
Exit Short
4. Take-Profit Execution:
- Set multiple exit orders at dynamically calculated TP levels based on ATR and adjusted by `TP_Factor`.
█ Trade Direction
The strategy determines trade direction using the Z-Score from the BBP indicator:
- Long Positions:
- Condition: Z-Score crosses above 1.618.
- Short Positions:
- Condition: Z-Score crosses below -1.618.
- Exiting Trades:
- Long Exit: Z-Score drops below 0.
- Short Exit: Z-Score rises above 0.
This approach aligns trades with prevailing market trends, increasing the likelihood of successful outcomes.
█ Usage
Implementing the BBP Strategy with Volume-Percentile TP in TradingView involves:
1. Adding the Strategy:
- Copy the Pine Script code.
- Paste it into TradingView's Pine Editor.
- Save and apply the strategy to your chart.
2. Configuring Settings:
- Adjust parameters like EMA length, Z-Score thresholds, ATR multipliers, volume periods, and percentile settings to match your trading preferences and asset behavior.
3. Backtesting:
- Use TradingView’s backtesting tools to evaluate historical performance.
- Analyze metrics such as profit factor, drawdown, and win rate.
4. Optimization:
- Fine-tune parameters based on backtesting results.
- Test across different assets and timeframes to enhance adaptability.
5. Deployment:
- Apply the strategy in a live trading environment.
- Continuously monitor and adjust settings as market conditions change.
█ Default Settings
The BBP Strategy with Volume-Percentile TP includes default parameters designed for balanced performance across various markets. Understanding these settings and their impact is essential for optimizing strategy performance:
Bull Bear Power Settings:
- EMA Length (`lengthInput`): 21
- **Effect:** Balances sensitivity and trend identification; shorter lengths respond quicker but may generate false signals.
- Z-Score Length (`zLength`): 252
- **Effect:** Long period for stable mean and standard deviation, reducing false signals but less responsive to recent changes.
- Z-Score Threshold (`zThreshold`): 1.618
- **Effect:** Higher threshold filters out weaker signals, focusing on significant market moves.
Take Profit Settings:
- Use Take Profit (`useTP`): Enabled (`true`)
- **Effect:** Activates dynamic profit-taking, enhancing profitability and risk management.
- ATR Period (`baseAtrLength`): 20
- **Effect:** Shorter period for sensitive volatility measurement, allowing tighter profit targets.
- ATR Multipliers:
- **Effect:** Define conservative to aggressive profit targets based on volatility.
- Position Sizes:
- **Effect:** Diversifies profit-taking across multiple levels, balancing risk and reward.
Volume Analysis Settings:
- Volume MA Period (`vol_period`): 100
- **Effect:** Longer period for stable volume average, reducing the impact of short-term spikes.
- Volume Multipliers:
- **Effect:** Determines volume conditions affecting take-profit adjustments.
- Volume Factors:
- **Effect:** Adjusts ATR multipliers based on volume strength.
Percentile Analysis Settings:
- Percentile Period (`perc_period`): 100
- **Effect:** Balances historical context with responsiveness to recent data.
- Percentile Thresholds:
- **Effect:** Defines price and volume percentile levels influencing take-profit adjustments.
- Percentile Factors:
- **Effect:** Modulates ATR multipliers based on price percentile strength.
Impact on Performance:
- EMA Length: Shorter EMAs increase sensitivity but may cause more false signals; longer EMAs provide stability but react slower to market changes.
- Z-Score Parameters:*Longer Z-Score periods create more stable signals, while higher thresholds reduce trade frequency but increase signal reliability.
- ATR Multipliers and Position Sizes: Higher multipliers allow for larger profit targets with increased risk, while diversified position sizes help in securing profits at multiple levels.
- Volume and Percentile Settings: These adjustments ensure that take-profit targets adapt to current market conditions, enhancing flexibility and performance across different volatility environments.
- Commission and Slippage: Accurate settings prevent overestimation of profitability and ensure the strategy remains viable after accounting for trading costs.
Conclusion
The BBP Strategy with Volume-Percentile TP offers a robust framework by combining BBP indicators with volume and percentile analyses. Its dynamic take-profit mechanism, tailored through ATR adjustments, ensures that traders can effectively capture profits while managing risks in varying market conditions.

Trend Trader-RemasteredThe script was originally coded in 2018 with Pine Script version 3, and it was in invite only status. It has been updated and optimised for Pine Script v5 and made completely open source.
Overview
The Trend Trader-Remastered is a refined and highly sophisticated implementation of the Parabolic SAR designed to create strategic buy and sell entry signals, alongside precision take profit and re-entry signals based on marked Bill Williams (BW) fractals. Built with a deep emphasis on clarity and accuracy, this indicator ensures that only relevant and meaningful signals are generated, eliminating any unnecessary entries or exits.
Key Features
1) Parabolic SAR-Based Entry Signals:
This indicator leverages an advanced implementation of the Parabolic SAR to create clear buy and sell position entry signals.
The Parabolic SAR detects potential trend shifts, helping traders make timely entries in trending markets.
These entries are strategically aligned to maximise trend-following opportunities and minimise whipsaw trades, providing an effective approach for trend traders.
2) Take Profit and Re-Entry Signals with BW Fractals:
The indicator goes beyond simple entry and exit signals by integrating BW Fractal-based take profit and re-entry signals.
Relevant Signal Generation: The indicator maintains strict criteria for signal relevance, ensuring that a re-entry signal is only generated if there has been a preceding take profit signal in the respective position. This prevents any misleading or premature re-entry signals.
Progressive Take Profit Signals: The script generates multiple take profit signals sequentially in alignment with prior take profit levels. For instance, in a buy position initiated at a price of 100, the first take profit might occur at 110. Any subsequent take profit signals will then occur at prices greater than 110, ensuring they are "in favour" of the original position's trajectory and previous take profits.
3) Consistent Trend-Following Structure:
This design allows the Trend Trader-Remastered to continue signaling take profit opportunities as the trend advances. The indicator only generates take profit signals in alignment with previous ones, supporting a systematic and profit-maximising strategy.
This structure helps traders maintain positions effectively, securing incremental profits as the trend progresses.
4) Customisability and Usability:
Adjustable Parameters: Users can configure key settings, including sensitivity to the Parabolic SAR and fractal identification. This allows flexibility to fine-tune the indicator according to different market conditions or trading styles.
User-Friendly Alerts: The indicator provides clear visual signals on the chart, along with optional alerts to notify traders of new buy, sell, take profit, or re-entry opportunities in real-time.
