Average True Range Pivot(2) High and ATR tick colorsTakes original colored ATR tick code from Autarch_Capital and adds pivot (2) high. In image the green upticks are thickened to make them easier to see. Can change in settings.
Search in scripts for "TAKE"


Opening Range Breakout (15 mins Range)Take the guesswork out of your trading with the Opening Range Breakout Pro script. This tool automatically marks the high and low of the first 15 minutes of the NYSE session, then highlights the first candle to break out above or below this range—removing ambiguity from your trade entries.
The opening range is one of the most powerful concepts in day trading. By identifying the price range set during the market’s first minutes, you gain a clear framework for your trades. When price breaks out above the range, it often signals a strong bullish move; a break below signals bearish momentum. This script visually marks these moments, so you can react quickly and confidently.
Why use Opening Range Breakout Pro?
• Defined Entry and Exit Points: The script gives you clear, objective breakout levels—no more guessing when to enter a trade.
• Removes Emotional Trading: With visual cues for breakouts, you can follow a systematic approach and avoid hesitation or FOMO.
• Backtested, Time-Tested Strategy: The opening range breakout has been used by professional traders for decades to capture early trends and maximize profit potential.
• High Reward Potential: By capitalizing on the volatility and momentum of the opening session, traders often catch the best moves of the day.
• Easy to Use: Just add to your chart—no configuration needed. The script works on any NYSE stock, on a 5-minute chart.
How it works:
• Draws the opening 15-minute high and low as orange lines.
• Labels the range prices for quick reference.
• Marks the first candle to close above the range with an orange ▲, and the first to close below with an orange ▼.
Take control of your trading day, remove uncertainty, and trade with confidence—just like the pros.

Log Distance From MA + RibbonTaken inspiration from @dkncrypto from his "Percentage Distance from MA" indicator.
I did a couple of very simple modifications.
I added exotic calculations so that it works properly in charts that reach the zero value (like the yield curve).
I also added a ribbon. It is now clearer when price is under resistance when compared to the deviation of it's trend.
The standard price ribbon describes support/resistance levels based on absolute vertical price distance.
The ribbon on the indicator I built describes support/resistance levels based around the trend of the price.
One could couple it with the KST-Based MACD indicator I built.
In my future analyses, I will consider skipping the standard price ribbon and consult the Distance-From-MA ribbon.
Tread lightly, for this is hallowed ground.
-Father Grigori

Quick and Simple - WPR+RSI+CCITake a look.
Couple of confluencial reversal signals from popular indicators (W%R, RSI & CCI). I can only say this shows how random the "stanard tools" are and how the market makers "play" these kind of tools to their advantage.
That said. It's better tha average, but not top-class, so expect to have to take signals with other confluence. DON'T take the plots or signals as buy / sell signals, they are just confluencial movements from these indicators based on how they should be "traditionally" used. Instead, use it as a guide as to what other traders may be thinking, or as a pull-back identifier.
Included 100 period ema as basic trend filter.
Not my normal type of script + been away for some time so be kind, lol :)
You might find it useful however so sharing.
More stuff to follow :)

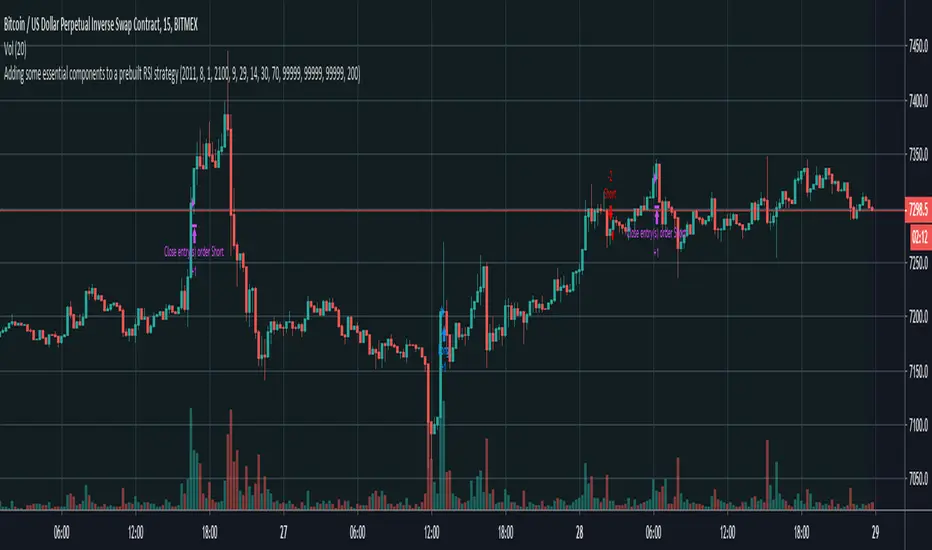
Adding some essential components to a prebuilt RSI strategy v4Taken from and just updated to compile in version 4. Added notes for users on where to swap out RSI component with their setup components to signal a long or short position.
SCDTM IndexTaken from Brian Beamish's IWBADT and DI scripts/concepts. A bullish reading of 3 means the 3 time frames are in agreement. Green is Bullish and Red is Bearish. In the future i'll be adding inputs to adjust the default 9/18EMA parameters as well as giving the user ability to adjust the 3 time frames from the defaults of Daily, 4Hr, and 1HR.

KAMATaken an existing strategy and converted into a study + added the Buy/ Sell arrow.
I will update this submission and give proper credit once I find the original owner. Enjoy.

Recursive Moving Trend Average Taken from an article "The Yen Recused" in the December 1998 issue of TASC,
written by Dennis Meyers. He describes the Recursive MA in mathematical terms
as "recursive polynomial fit, a technique that uses a small number of past values
of the estimated price and today's price to predict tomorrows price."
Red bars color - short position. Green is long.
You can change long to short in the Input Settings
Please, use it only for learning or paper trading. Do not for real trading.

Recursive Moving Trend Average Strategy Taken from an article "The Yen Recused" in the December 1998 issue of TASC,
written by Dennis Meyers. He describes the Recursive MA in mathematical terms
as "recursive polynomial fit, a technique that uses a small number of past values
of the estimated price and today's price to predict tomorrows price."
Red bars color - short position. Green is long.
Recursive Moving Trend Average Taken from an article "The Yen Recused" in the December 1998 issue of TASC,
written by Dennis Meyers. He describes the Recursive MA in mathematical terms
as "recursive polynomial fit, a technique that uses a small number of past values
of the estimated price and today's price to predict tomorrows price."
📋 Trading Checklist – Precision Entry SystemTake your trading discipline to the next level with this Precision Trading Checklist for TradingView. Designed for intraday traders following liquidity, structure, and Smart Money Concepts (SMC) AKA ICT Concepts, this overlay ensures you never miss a key confirmation before entering a trade.
Features:
✅ Pre-Market Preparation: Track previous session highs/lows, AM/PM sessions, and key liquidity zones.
✅ Bias & Narrative Check: Quickly confirm daily trend, price position relative to daily open, and higher timeframe confluence.
✅ Session-Specific Rules: Focused sessions like Silver Bullet (10:00–11:30), Afternoon (13:30–15:00), and Final Hour (15:00–16:00).
✅ Structure & Setup Validation: Confirm liquidity sweeps, market structure shifts, expansion candles, fair value gaps, and order blocks.
✅ Risk Management Reminders: Stop-loss, target points, risk percentage, breakeven management, and pyramiding rules.
✅ Post-Trade Journaling: Document entries, session, setup type, trade outcome, and grading for continuous improvement.
✅ Golden Rules: Visual reminders to enforce discipline, avoid emotional trades, and respect session limits.
Why Use It:
This checklist is perfect for traders who want to stay consistent, minimise mistakes, and follow a disciplined routine. Displayed as an overlay on your chart, it provides all essential checks in one glance, keeping you focused on the setup rather than scrolling through notes or separate trackers.
How to use:
Add the indicator to your chart
Click the settings/gear icon
Check off items as you complete them
The checklist on your chart updates in real-time with green checkmarks!
The checkboxes will persist as long as the indicator is on your chart,
making it perfect for tracking your pre-trade and post-trade routines!
Follow the checklist items step by step before entering trades.
Use the session-specific guidelines to filter setups.
Journal your trades post-execution for growth and analysis.

Kalman Step Signals [AlgoAlpha]Take your trading to the next level with the Kalman Step Signals indicator by AlgoAlpha! This advanced tool combines the power of Kalman Filtering and the Supertrend indicator, offering a unique perspective on market trends and price movements. Designed for traders who seek clarity and precision in identifying trend shifts and potential trade entries, this indicator is packed with customizable features to suit your trading style.
Key Features
🔍 Kalman Filter Smoothing : Dynamically smooths price data with user-defined parameters for Alpha, Beta, and Period, optimizing responsiveness and trend clarity.
📊 Supertrend Overlay : Incorporates a classic Supertrend indicator to provide clear visual cues for trend direction and potential reversals.
🎨 Customizable Appearance : Adjust colors for bullish and bearish trends, along with optional exit bands for more nuanced analysis.
🔔 Smart Alerts : Detect key moments like trend changes or rejection entries for timely trading decisions.
📈 Advanced Visualization : Includes optional entry signals, exit bands, and rejection markers to pinpoint optimal trading opportunities.
How to Use
Add the Indicator : Add the script to your TradingView favorites. Customize inputs like Kalman parameters (Alpha, Beta, Period) and Supertrend settings (Factor, ATR Period) based on your trading strategy.
Interpret the Signals : Watch for trend direction changes using Supertrend lines and directional markers. Utilize rejection entries to identify price rejections at trendlines for precision entry points.
Set Alerts : Enable the built-in alert conditions for trend changes or rejection entries to act swiftly on trading opportunities without constant chart monitoring.
How It Works
The indicator leverages a Kalman Filter to smooth raw price data, balancing responsiveness and noise reduction using user-controlled parameters. This refined price data is then fed into a Supertrend calculation, combining ATR-based volatility analysis with dynamic upper and lower bands. The result is a clear and reliable trend-detection system. Additionally, it features rejection markers for bullish and bearish reversals when prices reject the trendline, along with exit bands to visualize potential price targets. The integration of customizable alerts ensures traders never miss critical market moves.
Add the Kalman Step Signals to your TradingView charts today and enjoy a smarter, more efficient trading experience! 🚀🌟

EMA clouds Elle 4,5/8,21/34,50Take Entry close to 10 min 4/5 EMA ONLY
Daily 20/21 EMA is great pivot for bullish/bearish trend change, specially bounces!


SB_RSI/MFI with Volatility Version 1.0Take on LazyBear's SB_RSI/MFI with Volatility Indicator.
The original indicator is coupled with the Bollinger Band strategy.
Original Idea:
Wanted to test the indicator with bbstrategy.
Message if you think of any modifications/ enhancements/ any opportunities. :)
Donations/Tips... :) -
BTC: 1BjswGcRR6c23pka7qh5t5k56j46cuyyy2
ETH: 0x64fed71c9d6c931639c7ba4671aeb6b05e6b3781
LTC: LKT2ykQ8QSzzfTDB6Tnsf12xwYPjgq95h4

Rapid Candle PATTERNSIndicator Title: Rapid Candle Patterns - High-Probability Signals
Description
Tired of noisy charts filled with weak and ambiguous candlestick patterns? The Rapid Candle Patterns indicator is engineered to solve this problem by moving beyond simple textbook definitions. It identifies only high-probability reversal and continuation signals by focusing on the underlying market dynamics: momentum, liquidity, and confirmation.
This is not just another pattern indicator; it's a professional-grade tool designed to help you spot truly significant price action events.
How The Logic Works & Why It's More Accurate
Each pattern in this script has been enhanced with stricter, more intelligent rules to filter out noise and reduce false signals. Here’s what makes our logic superior:
1. The Liquidity Grab Hammer & Inverted Hammer
Standard Logic: A simple hammer shows a long lower wick, suggesting buyers pushed the price back up.
Our Enhanced Logic: We don't just look for a hammer shape. Our signal is only valid if the hammer’s low takes out the low of the previous candle (a "liquidity grab" or "stop hunt").
Why It's More Accurate: This sequence is incredibly powerful. It shows that sellers attempted to push the market lower, triggered stop-loss orders below the prior low, and then were decisively overpowered by buyers who reversed the price. This isn't just a reversal; it's a failed breakdown, often trapping sellers and fueling a stronger move in the opposite direction.
2. The "True" Bullish & Bearish Harami
Standard Logic: A small candle forms within the high-low range of the previous candle. This can often be misleading if the prior candle has long wicks and a tiny body.
Our Enhanced Logic: We enforce a "dual containment" rule. For a Harami to be valid, its body must be contained within the body of the previous candle. We also ensure the Harami candle itself is not a Doji, meaning it must show some conviction.
Why It's More Accurate: This ensures you are seeing a genuine and significant contraction in momentum. It filters out scenarios where a large-bodied candle forms inside the wicks of a doji-like candle, which is not a true Harami. Our logic captures the "pregnant" pattern as it was intended—a moment of quiet consolidation before a potential new move.
3. The "Power" Bullish & Bearish Engulfing
Standard Logic: A candle's body engulfs the body of the previous candle. This is a common signal, but it often lacks follow-through.
Our Enhanced Logic: Our "Power Engulfing" requires two conditions: (1) The body must engulf the prior candle's body, AND (2) the candle must close beyond the entire high/low range of the prior candle.
Why It's More Accurate: This is the ultimate sign of confirmation. It doesn't just show that one side has won the battle for the session; it proves they had enough force to break the entire structure of the previous candle. This signifies immense momentum and dramatically increases the probability that the trend will continue in the direction of the engulfing candle.
4. The Quantified Doji
Our Logic: Instead of being a subjective pattern, a Doji is defined quantitatively. It's a candle whose body is less than or equal to a user-defined percentage (default 9%) of its total range.
Why It's More Accurate: It provides a consistent and objective measure of market indecision. Furthermore, any candle identified as a Doji is automatically disqualified from being a Hammer, ensuring clear and distinct signals.
User Customization
Toggle Patterns On/Off: Declutter your chart by only showing the patterns you want to see.
Fine-Tune Logic: Use the "Pattern Logic" settings to adjust the sensitivity of the Doji and Harami detectors to perfectly match your trading style, asset, and timeframe.
Disclaimer: This indicator is a powerful tool for identifying high-probability price action. However, no single indicator is a complete trading system. Always use these signals as part of a comprehensive strategy, combined with analysis of market structure, support/resistance levels, and other forms of confluence.
Serenity Model VIPI — by yuu_iuHere’s a concise, practical English guide for Serenity Model VIPI (Author: yuu_iu). It covers what it is, how to set it up for daily trading, how to tune it, and how we guarantee non-repainting.
Serenity Model VIPI — User Guide (Daily Close, Non‑Repainting)
Credits
- Author: yuu_iu
- Producer: yuu_iu
- Platform: TradingView (Pine Script v5)
1) What it is
Serenity Model VIPI is a multi‑module, context‑aware trading model that fuses signals from:
- Entry modules: VCP, Flow, Momentum, Mean Reversion, Breakout
- Exit/risk modules: Contrarian, Breakout Sell, Volume Delta Sell, Peak Detector, Overbought Exit, Profit‑Take
- Context/memory: Learns per Ticker/Sector/Market Regime and adjusts weights/aggression
- Learning engine: Runs short “fake trades” to learn safely before scaling real trades
It produces a weighted, context‑adjusted score and a final decision: BUY, SELL, TAKE_PROFIT, or WAIT.
2) How it works (high level)
- Each module computes a score per bar.
- A fusion layer combines module scores using accuracy and base weights, then adjusts by:
- Market regime (Bull/Bear/Sideways) and optional higher‑timeframe (HTF) bias
- Risk control neuron
- Context memory (ticker/sector/regime)
- Optional LLM mode can override marginal cases if context supports it.
- Final decision is taken at bar close only (no intrabar repaint).
3) Non‑repainting guarantee (Daily)
- Close‑only execution: All key actions use barstate.isconfirmed, so signals/entries/exits only finalize after the daily candle closes.
- No lookahead on HTF data: request.security() reads prior‑bar values (series ) for HTF close/EMA/RSI.
- Alerts at bar close: Alerts are fired once per bar close to prevent mid‑bar changes.
What this means: Once the daily bar closes, the decision and alert won’t be repainted.
4) Setup (TradingView)
- Paste the Pine v5 code into Pine Editor, click Add to chart.
- Timeframe: 1D (Daily).
- Optional: enable a date window for training/backtest
- Enable Custom Date Filter: ON
- Set Start Date / End Date
- Create alert (non‑repainting)
- Condition: AI TRADE Signal
- Options: Once Per Bar Close
- Webhook (optional): Paste your URL into “System Webhook URL (for AI events)”
- Watch the UI
- On‑chart markers: AI BUY / AI SELL / AI TAKE PROFIT
- Right‑side table: Trades, Win Rate, Avg Profit, module accuracies, memory source, HTF trend, etc.
- “AI Thoughts” label: brief reasoning and debug lines.
5) Daily trading workflow
- The model evaluates at daily close and may:
- Enter long (BUY) when buy votes + total score exceed thresholds, after context/risk checks
- Exit via trailing stop, hard stop, TAKE_PROFIT, or SELL decision
- Learning mode:
- Triggers short “fake trades” every N bars (default 3) and measures outcome after 5 bars
- Improves module accuracies and adjusts aggression once stable (min fake win% threshold)
- Memory application:
- When you change tickers, the model tries to apply Ticker or Sector memory for the current market regime to pre‑bias module weights/aggression.
6) Tuning (what to adjust and why)
Core controls
- Base Aggression Level (default 1.0): Higher = more trades and stronger decisions; start conservative on Daily (1.0–1.2).
- Learning Speed Multiplier (default 3): Faster adaptation after fake/real trades; too high can overreact.
- Min Fake Win Rate to Exit Learning (%) (default 10–20%): Raises the bar before trusting more real trades.
- Fake Trade Every N Bars (default 3): Frequency of learning attempts.
- Learning Threshold Win Rate (default 0.4): Governs when the learner should keep learning.
- Hard Stop Loss (%) (default 5–8%): Global emergency stop.
Multi‑Timeframe (MTF)
- Enable Multi‑Timeframe Confirmation: ON (recommended for Daily)
- HTF Trend Source: HOSE:VNINDEX for VN equities (or CURRENT_SYMBOL if you prefer)
- HTF Timeframe: D or 240 (for a strong bias)
- MTF Weight Adjustment: 0.2–0.4 (0.3 default is balanced)
Module toggles and base weights
- In strong uptrends: increase VCP, Momentum, Breakout (0.2–0.3 typical)
- In sideways low‑vol regimes: raise MeanRev (0.2–0.3)
- For exits/defense: Contrarian, Peak, Overbought Exit, Profit‑Take (0.1–0.2 each)
- Keep Flow on as a volume‑quality filter (≈0.2)
Memory and control
- Enable Shared Memory Across Tickers: ON to share learning
- Enable Sector‑Based Knowledge Transfer: ON to inherit sector tendencies
- Manual Reset Learning: Use sparingly to reset module accuracies if regime changes drastically
Risk management
- Hard Stop Loss (%): 5–8% typical on Daily
- Trailing Stop: ATR‑ and volatility‑adaptive; tightens faster in Bear/High‑Vol regimes
- Max hold bars: Shorter in Bear or Sideways High‑Vol to cut risk
Alerts and webhook
- Use AI TRADE Signal with Once Per Bar Close
- Webhook payload is JSON, including event type, symbol, time, win rates, equity, aggression, etc.
7) Recommended Daily preset (VN equities)
- MTF: Enable, Source: HOSE:VNINDEX, TF: D, Weight Adj: 0.3
- Aggression: 1.1
- Learning Speed: 3
- Min Fake Win Rate to Exit Learning: 15%
- Hard SL: 6%
- Base Weights:
- VCP 0.25, Momentum 0.25, Breakout 0.15, Flow 0.20
- MeanRev 0.20 (raise in sideways)
- Contrarian/Peak/Overbought/Profit‑Take: 0.10–0.20
- Leave other defaults as is, then fine‑tune by symbol/sector.
8) Reading the UI
- Table highlights: Real Trades, Win Rate, Avg Profit, Fake Actions/Win%, VCP Acc, Aggression, Equity, Score, Status (LEARNING/TRADING/REFLECTION), Last Real, Consec Loss, Best/Worst Trade, Pattern Score, Memory Source, Current Sector, AI Health, HTF Trend, Scheduler, Memory Loaded, Fake Active.
- Shapes: AI BUY (below bar), AI SELL/TAKE PROFIT (above bar)
- “AI Thoughts”: module contributions, context notes, debug lines
9) Troubleshooting
- No trades?
- Ensure timeframe is 1D and the date filter covers the chart range
- Check Scheduler Cooldown (3 bars default) and that barstate.isconfirmed (only at close)
- If MTF is ON and HTF is bearish, buy bias is reduced; relax MTF Weight Adjustment or module weights
- Too many/too few trades?
- Lower/raise Base Aggression Level
- Adjust base weights on key modules (raise entry modules to be more active; raise exit/defense modules to be more selective)
- Learning doesn’t end?
- Increase Min Fake Win Rate to Exit Learning only after it’s consistently stable; otherwise lower it or reduce Fake Trade Every N Bars
10) Important notes
- The strategy is non‑repainting at bar close by design (confirmed bars + HTF series + close‑only alerts).
- Backtest fills may differ from live fills due to slippage and broker rules; this is normal for all TradingView strategies.
- Always validate settings across multiple symbols and regimes before going live.
If you want, I can bundle this guide into a README section in your Pine code and add a small on‑chart signature (Author/Producer: yuu_iu) in the top‑right corner.

dhruv private 91400//@version=5
//
VERSION = '7.9-X'// 2024.3.20
strategy(
'LE VAN DO® - Swing Signals & Overlays Private™ 7.9-X',
shorttitle = 'LE VAN DO® - Swing Signals & Overlays Private™ 7.9-X' + VERSION,
overlay = true,
explicit_plot_zorder = true,
pyramiding = 0,
default_qty_type = strategy.percent_of_equity,
default_qty_value = 50,
calc_on_every_tick = false,
process_orders_on_close = true,
max_bars_back = 500,
initial_capital = 5000,
commission_type = strategy.commission.percent,
commission_value = 0.02,
max_lines_count = 500
)
//Truncate Function
truncate(number, decimals) =>
factor = math.pow(10, decimals)
int(number * factor) / factor
//
// === INPUTS ===
TPSType = input.string('Trailing', 'What TPS should be taken : ', options = )
setupType = input.string('Open/Close', title='What Trading Setup should be taken : ', options= )
scolor = input(true, title='Show coloured Bars to indicate Trend?')
almaRibbon = input(false, title='Enable Ribbon?')
//tradeType = input.string('BOTH', title='What trades should be taken : ', options= )
// === /INPUTS ===
// Display the probabilities in a table
//text01_ = str.tostring(timeframe.multiplier * intRes, '####')
//t = timenow + math.round(ta.change(time) * 25)
//var label lab01 = na
//label.delete(lab01)
//lab01 := label.new(t, close, text=text01_, style=label.style_label_left, yloc=yloc.price, xloc=xloc.bar_time, textalign=text.align_left, textcolor=color.white)
// Constants colours that include fully non-transparent option.
green100 = #008000FF
lime100 = #66bb6a
red100 = #f7525f
blue100 = #0000FFFF
aqua100 = #00FFFFFF
darkred100 = #8B0000FF
gray100 = #808080FF
/////////////////////////////////////////////
// Create non-repainting security function
rp_security(_symbol, _res, _src) =>
request.security(_symbol, _res, _src )
//
f_tfInMinutes() =>
_tfInMinutes = timeframe.period == '1' ? '3' : timeframe.period == '3' ? '5' : timeframe.period == '5' ? '15' : timeframe.period == '15' ? '30' : timeframe.period == '30' ? '60' : timeframe.period == '60' ? '240' : 'D'
_tfInMinutes
my_time1 = f_tfInMinutes()
tfmult = 18 //input.int(18, "Input Timeframe Multiplier")
f_resInMinutes() =>
_resInMinutes = timeframe.multiplier * (
timeframe.isseconds ? 1. / 60. :
timeframe.isminutes ? 1. :
timeframe.isdaily ? 1440. :
timeframe.isweekly ? 10080. :
timeframe.ismonthly ? 43800. : na)
my_time = str.tostring(f_resInMinutes()*tfmult)
useSource = close //input.string('Close', 'What Source to be used?', options = )
enableFilter = input(true, "Enable Backtesting Range Filtering")
fromDate = input.time(timestamp("01 Jan 2023 00:00 +0300"), "Start Date")
toDate = input.time(timestamp("31 Dec 2099 00:00 +0300"), "End Date")
tradeDateIsAllowed = not enableFilter or (time >= fromDate and time <= toDate)
filter1 = 'Filter with Atr'
filter2 = 'Filter with RSI'
filter3 = 'Atr or RSI'
filter4 = 'Atr and RSI'
filter5 = 'No Filtering'
filter6 = 'Entry Only in sideways market(By ATR or RSI)'
filter7 = 'Entry Only in sideways market(By ATR and RSI)'
typefilter = input.string(filter5, title='Sideways Filtering Input', options= , group='Strategy Options')
RSI = truncate(ta.rsi(close, input.int(7, group='RSI Filterring')), 2)
toplimitrsi = input.int(45, title='TOP Limit', group='RSI Filterring')
botlimitrsi = input.int(10, title='BOT Limit', group='RSI Filterring')
//ST = input.bool(true, title='Show Supertrend?', group='Supertrend Indicator')
//period = input.int(1440, group='Supertrend Indicator')
//mult = input.float(2.612, group='Supertrend Indicator')
atrfiltLen = 5 //input.int(5, minval=1, title='atr Length', group='Sideways Filtering Input')
atrMaType = 'EMA' //input.string('EMA', options= , group='Sideways Filtering Input', title='atr Moving Average Type')
atrMaLen = 5 //input.int(5, minval=1, title='atr MA Length', group='Sideways Filtering Input')
//filtering
atra = request.security(syminfo.tickerid, '', ta.atr(atrfiltLen))
atrMa = atrMaType == 'EM' ? ta.ema(atra, atrMaLen) : ta.sma(atra, atrMaLen)
updm = ta.change(high)
downdm = -ta.change(low)
plusdm = na(updm) ? na : updm > downdm and updm > 0 ? updm : 0
minusdm = na(downdm) ? na : downdm > updm and downdm > 0 ? downdm : 0
cndSidwayss1 = atra >= atrMa
cndSidwayss2 = RSI > toplimitrsi or RSI < botlimitrsi
cndSidways = cndSidwayss1 or cndSidwayss2
cndSidways1 = cndSidwayss1 and cndSidwayss2
Sidwayss1 = atra <= atrMa
Sidwayss2 = RSI < toplimitrsi and RSI > botlimitrsi
Sidways = Sidwayss1 or Sidwayss2
Sidways1 = Sidwayss1 and Sidwayss2
trendType = typefilter == filter1 ? cndSidwayss1 : typefilter == filter2 ? cndSidwayss2 : typefilter == filter3 ? cndSidways : typefilter == filter4 ? cndSidways1 : typefilter == filter5 ? RSI > 0 : typefilter == filter6 ? Sidways : typefilter == filter7 ? Sidways1 : na
// === /INPUTS ===
tf = my_time //input('15')
r = ticker.heikinashi(syminfo.tickerid)
openSeriesAlt = request.security(r, tf, open, lookahead=barmerge.lookahead_on)
closeSeriesAlt = request.security(r, tf, close, lookahead=barmerge.lookahead_on)
//openP = plot(almaRibbon ? openSeriesAlt : na, color=color.new(color.lime, 0), linewidth=3)
//closeP = plot(almaRibbon ? closeSeriesAlt : na, color=color.new(color.red, 0), linewidth=3)
BUYOC = ta.crossover(closeSeriesAlt, openSeriesAlt) and setupType == "Open/Close" and trendType
SELLOC = ta.crossunder(closeSeriesAlt, openSeriesAlt) and setupType == "Open/Close" and trendType
//strategy.entry('sell', direction=strategy.short, qty=trade_size, comment='sell', when=sel_entry)
//strategy.entry('buy', direction=strategy.long, qty=trade_size, comment='buy', when=buy_entry)
//trendColour = closeSeriesAlt > openSeriesAlt ? color.green : color.red
//bcolour = closeSeriesAlt > openSeriesAlt ? lime100 : red100
//barcolor(scolor ? bcolour : na, title='Bar Colours')
//closeP = plot(almaRibbon ? closeSeriesAlt : na, title='Close Series', color=color.new(trendColour, 20), linewidth=2, style=plot.style_line)
//openP = plot(almaRibbon ? openSeriesAlt : na, title='Open Series', color=color.new(trendColour, 20), linewidth=2, style=plot.style_line)
//fill(closeP, openP, color=color.new(trendColour, 80))
//
//rt = input(true, title="ATR Based REnko is the Default, UnCheck to use Traditional ATR?")
atrLen = 3 //input.int(3, title="RENKO_ATR", group = "Renko Settings")
isATR = true //input.bool(true, title="RENKO_USE_RENKO_ATR", group = "Renko Settings")
tradLen1 = 1000 //input.int(1000, title="RENKO_TRADITIONAL", group = "Renko Settings")
//Code to be implemented in V2
//mul = input(1, "Number Of minticks")
//value = mul * syminfo.mintick
tradLen = tradLen1 * 1
param = isATR ? ticker.renko(syminfo.tickerid, "ATR", atrLen) : ticker.renko(syminfo.tickerid, "Traditional", tradLen)
renko_close = request.security(param, my_time, close, lookahead=barmerge.lookahead_on)
renko_open = request.security(param, my_time, open, lookahead=barmerge.lookahead_on)
//============================================
//Sniper------------------------------------------------------------------------------------------------------------------------------------- // Signal 2
//============================================
//============================================
//EMA_CROSS-------------------------------------------------------------------------------------------------------------------------------- // Signal 4
//============================================
EMA1_length=input.int(2, "EMA1_length", group = "Renko Settings")
EMA2_length=input.int(10, "EMA2_length", group = "Renko Settings")
a = ta.ema(renko_close, EMA1_length)
b = ta.ema(renko_close, EMA2_length)
//BUY = ta.cross(a, b) and a > b and renko_open < renko_close
//SELL = ta.cross(a, b) and a < b and renko_close < renko_open
///////////////////////////////
// Determine long and short conditions
BUYR = ta.crossover(a, b) and setupType == "Renko" and trendType
SELLR = ta.crossunder(a, b) and setupType == "Renko" and trendType
sel_color = setupType == "Open/Close" ? closeSeriesAlt < openSeriesAlt : setupType == "Renko" ? renko_close < renko_open : na
buy_color = setupType == "Open/Close" ? closeSeriesAlt > openSeriesAlt : setupType == "Renko" ? renko_close > renko_open : na
sel_entry = setupType == "Open/Close" ? SELLOC : setupType == "Renko" ? SELLR : na
buy_entry = setupType == "Open/Close" ? BUYOC : setupType == "Renko" ? BUYR : na
trendColour = buy_color ? color.green : color.red
bcolour = buy_color ? lime100 : red100
barcolor(scolor ? bcolour : na, title='Bar Colours')
p11=plot(almaRibbon and setupType == "Open/Close" ? closeSeriesAlt : almaRibbon and setupType == "Renko" ? renko_close : na, style=plot.style_circles, linewidth=1, color=color.new(trendColour, 80), title="RENKO_1")
p22=plot(almaRibbon and setupType == "Open/Close" ? openSeriesAlt : almaRibbon and setupType == "Renko" ? renko_open : na, style=plot.style_circles, linewidth=1, color=color.new(trendColour, 80), title="RENKO_2")
fill(p11, p22, color=color.new(trendColour, 50), title="RENKO_fill")
//
lxTrigger = false
sxTrigger = false
leTrigger = buy_entry
seTrigger = sel_entry
// === /ALERT conditions.
buy = leTrigger //ta.crossover(closeSeriesAlt, openSeriesAlt)
sell = seTrigger //ta.crossunder(closeSeriesAlt, openSeriesAlt)
varip wasLong = false
varip wasShort = false
if barstate.isconfirmed
wasLong := false
else
if buy
wasLong := true
if barstate.isconfirmed
wasShort := false
else
if sell
wasShort := true
plotshape(wasLong, color = color.yellow)
plotshape(wasShort, color = color.yellow)
//plotshape(almaRibbon ? buy : na, title = "Buy", text = 'Buy', style = shape.labelup, location = location.belowbar, color= #39ff14, textcolor = #FFFFFF, size = size.tiny)
//plotshape(almaRibbon ? sell : na, title = "Exit", text = 'Exit', style = shape.labeldown, location = location.abovebar, color= #ff1100, textcolor = #FFFFFF, size = size.tiny)
// === STRATEGY ===
i_alert_txt_entry_long = "Short Exit" //input.text_area(defval = "Short Exit", title = "Long Entry Message", group = "Alerts")
i_alert_txt_exit_long = "Long Exit" //input.text_area(defval = "Long Exit", title = "Long Exit Message", group = "Alerts")
i_alert_txt_entry_short = "Go Short" //input.text_area(defval = "Go Short", title = "Short Entry Message", group = "Alerts")
i_alert_txt_exit_short = "Go Long" //input.text_area(defval = "Go Long", title = "Short Exit Message", group = "Alerts")
// Entries and Exits with TP/SL
//tradeType
if buy and TPSType == "Trailing" and tradeDateIsAllowed
strategy.close("Short" , alert_message = i_alert_txt_exit_short)
strategy.entry("Long" , strategy.long , alert_message = i_alert_txt_entry_long)
if sell and TPSType == "Trailing" and tradeDateIsAllowed
strategy.close("Long" , alert_message = i_alert_txt_exit_long)
strategy.entry("Short" , strategy.short, alert_message = i_alert_txt_entry_short)
//tradeType
if buy and TPSType == "Options" and tradeDateIsAllowed
// strategy.close("Short" , alert_message = i_alert_txt_exit_short)
strategy.entry("Long" , strategy.long , alert_message = i_alert_txt_entry_long)
if sell and TPSType == "Options" and tradeDateIsAllowed
strategy.close("Long" , alert_message = i_alert_txt_exit_long)
// strategy.entry("Short" , strategy.short, alert_message = i_alert_txt_entry_short)
G_RISK = '■ ' + 'Risk Management'
//#region ———— <↓↓↓ G_RISK ↓↓↓> {
//ATR SL Settings
atrLength = 20 //input.int(20, minval=1, title='ATR Length')
profitFactor = 2.5 //input(2.5, title='Take Profit Factor')
stopFactor = 1 //input(1.0, title='Stop Loss Factor')
// Calculate ATR
tpatrValue = ta.atr(atrLength)
// Calculate take profit and stop loss levels for buy signals
takeProfit1_buy = 1 * profitFactor * tpatrValue //close + profitFactor * atrValue
takeProfit2_buy = 2 * profitFactor * tpatrValue //close + 2 * profitFactor * atrValue
takeProfit3_buy = 3 * profitFactor * tpatrValue //close + 3 * profitFactor * atrValue
stopLoss_buy = close - takeProfit1_buy //stopFactor * tpatrValue
// Calculate take profit and stop loss levels for sell signals
takeProfit1_sell = 1 * profitFactor * tpatrValue //close - profitFactor * atrValue
takeProfit2_sell = 2 * profitFactor * tpatrValue //close - 2 * profitFactor * atrValue
takeProfit3_sell = 3 * profitFactor * tpatrValue //close - 3 * profitFactor * atrValue
stopLoss_sell = close + takeProfit1_sell //stopFactor * tpatrValue
// ———————————
//Tooltip
T_LVL = '(%) Exit Level'
T_QTY = '(%) Adjust trade exit volume'
T_MSG = 'Paste JSON message for your bot'
//Webhook Message
O_LEMSG = 'Long Entry'
O_LXMSGSL = 'Long SL'
O_LXMSGTP1 = 'Long TP1'
O_LXMSGTP2 = 'Long TP2'
O_LXMSGTP3 = 'Long TP3'
O_LXMSG = 'Long Exit'
O_SEMSG = 'Short Entry'
O_SXMSGSL = 'Short SL'
O_SXMSGA = 'Short TP1'
O_SXMSGB = 'Short TP2'
O_SXMSGC = 'Short TP3'
O_SXMSGX = 'Short Exit'
// on whole pips) for forex currency pairs.
pip_size = syminfo.mintick * (syminfo.type == "forex" ? 10 : 1)
// On the last historical bar, show the instrument's pip size
//if barstate.islastconfirmedhistory
// label.new(x=bar_index + 2, y=close, style=label.style_label_left,
// color=color.navy, textcolor=color.white, size=size.large,
// text=syminfo.ticker + "'s pip size is:\n" +
// str.tostring(pip_size))
// ——————————— | | | Line length guide |
i_lxLvlTP1 = leTrigger ? takeProfit1_buy : seTrigger ? takeProfit1_sell : na //input.float (1, 'Level TP1' , group = G_RISK, tooltip = T_LVL)
i_lxQtyTP1 = input.float (50, 'Qty TP1' , group = G_RISK, tooltip = T_QTY)
i_lxLvlTP2 = leTrigger ? takeProfit2_buy : seTrigger ? takeProfit2_sell : na //input.float (1.5, 'Level TP2' , group = G_RISK, tooltip = T_LVL)
i_lxQtyTP2 = input.float (30, 'Qty TP2' , group = G_RISK, tooltip = T_QTY)
i_lxLvlTP3 = leTrigger ? takeProfit3_buy : seTrigger ? takeProfit3_sell : na //input.float (2, 'Level TP3' , group = G_RISK, tooltip = T_LVL)
i_lxQtyTP3 = input.float (20, 'Qty TP3' , group = G_RISK, tooltip = T_QTY)
i_lxLvlSL = leTrigger ? takeProfit1_buy : seTrigger ? takeProfit1_sell : na //input.float (0.5, 'Stop Loss' , group = G_RISK, tooltip = T_LVL)
i_sxLvlTP1 = i_lxLvlTP1
i_sxQtyTP1 = i_lxQtyTP1
i_sxLvlTP2 = i_lxLvlTP2
i_sxQtyTP2 = i_lxQtyTP2
i_sxLvlTP3 = i_lxLvlTP3
i_sxQtyTP3 = i_lxQtyTP3
i_sxLvlSL = i_lxLvlSL
G_MSG = '■ ' + 'Webhook Message'
i_leMsg = O_LEMSG //input.string (O_LEMSG ,'Long Entry' , group = G_MSG, tooltip = T_MSG)
i_lxMsgSL = O_LXMSGSL //input.string (O_LXMSGSL ,'Long SL' , group = G_MSG, tooltip = T_MSG)
i_lxMsgTP1 = O_LXMSGTP1 //input.string (O_LXMSGTP1,'Long TP1' , group = G_MSG, tooltip = T_MSG)
i_lxMsgTP2 = O_LXMSGTP2 //input.string (O_LXMSGTP2,'Long TP2' , group = G_MSG, tooltip = T_MSG)
i_lxMsgTP3 = O_LXMSGTP3 //input.string (O_LXMSGTP3,'Long TP3' , group = G_MSG, tooltip = T_MSG)
i_lxMsg = O_LXMSG //input.string (O_LXMSG ,'Long Exit' , group = G_MSG, tooltip = T_MSG)
i_seMsg = O_SEMSG //input.string (O_SEMSG ,'Short Entry' , group = G_MSG, tooltip = T_MSG)
i_sxMsgSL = O_SXMSGSL //input.string (O_SXMSGSL ,'Short SL' , group = G_MSG, tooltip = T_MSG)
i_sxMsgTP1 = O_SXMSGA //input.string (O_SXMSGA ,'Short TP1' , group = G_MSG, tooltip = T_MSG)
i_sxMsgTP2 = O_SXMSGB //input.string (O_SXMSGB ,'Short TP2' , group = G_MSG, tooltip = T_MSG)
i_sxMsgTP3 = O_SXMSGC //input.string (O_SXMSGC ,'Short TP3' , group = G_MSG, tooltip = T_MSG)
i_sxMsg = O_SXMSGX //input.string (O_SXMSGX ,'Short Exit' , group = G_MSG, tooltip = T_MSG)
i_src = close
G_DISPLAY = 'Display'
//
i_alertOn = true //input.bool (true, 'Alert Labels On/Off' , group = G_DISPLAY)
i_barColOn = true //input.bool (true, 'Bar Color On/Off' , group = G_DISPLAY)
// ———————————
// @function Calculate the Take Profit line, and the crossover or crossunder
f_tp(_condition, _conditionValue, _leTrigger, _seTrigger, _src, _lxLvlTP, _sxLvlTP)=>
var float _tpLine = 0.0
_topLvl = _src + _lxLvlTP //TPSType == "Fixed %" ? _src + (_src * (_lxLvlTP / 100)) : _src + _lxLvlTP
_botLvl = _src - _lxLvlTP //TPSType == "Fixed %" ? _src - (_src * (_sxLvlTP / 100)) : _src - _sxLvlTP
_tpLine := _condition != _conditionValue and _leTrigger ? _topLvl :
_condition != -_conditionValue and _seTrigger ? _botLvl :
nz(_tpLine )
// @function Similar to "ta.crossover" or "ta.crossunder"
f_cross(_scr1, _scr2, _over)=>
_cross = _over ? _scr1 > _scr2 and _scr1 < _scr2 :
_scr1 < _scr2 and _scr1 > _scr2
// ———————————
//
var float condition = 0.0
var float slLine = 0.0
var float entryLine = 0.0
//
entryLine := leTrigger and condition <= 0.0 ? close :
seTrigger and condition >= 0.0 ? close : nz(entryLine )
//
slTopLvl = TPSType == "Fixed %" ? i_src + (i_src * (i_lxLvlSL / 100)) : i_src + i_lxLvlSL
slBotLvl = TPSType == "Fixed %" ? i_src - (i_src * (i_sxLvlSL / 100)) : i_src - i_lxLvlSL
slLine := condition <= 0.0 and leTrigger ? slBotLvl :
condition >= 0.0 and seTrigger ? slTopLvl : nz(slLine )
slLong = f_cross(low, slLine, false)
slShort = f_cross(high, slLine, true )
//
= f_tp(condition, 1.2,leTrigger, seTrigger, i_src, i_lxLvlTP3, i_sxLvlTP3)
= f_tp(condition, 1.1,leTrigger, seTrigger, i_src, i_lxLvlTP2, i_sxLvlTP2)
= f_tp(condition, 1.0,leTrigger, seTrigger, i_src, i_lxLvlTP1, i_sxLvlTP1)
tp3Long = f_cross(high, tp3Line, true )
tp3Short = f_cross(low, tp3Line, false)
tp2Long = f_cross(high, tp2Line, true )
tp2Short = f_cross(low, tp2Line, false)
tp1Long = f_cross(high, tp1Line, true )
tp1Short = f_cross(low, tp1Line, false)
switch
leTrigger and condition <= 0.0 => condition := 1.0
seTrigger and condition >= 0.0 => condition := -1.0
tp3Long and condition == 1.2 => condition := 1.3
tp3Short and condition == -1.2 => condition := -1.3
tp2Long and condition == 1.1 => condition := 1.2
tp2Short and condition == -1.1 => condition := -1.2
tp1Long and condition == 1.0 => condition := 1.1
tp1Short and condition == -1.0 => condition := -1.1
slLong and condition >= 1.0 => condition := 0.0
slShort and condition <= -1.0 => condition := 0.0
lxTrigger and condition >= 1.0 => condition := 0.0
sxTrigger and condition <= -1.0 => condition := 0.0
longE = leTrigger and condition <= 0.0 and condition == 1.0
shortE = seTrigger and condition >= 0.0 and condition == -1.0
longX = lxTrigger and condition >= 1.0 and condition == 0.0
shortX = sxTrigger and condition <= -1.0 and condition == 0.0
longSL = slLong and condition >= 1.0 and condition == 0.0
shortSL = slShort and condition <= -1.0 and condition == 0.0
longTP3 = tp3Long and condition == 1.2 and condition == 1.3
shortTP3 = tp3Short and condition == -1.2 and condition == -1.3
longTP2 = tp2Long and condition == 1.1 and condition == 1.2
shortTP2 = tp2Short and condition == -1.1 and condition == -1.2
longTP1 = tp1Long and condition == 1.0 and condition == 1.1
shortTP1 = tp1Short and condition == -1.0 and condition == -1.1
// ——————————— {
//
if strategy.position_size <= 0 and longE and TPSType == "ATR" and tradeDateIsAllowed
strategy.entry( 'Long', strategy.long, alert_message = i_leMsg, comment = 'LE')
if strategy.position_size > 0 and condition == 1.0 and TPSType == "ATR" and tradeDateIsAllowed
strategy.exit( id = 'LXTP1', from_entry = 'Long', qty_percent = i_lxQtyTP1, limit = tp1Line, stop = slLine, comment_profit = 'LXTP1', comment_loss = 'SL', alert_profit = i_lxMsgTP1, alert_loss = i_lxMsgSL)
if strategy.position_size > 0 and condition == 1.1 and TPSType == "ATR" and tradeDateIsAllowed
strategy.exit( id = 'LXTP2', from_entry = 'Long', qty_percent = i_lxQtyTP2, limit = tp2Line, stop = slLine, comment_profit = 'LXTP2', comment_loss = 'SL', alert_profit = i_lxMsgTP2, alert_loss = i_lxMsgSL)
if strategy.position_size > 0 and condition == 1.2 and TPSType == "ATR" and tradeDateIsAllowed
strategy.exit( id = 'LXTP3', from_entry = 'Long', qty_percent = i_lxQtyTP3, limit = tp3Line, stop = slLine, comment_profit = 'LXTP3', comment_loss = 'SL', alert_profit = i_lxMsgTP3, alert_loss = i_lxMsgSL)
if longX and tradeDateIsAllowed
strategy.close( 'Long', alert_message = i_lxMsg, comment = 'LX')
//
if strategy.position_size >= 0 and shortE and TPSType == "ATR" and tradeDateIsAllowed
strategy.entry( 'Short', strategy.short, alert_message = i_leMsg, comment = 'SE')
if strategy.position_size < 0 and condition == -1.0 and TPSType == "ATR" and tradeDateIsAllowed
strategy.exit( id = 'SXTP1', from_entry = 'Short', qty_percent = i_sxQtyTP1, limit = tp1Line, stop = slLine, comment_profit = 'SXTP1', comment_loss = 'SL', alert_profit = i_sxMsgTP1, alert_loss = i_sxMsgSL)
if strategy.position_size < 0 and condition == -1.1 and TPSType == "ATR" and tradeDateIsAllowed
strategy.exit( id = 'SXTP2', from_entry = 'Short', qty_percent = i_sxQtyTP2, limit = tp2Line, stop = slLine, comment_profit = 'SXTP2', comment_loss = 'SL', alert_profit = i_sxMsgTP2, alert_loss = i_sxMsgSL)
if strategy.position_size < 0 and condition == -1.2 and TPSType == "ATR" and tradeDateIsAllowed
strategy.exit( id = 'SXTP3', from_entry = 'Short', qty_percent = i_sxQtyTP3, limit = tp3Line, stop = slLine, comment_profit = 'SXTP3', comment_loss = 'SL', alert_profit = i_sxMsgTP3, alert_loss = i_sxMsgSL)
if shortX and tradeDateIsAllowed
strategy.close( 'Short', alert_message = i_sxMsg, comment = 'SX')
// ———————————
c_tp = leTrigger or seTrigger ? na :
condition == 0.0 ? na : color.green
c_entry = leTrigger or seTrigger ? na :
condition == 0.0 ? na : color.blue
c_sl = leTrigger or seTrigger ? na :
condition == 0.0 ? na : color.red
p_tp1Line = plot ( condition == 1.0 or condition == -1.0 ? tp1Line : na, title = "TP Line 1", color = c_tp, linewidth = 1, style = plot.style_linebr)
p_tp2Line = plot ( condition == 1.0 or condition == -1.0 or condition == 1.1 or condition == -1.1 ? tp2Line : na, title = "TP Line 2", color = c_tp, linewidth = 1, style = plot.style_linebr)
p_tp3Line = plot ( condition == 1.0 or condition == -1.0 or condition == 1.1 or condition == -1.1 or condition == 1.2 or condition == -1.2 ? tp3Line : na, title = "TP Line 3", color = c_tp, linewidth = 1, style = plot.style_linebr)
p_entryLine = plot ( condition >= 1.0 or condition <= -1.0 ? entryLine : na, title = "Entry Line", color = c_entry, linewidth = 1, style = plot.style_linebr)
p_slLine = plot ( condition == 1.0 or condition == -1.0 or condition == 1.1 or condition == -1.1 or condition == 1.2 or condition == -1.2 ? slLine : na, title = "SL Line", color = c_sl, linewidth = 1, style = plot.style_linebr)
//fill( p_tp3Line, p_entryLine, color = leTrigger or seTrigger ? na :color.new(color.green, 90))
fill( p_entryLine, p_slLine, color = leTrigger or seTrigger ? na :color.new(color.red, 90))
//
plotshape( i_alertOn and longE, title = 'Long', text = 'Long', textcolor = color.white, color = color.green, style = shape.labelup, size = size.tiny, location = location.belowbar)
plotshape( i_alertOn and shortE, title = 'Short', text = 'Short', textcolor = color.white, color = color.red, style = shape.labeldown, size = size.tiny, location = location.abovebar)
plotshape( i_alertOn and (longX or shortX) ? close : na, title = 'Close', text = 'Close', textcolor = color.white, color = color.gray, style = shape.labelup, size = size.tiny, location = location.absolute)
l_tp = i_alertOn and (longTP1 or shortTP1) ? close : na
plotshape( l_tp, title = "TP1 Cross", text = "TP1", textcolor = color.white, color = #ec407a, style = shape.labelup, size = size.tiny, location = location.absolute)
plotshape( i_alertOn and (longTP2 or shortTP2) ? close : na, title = "TP2 Cross", text = "TP2", textcolor = color.white, color = #ec407a, style = shape.labelup, size = size.tiny, location = location.absolute)
plotshape( i_alertOn and (longTP3 or shortTP3) ? close : na, title = "TP3 Cross", text = "TP3", textcolor = color.white, color = #ec407a, style = shape.labelup, size = size.tiny, location = location.absolute)
plotshape( i_alertOn and (longSL or shortSL) ? close : na, title = "SL Cross", text = "SL", textcolor = color.white, color = color.maroon, style = shape.labelup, size = size.tiny, location = location.absolute)
//
plot( na, title = "─── ───", editable = false, display = display.data_window)
plot( condition, title = "condition", editable = false, display = display.data_window)
plot( strategy.position_size * 100, title = ".position_size", editable = false, display = display.data_window)
//#endregion }
// ——————————— <↑↑↑ G_RISK ↑↑↑>
//#region ———— <↓↓↓ G_SCRIPT02 ↓↓↓> {
// @function Queues a new element in an array and de-queues its first element.
f_qDq(_array, _val) =>
array.push(_array, _val)
_return = array.shift(_array)
_return
var line a_slLine = array.new_line(1)
var line a_entryLine = array.new_line(1)
var line a_tp3Line = array.new_line(1)
var line a_tp2Line = array.new_line(1)
var line a_tp1Line = array.new_line(1)
var label a_slLabel = array.new_label(1)
var label a_tp3label = array.new_label(1)
var label a_tp2label = array.new_label(1)
var label a_tp1label = array.new_label(1)
var label a_entryLabel = array.new_label(1)
newEntry = longE or shortE
entryIndex = 1
entryIndex := newEntry ? bar_index : nz(entryIndex )
lasTrade = bar_index >= entryIndex
l_right = 10
if TPSType == "ATR"
line.delete( f_qDq(a_slLine, line.new( entryIndex, slLine, last_bar_index + l_right, slLine, style = line.style_solid, color = c_sl)))
if TPSType == "ATR"
line.delete( f_qDq(a_entryLine, line.new( entryIndex, entryLine, last_bar_index + l_right, entryLine, style = line.style_solid, color = color.blue)))
if TPSType == "ATR"
line.delete( f_qDq(a_tp3Line, line.new( entryIndex, tp3Line, last_bar_index + l_right, tp3Line, style = line.style_solid, color = c_tp)))
if TPSType == "ATR"
line.delete( f_qDq(a_tp2Line, line.new( entryIndex, tp2Line, last_bar_index + l_right, tp2Line, style = line.style_solid, color = c_tp)))
if TPSType == "ATR"
line.delete( f_qDq(a_tp1Line, line.new( entryIndex, tp1Line, last_bar_index + l_right, tp1Line, style = line.style_solid, color = c_tp)))
if TPSType == "ATR"
label.delete( f_qDq(a_slLabel, label.new( last_bar_index + l_right, slLine, 'SL: ' + str.tostring(slLine, '##.###'), style = label.style_label_left, textcolor = color.white, color = c_sl)))
if TPSType == "ATR"
label.delete( f_qDq(a_entryLabel, label.new( last_bar_index + l_right, entryLine, 'Entry: ' + str.tostring(entryLine, '##.###'), style = label.style_label_left, textcolor = color.white, color = color.blue)))
if TPSType == "ATR"
label.delete( f_qDq(a_tp3label, label.new( last_bar_index + l_right, tp3Line, 'TP3: ' + str.tostring(tp3Line, '##.###') + " - Target Pips : - " + str.tostring(longE ? tp3Line - entryLine : entryLine - tp3Line, "#.##"), style = label.style_label_left, textcolor = color.white, color = c_tp)))
if TPSType == "ATR"
label.delete( f_qDq(a_tp2label, label.new( last_bar_index + l_right, tp2Line, 'TP2: ' + str.tostring(tp2Line, '##.###'), style = label.style_label_left, textcolor = color.white, color = c_tp)))
if TPSType == "ATR"
label.delete( f_qDq(a_tp1label, label.new( last_bar_index + l_right, tp1Line, 'TP1: ' + str.tostring(tp1Line, '##.###'), style = label.style_label_left, textcolor = color.white, color = c_tp)))
//#endregion }
// ——————————— <↑↑↑ G_SCRIPT02 ↑↑↑>
c_barCol = close > open ? color.rgb(120, 9, 139) : color.rgb(69, 155, 225)
barcolor(
i_barColOn ? c_barCol : na)
// ———————————
//
if longE or shortE or longX or shortX
alert(message = 'Any Alert', freq = alert.freq_once_per_bar_close)
if longE
alert(message = 'Long Entry', freq = alert.freq_once_per_bar_close)
if shortE
alert(message = 'Short Entry', freq = alert.freq_once_per_bar_close)
if longX
alert(message = 'Long Exit', freq = alert.freq_once_per_bar_close)
if shortX
alert(message = 'Short Exit', freq = alert.freq_once_per_bar_close)
//#endregion }
// ——————————— <↑↑↑ G_SCRIPT03 ↑↑↑>
// This source code is subject to the terms of the Mozilla Public License 2.0 at mozilla.org
// © TraderHalai
// This script was born out of my quest to be able to display strategy back test statistics on charts to allow for easier backtesting on devices that do not natively support backtest engine (such as mobile phones, when I am backtesting from away from my computer). There are already a few good ones on TradingView, but most / many are too complicated for my needs.
//
//Found an excellent display backtest engine by 'The Art of Trading'. This script is a snippet of his hard work, with some very minor tweaks and changes. Much respect to the original author.
//
//Full credit to the original author of this script. It can be found here: www.tradingview.com
//
// This script can be copied and airlifted onto existing strategy scripts of your own, and integrates out of the box without implementation of additional functions. I've also added Max Runup, Average Win and Average Loss per trade to the orignal script.
//
//Will look to add in more performance metrics in future, as I further develop this script.
//
//Feel free to use this display panel in your scripts and strategies.
//Thanks and enjoy! :)
//@version=5
//strategy("Strategy BackTest Display Statistics - TraderHalai", overlay=true, default_qty_value= 5, default_qty_type = strategy.percent_of_equity, initial_capital=10000, commission_type=strategy.commission.percent, commission_value=0.1)
//DEMO basic strategy - Use your own strategy here - Jaws Mean Reversion from my profile used here
//source = input(title = "Source", defval = close)
///////////////////////////// --- BEGIN TESTER CODE --- ////////////////////////
// COPY below into your strategy to enable display
////////////////////////////////////////////////////////////////////////////////
// Declare performance tracking variables
drawTester = input.bool(false, "Strategy Performance", group='Dashboards', inline="Show Dashboards")
var balance = strategy.initial_capital
var drawdown = 0.0
var maxDrawdown = 0.0
var maxBalance = 0.0
var totalWins = 0
var totalLoss = 0
// Prepare stats table
var table testTable = table.new(position.top_right, 5, 2, border_width=1)
f_fillCell(_table, _column, _row, _title, _value, _bgcolor, _txtcolor) =>
_cellText = _title + "\n" + _value
table.cell(_table, _column, _row, _cellText, bgcolor=_bgcolor, text_color=_txtcolor)
// Custom function to truncate (cut) excess decimal places
//truncate(_number, _decimalPlaces) =>
// _factor = math.pow(10, _decimalPlaces)
// int(_number * _factor) / _factor
// Draw stats table
var bgcolor = color.new(color.black,0)
if drawTester and tradeDateIsAllowed
if barstate.islastconfirmedhistory
// Update table
dollarReturn = strategy.netprofit
f_fillCell(testTable, 0, 0, "Total Trades:", str.tostring(strategy.closedtrades), bgcolor, color.white)
f_fillCell(testTable, 0, 1, "Win Rate:", str.tostring(truncate((strategy.wintrades/strategy.closedtrades)*100,2)) + "%", bgcolor, color.white)
f_fillCell(testTable, 1, 0, "Starting:", "$" + str.tostring(strategy.initial_capital), bgcolor, color.white)
f_fillCell(testTable, 1, 1, "Ending:", "$" + str.tostring(truncate(strategy.initial_capital + strategy.netprofit,2)), bgcolor, color.white)
f_fillCell(testTable, 2, 0, "Avg Win:", "$"+ str.tostring(truncate(strategy.grossprofit / strategy.wintrades, 2)), bgcolor, color.white)
f_fillCell(testTable, 2, 1, "Avg Loss:", "$"+ str.tostring(truncate(strategy.grossloss / strategy.losstrades, 2)), bgcolor, color.white)
f_fillCell(testTable, 3, 0, "Profit Factor:", str.tostring(truncate(strategy.grossprofit / strategy.grossloss,2)), strategy.grossprofit > strategy.grossloss ? color.green : color.red, color.white)
f_fillCell(testTable, 3, 1, "Max Runup:", str.tostring(truncate(strategy.max_runup, 2 )), bgcolor, color.white)
f_fillCell(testTable, 4, 0, "Return:", (dollarReturn > 0 ? "+" : "") + str.tostring(truncate((dollarReturn / strategy.initial_capital)*100,2)) + "%", dollarReturn > 0 ? color.green : color.red, color.white)
f_fillCell(testTable, 4, 1, "Max DD:", str.tostring(truncate((strategy.max_drawdown / strategy.equity) * 100 ,2)) + "%", color.red, color.white)
// --- END TESTER CODE --- ///////////////
// This Pine Script™ code is subject to the terms of the Mozilla Public License 2.0 at mozilla.org
// © niceGear68734
//@version=5
//strategy("Table to filter trades per day", overlay=true, use_bar_magnifier = true, initial_capital = 5000, calc_on_every_tick = true, calc_on_order_fills = true, commission_type = strategy.commission.cash_per_contract)
//~ ___________________________________________________________________________
//~ !!!!!!!!!!!!!!!!!!!!!!!!!!!!!!!!!!!!!!!!!!!!!!!!!!!!!!!!!!!!!!!!!!!!!!!!!!!
//~ !!!!!!!!!!!!!!!_________________ START _________________!!!!!!!!!!!!!!!!!
i_showweeklyPerformance = input.bool(false, 'Weekly Performance', group='Dashboards', inline="Show Dashboards")
//__________________________ User Inputs ___________________________________
var const string g_table = "Table Settings"
i_table_pos = "Top Left" //input.string(defval = "Top Left", title = "Position", options = , group = g_table, inline = "1", tooltip = "It sets the location of the table")
i_text_size = "Normal" //input.string(defval = "Normal", title = "Set the size of text", options = , tooltip = "This option is used to change the size of the text in the table")
var const string g_general = "General Settings"
i_check_open_close = "Opened" //input.string("Opened", "Check when the trade :", , group = g_general, tooltip = "This parameter defines what to check for. If opened is selected, the results will show the trades that opened on that day. If closed is selected, the results will show the trades that closed on that day")
i_timezone = "Exchange" //input.string("Exchange", title = "Set the Timezone", options = , group = g_general, tooltip = "You can use this setting whenever you want to change the time that the trade has closed/opened")
//~_____________________________ Switches ___________________________________
table_pos = switch i_table_pos
"Bottom Right" => position.bottom_right
"Bottom Left" => position.bottom_left
"Top Right" => position.top_right
"Top Left" => position.top_left
timezone_setting = i_timezone == "Exchange" ? syminfo.timezone : i_timezone
text_size = switch i_text_size
"Small" => size.small
"Normal" => size.normal
"Large" => size.large
//__________________________ Array Declaration _____________________________
var string t_column_names = array.from( "", "Sun", "Mon", "Tue", "Wed", "Thur", "Fri", "Sat") // Columns header names
var string t_row_names = array.from("", "Total Trades", "Loss", "Win", "Win Rate" ) // Rows header names
var t_column_size = array.size(t_column_names)
var t_row_size = array.size(t_row_names)
var string a_closed_trades = array.new_string() // Save the total number of trades
var string a_loss_trades = array.new_string() // Save the number of losing trades
var string a_win_trades = array.new_string() // Save the number of winning trades
var _a_day_week = array.new_int() // Save the day of the week to split data
// __________________________ Custom Functions ________________________________
//~ create a counter so that it gives a number to strategy.closed_trades.entry_time(counter)
var trade_number = -1
if strategy.closedtrades > strategy.closedtrades
trade_number += 1
f_strategy_closedtrades_hour() =>
switch
i_check_open_close =="Closed" => dayofweek(strategy.closedtrades.exit_time(trade_number), timezone_setting)
i_check_open_close =="Opened" => dayofweek(strategy.closedtrades.entry_time(trade_number), timezone_setting)
f_data(_i) =>
var _closed_trades = 0
var _loss_trades = 0
var _win_trades = 0
var _txt_closed_trades = ""
var _txt_loss_trades = ""
var _txt_win_trades = ""
if strategy.closedtrades > strategy.closedtrades and f_strategy_closedtrades_hour() == _i
_closed_trades += 1
_txt_closed_trades := str.tostring(_closed_trades)
if strategy.losstrades > strategy.losstrades and f_strategy_closedtrades_hour() == _i
_loss_trades += 1
_txt_loss_trades := str.tostring(_loss_trades)
if strategy.wintrades > strategy.wintrades and f_strategy_closedtrades_hour() == _i
_win_trades += 1
_txt_win_trades := str.tostring(_win_trades)
//__________________________
var string array1 = array.new_string(5)
var string array2 = array.new_string(5)
var string array3 = array.new_string(5)
var string array4 = array.new_string(5)
var string array5 = array.new_string(5)
var string array6 = array.new_string(5)
var string array7 = array.new_string(5)
f_pass_data_to_array(_i, _array) =>
= f_data(_i)
array.set(_array,1 , cl)
array.set(_array,2,loss)
array.set(_array,3,win)
if cl != ""
array.set(_array,4,str.tostring(str.tonumber(win) / str.tonumber(cl) * 100 , "##") + " %")
if cl != "" and win == ""
array.set(_array,4,"0 %")
for i = 1 to 7
switch
i == 1 => f_pass_data_to_array(i,array1)
i == 2 => f_pass_data_to_array(i,array2)
i == 3 => f_pass_data_to_array(i,array3)
i == 4 => f_pass_data_to_array(i,array4)
i == 5 => f_pass_data_to_array(i,array5)
i == 6 => f_pass_data_to_array(i,array6)
i == 7 => f_pass_data_to_array(i,array7)
f_retrieve_data_to_table(_i, _j) =>
switch
_i == 1 => array.get(array1, _j)
_i == 2 => array.get(array2, _j)
_i == 3 => array.get(array3, _j)
_i == 4 => array.get(array4, _j)
_i == 5 => array.get(array5, _j)
_i == 6 => array.get(array6, _j)
_i == 7 => array.get(array7, _j)
//~ ___________________________ Create Table ________________________________
create_table(_col, _row, _txt) =>
var table _tbl = table.new(position = table_pos, columns = t_column_size , rows = t_row_size, border_width=1)
color _color = _row == 0 or _col == 0 ? color.rgb(3, 62, 106) : color.rgb(2, 81, 155)
table.cell(_tbl, _col, _row, _txt, bgcolor = _color, text_color = color.white, text_size = text_size)
//~___________________________ Fill With Data _______________________________
if barstate.islastconfirmedhistory and i_showweeklyPerformance and tradeDateIsAllowed
for i = 0 to t_column_size - 1 by 1
for j = 0 to t_row_size - 1 by 1
_txt = ""
if i >= 0 and j == 0
_txt := array.get(t_column_names, i)
if j >= 0 and i == 0
_txt := array.get(t_row_names, j)
if i >= 1 and j >= 1 and j <= 5
_txt := f_retrieve_data_to_table( i , j)
create_table(i ,j , _txt)
//~ ___________________________ Notice ______________________________________
if timeframe.in_seconds() > timeframe.in_seconds("D")
x = table.new(position.middle_center,1,1,color.aqua)
table.cell_set_text(x,0,0,"Please select lower timeframes (Daily or lower)")
//~ !!!!!!!!!!!!!!!_________________ STOP _________________!!!!!!!!!!!!!!!!!!
//~ !!!!!!!!!!!!!!!!!!!!!!!!!!!!!!!!!!!!!!!!!!!!!!!!!!!!!!!!!!!!!!!!!!!!!!!!!!!
//~ ___________________________________________________________________________
// Global Dashboard Variables
// ░░░░░░░░░░░░░░░░░░░░░░░░░░░░░░░░░░░░░░░░░░░░░░░░░░░░░░░░░░░░░░░░░░░░░░░░░░░░░░░░░░░░░░░░░░░░░░░░░░░░░░░░░░░░░░░░░░░░░░░░░░░░░░░░░░░░░░░░░░░░░░░░░░
// Dashboard Table Text Size
i_tableTextSize = "Normal" //input.string(title="Dashboard Size", defval="Normal", options= , group="Dashboards")
table_text_size(s) =>
switch s
"Auto" => size.auto
"Huge" => size.huge
"Large" => size.large
"Normal" => size.normal
"Small" => size.small
=> size.tiny
tableTextSize = table_text_size(i_tableTextSize)
// Monthly Table Performance Dashboard By @QuantNomad
// ░░░░░░░░░░░░░░░░░░░░░░░░░░░░░░░░░░░░░░░░░░░░░░░░░░░░░░░░░░░░░░░░░░░░░░░░░░░░░░░░░░░░░░░░░░░░░░░░░░░░░░░░░░░░░░░░░░░░░░░░░░░░░░░░░░░░░░░░░░░░░░░░░░
i_showMonthlyPerformance = input.bool(false, 'Monthly Performance', group='Dashboards', inline="Show Dashboards")
i_monthlyReturnPercision = 2
if i_showMonthlyPerformance and tradeDateIsAllowed
new_month = month(time) != month(time )
new_year = year(time) != year(time )
eq = strategy.equity
bar_pnl = eq / eq - 1
cur_month_pnl = 0.0
cur_year_pnl = 0.0
// Current Monthly P&L;
cur_month_pnl := new_month ? 0.0 :
(1 + cur_month_pnl ) * (1 + bar_pnl) - 1
// Current Yearly P&L;
cur_year_pnl := new_year ? 0.0 :
(1 + cur_year_pnl ) * (1 + bar_pnl) - 1
// Arrays to store Yearly and Monthly P&Ls;
var month_pnl = array.new_float(0)
var month_time = array.new_int(0)
var year_pnl = array.new_float(0)
var year_time = array.new_int(0)
last_computed = false
if (not na(cur_month_pnl ) and (new_month or barstate.islastconfirmedhistory))
if (last_computed )
array.pop(month_pnl)
array.pop(month_time)
array.push(month_pnl , cur_month_pnl )
array.push(month_time, time )
if (not na(cur_year_pnl ) and (new_year or barstate.islastconfirmedhistory))
if (last_computed )
array.pop(year_pnl)
array.pop(year_time)
array.push(year_pnl , cur_year_pnl )
array.push(year_time, time )
last_computed := barstate.islastconfirmedhistory ? true : nz(last_computed )
// Monthly P&L; Table
var monthly_table = table(na)
if (barstate.islastconfirmedhistory)
monthly_table := table.new(position.bottom_right, columns = 14, rows = array.size(year_pnl) + 1, border_width = 1)
table.cell(monthly_table, 0, 0, "", bgcolor = #cccccc, text_size=tableTextSize)
table.cell(monthly_table, 1, 0, "Jan", bgcolor = #cccccc, text_size=tableTextSize)
table.cell(monthly_table, 2, 0, "Feb", bgcolor = #cccccc, text_size=tableTextSize)
table.cell(monthly_table, 3, 0, "Mar", bgcolor = #cccccc, text_size=tableTextSize)
table.cell(monthly_table, 4, 0, "Apr", bgcolor = #cccccc, text_size=tableTextSize)
table.cell(monthly_table, 5, 0, "May", bgcolor = #cccccc, text_size=tableTextSize)
table.cell(monthly_table, 6, 0, "Jun", bgcolor = #cccccc, text_size=tableTextSize)
table.cell(monthly_table, 7, 0, "Jul", bgcolor = #cccccc, text_size=tableTextSize)
table.cell(monthly_table, 8, 0, "Aug", bgcolor = #cccccc, text_size=tableTextSize)
table.cell(monthly_table, 9, 0, "Sep", bgcolor = #cccccc, text_size=tableTextSize)
table.cell(monthly_table, 10, 0, "Oct", bgcolor = #cccccc, text_size=tableTextSize)
table.cell(monthly_table, 11, 0, "Nov", bgcolor = #cccccc, text_size=tableTextSize)
table.cell(monthly_table, 12, 0, "Dec", bgcolor = #cccccc, text_size=tableTextSize)
table.cell(monthly_table, 13, 0, "Year", bgcolor = #999999, text_size=tableTextSize)
for yi = 0 to array.size(year_pnl) - 1
table.cell(monthly_table, 0, yi + 1, str.tostring(year(array.get(year_time, yi))), bgcolor = #cccccc, text_size=tableTextSize)
y_color = array.get(year_pnl, yi) > 0 ? color.new(color.teal, transp = 40) : color.new(color.gray, transp = 40)
table.cell(monthly_table, 13, yi + 1, str.tostring(math.round(array.get(year_pnl, yi) * 100, i_monthlyReturnPercision)), bgcolor = y_color, text_color=color.new(color.white, 0),text_size=tableTextSize)
for mi = 0 to array.size(month_time) - 1
m_row = year(array.get(month_time, mi)) - year(array.get(year_time, 0)) + 1
m_col = month(array.get(month_time, mi))
m_color = array.get(month_pnl, mi) > 0 ? color.new(color.teal, transp = 40) : color.new(color.maroon, transp = 40)
table.cell(monthly_table, m_col, m_row, str.tostring(math.round(array.get(month_pnl, mi) * 100, i_monthlyReturnPercision)), bgcolor = m_color, text_color=color.new(color.white, 0), text_size=tableTextSize)
hide = timeframe.isintraday
// Input for EMA period
emaPeriod = 48 //input.int(48, title="EMA Period")
emaPeriod2 = 2 //input.int(2, title="EME Period 2")
emaPeriod3 = 21 //input.int(21, title="EMA Period")
// Input to toggle EMA Cloud
showcloud = input.bool(false, title="Plot EMA?", group='EMA & ATR', inline="Show EMA's & ATR")
useHTF = input.bool(true, title = "Use Higher Time Frame?")
matimeframe = useHTF ? my_time1 : ''
// EMA calculations
ema = request.security(syminfo.tickerid, matimeframe, ta.ema(close, emaPeriod))
ema2 = request.security(syminfo.tickerid, matimeframe, ta.ema(close,emaPeriod2))
ema3 = request.security(syminfo.tickerid, matimeframe,ta.ema(close, emaPeriod3))
emaColor = close > ema3 ? color.new(color.rgb(56, 142, 60, 63), 50) : color.new(color.rgb(147, 40, 51, 38), 50)
// Plotting EMA's
// plot_ema1 = plot(hide ? ema : na, style=plot.style_line, color=color.new(color.rgb(255, 255, 255, 100), 50), title="EMA", linewidth=2)
// plot_ema2 = plot(hide ? ema2 : na, style=plot.style_line, color=color.new(color.rgb(255, 255, 255, 100), 50), title="EMA", linewidth=1)
// plot_ema3 = plot(ema3, style=plot.style_line, color=emaColor, title="EMA", linewidth=1)
// EMA Cloud
cloudColor = ema2 > ema ? color.new(#0f8513, 80) : color.new(#a81414, 80)
cloudColor2 = ema2 > ema3 ? color.new(#0f8513, 50) : color.new(#a81414, 50)
cloudColor := showcloud ? cloudColor : na
// fill(plot_ema1, plot_ema2, color=cloudColor, title="EMA Cloud")
// fill(plot_ema3, plot_ema2, color=cloudColor, title="EMA Cloud")
/////////////////////////////////////////////////////////////// © BackQuant ///////////////////////////////////////////////////////////////
// This Pine Script™ code is subject to the terms of the Mozilla Public License 2.0 at mozilla.org
// © BackQuant
import TradingView/ta/4 as ta
//@version=5
//indicator(
// title="DEMA Adjusted Average True Range ",
// shorttitle = "DEMA ATR ",
// overlay=true,
// timeframe="",
// timeframe_gaps=true
// )
// Define User Inputs
simple bool showAtr = input.bool(false, "Plot Dema?", group='EMA & ATR', inline="Show EMA's & ATR")
simple bool haCandles = true //input.bool(true, "Use HA Candles?")
simple int periodDema = 7 //input.int(7, "Dema Period", group = "Dema Atr")
series float sourceDema = close //input.source(close, "Calculation Source", group = "Dema Atr")
simple int periodAtr = 14 //input.int(14, "Period", group = "Dema Atr")
simple float factorAtr = 1.7 //input.float(1.7, "Factor", step = 0.01, group = "Dema Atr")
simple color longColour = #66bb6a
simple color shortColour = #f23645
/////////////////////////////////////////////////////////////// © BackQuant ///////////////////////////////////////////////////////////////
// Use HA Candles?
heikinashi_close = request.security(
symbol = ticker.heikinashi(syminfo.tickerid),
timeframe = timeframe.period,
expression = close,
gaps = barmerge.gaps_off,
lookahead = barmerge.lookahead_on
)
var series float source = close
if haCandles == true
source := heikinashi_close
if haCandles == false
source := sourceDema
/////////////////////////////////////////////////////////////// © BackQuant ///////////////////////////////////////////////////////////////
// Function
DemaAtrWithBands(periodDema, source, lookback, atrFactor)=>
ema1 = ta.ema(source, periodDema)
ema2 = ta.ema(ema1, periodDema)
demaOut = 2 * ema1 - ema2
atr = ta.atr(lookback)
trueRange = atr * atrFactor
DemaAtr = demaOut
DemaAtr := nz(DemaAtr , DemaAtr)
trueRangeUpper = demaOut + trueRange
trueRangeLower = demaOut - trueRange
if trueRangeLower > DemaAtr
DemaAtr := trueRangeLower
if trueRangeUpper < DemaAtr
DemaAtr := trueRangeUpper
DemaAtr
// Function Out
DemaAtr = DemaAtrWithBands(periodDema, source, periodAtr, factorAtr)
/////////////////////////////////////////////////////////////// © BackQuant ///////////////////////////////////////////////////////////////
// Conditions
DemaAtrLong = DemaAtr > DemaAtr
DemaAtrShort = DemaAtr < DemaAtr
// Colour Condtions
var color Trendcolor = #ffffff
if DemaAtrLong
Trendcolor := longColour
if DemaAtrShort
Trendcolor := shortColour
// Plotting
plot( showAtr ? DemaAtr : na, "ATR", color=Trendcolor, linewidth = 2 )
import DevLucem/ZigLib/1 as ZigZag
////////
// Fetch Ingredients
//
// ////////
// // Bake it with a simple oven this time
= ZigZag.zigzag(low, high, Depth, Deviation, Backstep)
string nowPoint = ""
var float lastPoint = z1.price
if bool(ta.change(direction))
lastPoint := z1.price
// ////////
// // Let it Cool And Serve
line zz = na
label point = na
if repaint
zz := line.new(z1, z2, xloc.bar_time, extend? extend.right: extend.none, color.new(direction>0? upcolor: dncolor, lines), width=line_thick)
nowPoint := direction<0? (z2.pricelastPoint? "HH": "LH")
point := label.new(z2, nowPoint, xloc.bar_time, yloc.price,
color.new(direction<0? upcolor: dncolor, labels), direction>0? label.style_label_down: label.style_label_up, color.new(direction>0? upcolor: dncolor, labels), label_size)
if direction == direction
line.delete(zz )
label.delete(point )
else
line.set_extend(zz , extend.none)
else
if direction != direction
zz := line.new(z1 , z2 , xloc.bar_time, extend.none, color.new(direction>0? upcolor: dncolor, lines), width=line_thick)
nowPoint := direction <0? (z2.price lastPoint ? "HH": "LH")
point := label.new(z2 , nowPoint, xloc.bar_time, yloc.price,
color.new(direction <0? upcolor: dncolor, labels), direction >0? label.style_label_down: label.style_label_up, color.new(direction >0? upcolor: dncolor, labels), label_size)
bgcolor(direction<0? color.new(dncolor, background): color.new(upcolor, background), title='Direction Background', display = display.none)
plotarrow(direction, "direction", display=display.status_line)
// ////////
// // Declare Meal Was Sweet By Force
alertcondition(nowPoint == "HH" and z2.price != z2.price , "New Higher High", 'Zigzag on {{ticker}} higher higher high detected at {{time}}')
alertcondition(nowPoint == "LH" and z2.price != z2.price , "New Lower High", 'Zigzag on {{ticker}} higher lower high detected at {{time}}')
alertcondition(nowPoint == "HL" and z2.price != z2.price , "New Higher Low", 'Zigzag on {{ticker}} higher lower low detected at {{time}}')
alertcondition(nowPoint == "LL" and z2.price != z2.price , "New Lower Low", 'Zigzag on {{ticker}} lower low detected at {{time}}')
alertcondition(direction != direction , 'Direction Changed', 'Zigzag on {{ticker}} direction changed at {{time}}')
alertcondition(direction != direction and direction>0, 'Bullish Direction', 'Zigzag on {{ticker}} bullish direction at {{time}}')
alertcondition(direction != direction and direction<0, 'Bearish Direction', 'Zigzag on {{ticker}} bearish direction at {{time}}')
if direction != direction
alert((direction<0? "Bearish": "Bullish") + " Direction Final ", alert.freq_once_per_bar_close)
MSG = "MARKET STRUCTURE"
VBG = "VOLUMETRIC ORDER BLOCKS"
MST = "Limit market structure calculation to improve memory speed time"
SLT = " Limit swing structure to tot bars back"
IDT = " Start date of the internal structure"
CST = "Color candle based on trend detection system"
OBT = "Display internal buy and sell activity"
OBD = "Show Last number of orderblock"
OBMT = " Use Length to adjust cordinate of the orderblocks\n Use whole candle body"
_ ='
------------
–––––––––––––––––––––––––– INPUTS –––––––––––––––––––––––––––
------------ '//{
bool windowsis = input.bool(true, "Window", inline="kla", group=MSG)
int mswindow = input.int(5000, "", tooltip=MST,group=MSG, inline="kla", minval=1000)
bool showSwing = input.bool(true, "Swing", inline="scss", group=MSG)
int swingLimit = input.int(100, "", tooltip=SLT, inline="scss", group=MSG, minval=10, maxval=200)
color swingcssup = input.color(#f7525f, "", inline="scss", group=MSG)
color swingcssdn = input.color(#66bb6a, "", inline="scss", group=MSG)
bool showMapping = input.bool(false, "Mapping Structure", inline="mapping", group=MSG)
string mappingStyle = input.string("----", "", options= , inline="mapping", group=MSG)
color mappingcss = input.color(color.silver, "", tooltip="Display Mapping Structure", inline="mapping", group=MSG)
bool candlecss = input.bool(false, "Color Candles", tooltip=CST, group=MSG, inline="txt")
string mstext = input.string("Tiny", "", options= ,
inline="txt", group=MSG)
string msmode = input.string("Adjusted Points", "Algorithmic Logic", options=
, inline="node", group=MSG)
int mslen = input.int(5, "", inline="node", group=MSG, minval=2)
bool buildsweep = input.bool(true, "Build Sweep (x)", "Build sweep on market structure", "znc", MSG)
bool msbubble = input.bool(true, "Bubbles", tooltip="Display Circle Bubbles", inline="bubbles", group=MSG)
bool obshow = input.bool(true, "Show Last", tooltip=OBD, group=VBG, inline="obshow")
int oblast = input.int(5, "", group=VBG, inline="obshow", minval=0)
color obupcs = input.color(color.new(#089981, 90), "", inline="obshow", group=VBG)
color obdncs = input.color(color.new(#f23645, 90), "", inline="obshow", group=VBG)
bool obshowactivity = input.bool(true, "Show Buy/Sell Activity", inline="act", group=VBG, tooltip=OBT)
color obactup = input.color(color.new(#089981, 50), "", inline="act", group=VBG)
color obactdn = input.color(color.new(#f23645, 50), "", inline="act", group=VBG)
obshowbb = input.bool(false, "Show Breakers", inline="bb", group=VBG, tooltip="Display Breakers")
color bbup = input.color(color.new(#089981, 100), "", inline="bb", group=VBG)
color bbdn = input.color(color.new(#f23645, 100), "", inline="bb", group=VBG)
obmode = input.string("Length", "Construction", options= , tooltip=OBMT, inline="atr", group=VBG)
len = input.int(5, "", inline="atr", group=VBG, minval=1)
obmiti = input.string("Close", "Mitigation Method", options= ,
tooltip="Mitigation method for when to trigger order blocks", group=VBG)
obtxt = input.string("Normal", "Metric Size", options= ,
tooltip="Order block Metrics text size", inline="txt", group=VBG)
showmetric = input.bool(true, "Show Metrics", group=VBG)
showline = input.bool(true, "Show Mid-Line", group=VBG)
overlap = input.bool(true, "Hide Overlap", group=VBG, inline="ov")
wichlap = input.string("Recent", "", options= , inline="ov", group=VBG)
fvg_enable = input.bool(false, "", inline="1", group="FAIR VALUE GAP", tooltip="Display fair value gap")
what_fvg = input.string("FVG", "", inline="1", group="FAIR VALUE GAP", tooltip="Display fair value gap",
options= )
fvg_num = input.int(5, "Show Last", inline="1a", group="FAIR VALUE GAP", tooltip="Number of fvg to show", minval=0)
fvg_upcss = input.color(color.new(#089981, 80), "", inline="1", group="FAIR VALUE GAP")
fvg_dncss = input.color(color.new(#f23645, 80), "", inline="1", group="FAIR VALUE GAP")
fvgbbup = input.color(color.new(#089981, 100), "", inline="1", group="FAIR VALUE GAP")
fvgbbdn = input.color(color.new(#f23645, 100), "", inline="1", group="FAIR VALUE GAP")
fvg_src = input.string("Close", "Mitigation",
inline="3",
group="FAIR VALUE GAP",
tooltip=" Use the close of the body as trigger\n\n Use the extreme point of the body as trigger",
options= )
fvgthresh = input.float(0, "Threshold", tooltip="Filter out non significative FVG", group="FAIR VALUE GAP",
inline="asd", minval=0, maxval=2, step=0.1)
fvgoverlap = input.bool(true, "Hide Overlap", "Hide overlapping FVG", group="FAIR VALUE GAP")
fvgline = input.bool(true, "Show Mid-Line", group="FAIR VALUE GAP")
fvgextend = input.bool(false, "Extend FVG", group="FAIR VALUE GAP")
dispraid = input.bool(false, "Display Raids", inline="raid", group="FAIR VALUE GAP")
//}
_ ='
------------
–––––––––––––––––––––––––– UDT –––––––––––––––––––––––––––
------------ '//{
type hqlzone
box pbx
box ebx
box lbx
label plb
label elb
label lbl
type Zphl
line top
line bottom
label top_label
label bottom_label
bool stopcross
bool sbottomcross
bool itopcross
bool ibottomcross
string txtup
string txtdn
float topy
float bottomy
float topx
float bottomx
float tup
float tdn
int tupx
int tdnx
float itopy
float itopx
float ibottomy
float ibottomx
float uV
float dV
type entered
bool normal = false
bool breaker = false
type store
line ln
label lb
box bx
linefill lf
type structure
int zn
float zz
float bos
float choch
int loc
int temp
int trend
int start
float main
int xloc
bool upsweep
bool dnsweep
string txt = na
type drawms
int x1
int x2
float y
string txt
color css
string style
type ob
bool bull
float top
float btm
float avg
int loc
color css
float vol
int dir
int move
int blPOS
int brPOS
int xlocbl
int xlocbr
bool isbb = false
int bbloc
type FVG
float top = na
float btm = na
int loc = bar_index
bool isbb = false
int bbloc = na
bool israid = false
float raidy = na
int raidloc = na
int raidx2 = na
bool active = false
color raidcs = na
type SFP
float y
int loc
float ancor
type sfpbuildlbl
int x
float y
string style
color css
string txt
type sfpbuildline
int x1
int x2
float y
color css
float ancor
int loc
type equalbuild
int x1
float y1
int x2
float y2
color css
string style
type equalname
int x
float y
string txt
color css
string style
type ehl
float pt
int t
float pb
int b
type sellbuyside
float top
float btm
int loc
color css
string txt
float vol
type timer
bool start = false
int count = 0
//}
_ ='
------------
–––––––––––––––––––––––––– SETUP –––––––––––––––––––––––––––
------------ '//{
var store bin = store.new(
array.new< line >()
, array.new< label >()
, array.new< box >()
, array.new()
)
var entered blobenter = entered.new()
var entered brobenter = entered.new()
var entered blfvgenter = entered.new()
var entered brfvgenter = entered.new()
var entered blarea = entered.new()
var entered brarea = entered.new()
var timer lc = timer.new ()
if barstate.islast
for obj in bin.ln
obj.delete()
for obj in bin.lb
obj.delete()
for obj in bin.bx
obj.delete()
for obj in bin.lf
obj.delete()
bin.ln.clear()
bin.lb.clear()
bin.bx.clear()
bin.lf.clear()
invcol = #ffffff00
float atr = (ta.atr(200) / (5/len))
//}
_ ='
------------
–––––––––––––––––––––––––– UTILITY –––––––––––––––––––––––––––
------------ '//{
method txSz(string s) =>
out = switch s
"Tiny" => size.tiny
"Small" => size.small
"Normal" => size.normal
"Large" => size.large
"Huge" => size.huge
"Auto" => size.auto
out
method lstyle(string style) =>
out = switch style
'⎯⎯⎯⎯' => line.style_solid
'----' => line.style_dashed
'····' => line.style_dotted
ghl() => [high , low , close , open , close, open, high, low, high , low , ta.atr(200)]
method IDMIDX(bool use_max, int loc) =>
min = 99999999.
max = 0.
idx = 0
if use_max
for i = 0 to (bar_index - loc)
max := math.max(high , max)
min := max == high ? low : min
idx := max == high ? i : idx
else
for i = 0 to (bar_index - loc)
min := math.min(low , min)
max := min == low ? high : max
idx := min == low ? i : idx
idx
SFPData() => [high, high , high , low, low , low , close, volume, time, bar_index , time ]
SFPcords() =>
RealTF = barstate.isrealtime ? 0 : 1
= SFPData()
[h , h1 , h2 , l , l1 , l2 , c , v , t , n , t1 ]
method find(structure ms, bool use_max, bool sweep, bool useob) =>
min = 99999999.
max = 0.
idx = 0
if not sweep
if ((bar_index - ms.loc) - 1) > 0
if use_max
for i = 0 to (bar_index - ms.loc) - 1
max := math.max(high , max)
min := max == high ? low : min
idx := max == high ? i : idx
if useob
if high

JSONWebhooksLibrary "JSONWebhooks"
TODO: add library description here
method buildWebhookJson(msg, constants)
Builds the final JSON payload from a webhookMessage type.
Namespace types: webhookMessage
Parameters:
msg (webhookMessage) : (webhookMessage) A prepared webhookMessage.
constants (CONSTANTS)
Returns: A JSON Payload.
method buildTakeProfitJson(msg)
Builds the takeProfit JSON message to be used in a webhook message.
Namespace types: takeProfitMessage
Parameters:
msg (takeProfitMessage) : (takeProfitMessage)
Returns: A JSON takeProfit payload.
method buildStopLossJson(msg, constants)
Builds the stopLoss JSON message to be used in a webhook message.
Namespace types: stopLossMessage
Parameters:
msg (stopLossMessage) : (stopLossMessage)
constants (CONSTANTS)
Returns: A JSON stopLoss payload.
CONSTANTS
Constants for payload values.
Fields:
ACTION_BUY (series string)
ACTION_SELL (series string)
ACTION_EXIT (series string)
ACTION_CANCEL (series string)
ACTION_ADD (series string)
SENTIMENT_BULLISH (series string)
SENTIMENT_BEARISH (series string)
SENTIMENT_LONG (series string)
SENTIMENT_SHORT (series string)
SENTIMENT_FLAT (series string)
STOP_LOSS_TYPE_STOP (series string)
STOP_LOSS_TYPE_STOP_LIMIT (series string)
STOP_LOSS_TYPE_TRAILING_STOP (series string)
webhookMessage
Final webhook message.
Fields:
ticker (series string)
action (series string)
sentiment (series string)
price (series float)
quantity (series float)
takeProfit (series string)
stopLoss (series float)
takeProfitMessage
Take profit message.
Fields:
limitPrice (series float)
percent (series float)
amount (series float)
stopLossMessage
Stop loss message.
Fields:
type (series string)
percent (series float)
amount (series float)
stopPrice (series float)
limitPrice (series float)
trailPrice (series float)
trailPercent (series float)

TradersPost WebhookMessage Library - Automatically Build JSONLibrary "WebhookMessageLibrary"
The webhook message library provides several functions for building JSON payloads
method buildWebhookJson(msg, constants)
Builds the final JSON payload from a webhookMessage type.
Namespace types: webhookMessage
Parameters:
msg (webhookMessage) : (webhookMessage) A prepared webhookMessage.
constants (CONSTANTS)
Returns: A JSON Payload.
method buildTakeProfitJson(msg)
Builds the takeProfit JSON message to be used in a webhook message.
Namespace types: takeProfitMessage
Parameters:
msg (takeProfitMessage) : (takeProfitMessage)
Returns: A JSON takeProfit payload.
method buildStopLossJson(msg, constants)
Builds the stopLoss JSON message to be used in a webhook message.
Namespace types: stopLossMessage
Parameters:
msg (stopLossMessage) : (stopLossMessage)
constants (CONSTANTS)
Returns: A JSON stopLoss payload.
CONSTANTS
Constants for payload values.
Fields:
ACTION_BUY (series string)
ACTION_SELL (series string)
ACTION_EXIT (series string)
ACTION_CANCEL (series string)
ACTION_ADD (series string)
SENTIMENT_BULLISH (series string)
SENTIMENT_BEARISH (series string)
SENTIMENT_LONG (series string)
SENTIMENT_SHORT (series string)
SENTIMENT_FLAT (series string)
STOP_LOSS_TYPE_STOP (series string)
STOP_LOSS_TYPE_STOP_LIMIT (series string)
STOP_LOSS_TYPE_TRAILING_STOP (series string)
webhookMessage
Final webhook message.
Fields:
ticker (series string)
action (series string)
sentiment (series string)
price (series float)
quantity (series int)
takeProfit (series string)
stopLoss (series string)
takeProfitMessage
Take profit message.
Fields:
limitPrice (series float)
percent (series float)
amount (series float)
stopLossMessage
Stop loss message.
Fields:
type (series string)
percent (series float)
amount (series float)
stopPrice (series float)
limitPrice (series float)
trailPrice (series float)
trailPercent (series float)