Search in scripts for "Volume"
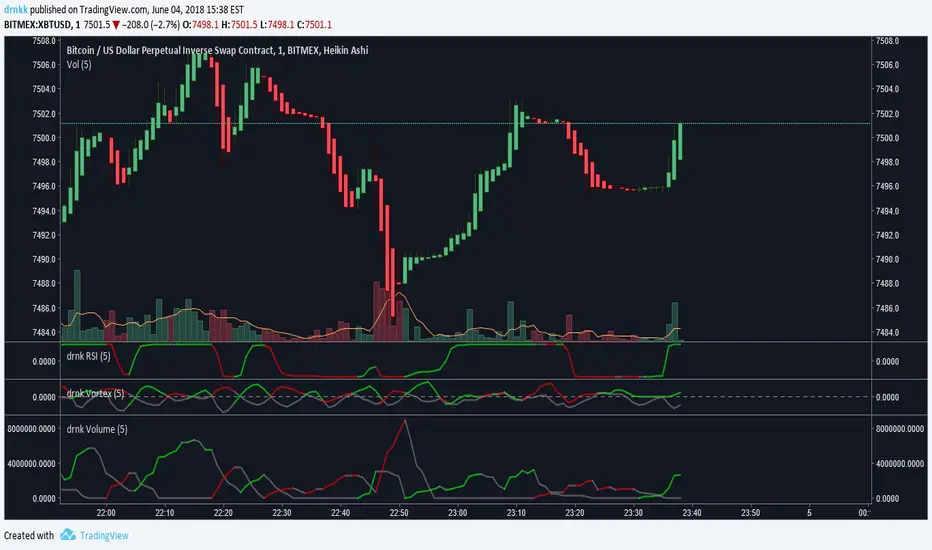
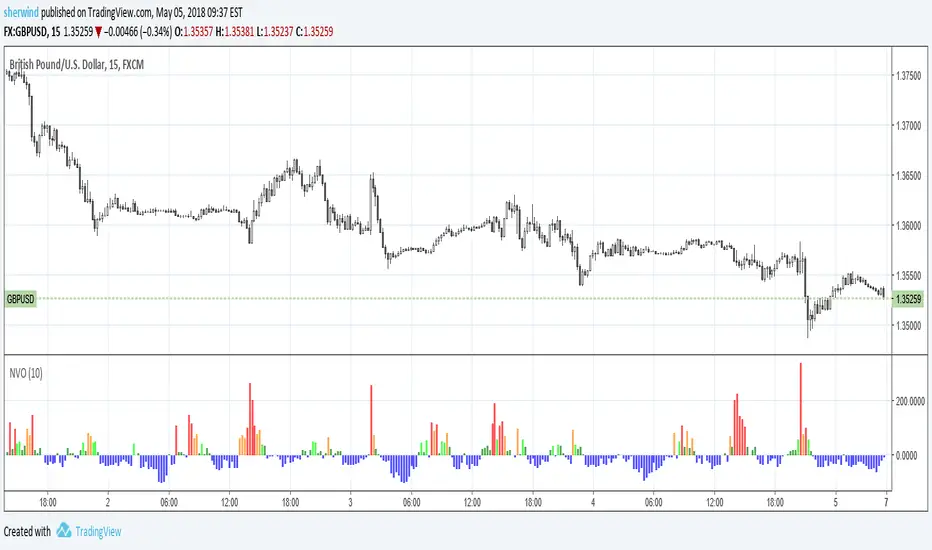
Normalized Volume OscillatorThis volume indicator works best on comparatively small timeframes (15 minutes, for example).
Based on:
- Normalized Volume Oscillator - indicator for MetaTrader 4
- Using Tick Volume in Forex: A Clear NVO Based Example
See also:
- Are price updates a good proxy for actual traded volume in FX?
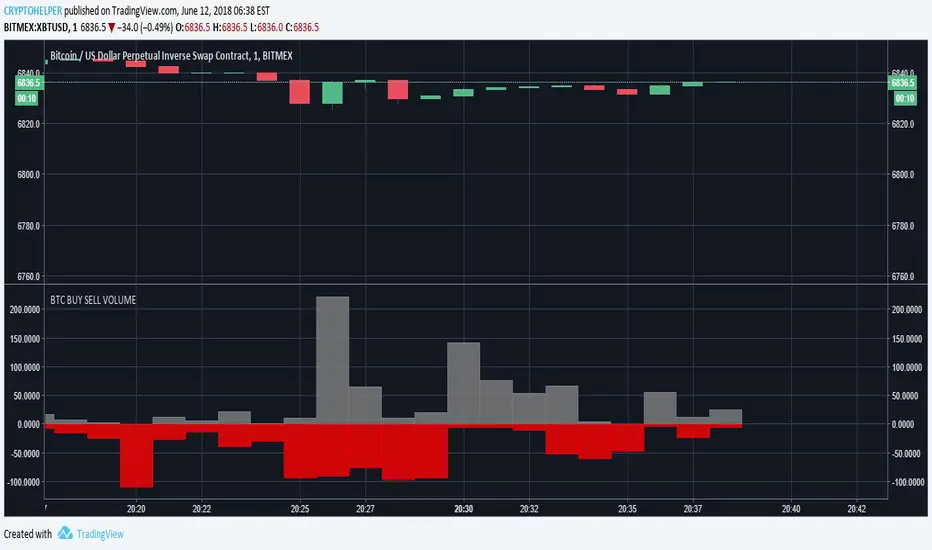
Don.A non-magin volume for cryptoIncludes margin positions volume from bitfinex and non-margin volume


Aggregated BTC Exchange VolumeAggregated raw volume from 7 exchanges:
Bitfinex
Binance
Bitstamp
Kraken
Coinbase
bitFlyer
Bithumb


Aggregate BTC Volume for VSAIt adds volume from most popular BTC/USD exchanges to reduce the noise in data.

BTC Volume IndexBTC volume index for all BFX, GDAX, Stamp, Kraken, and Bitflyer. Also includes an overlay of the volume of the underlying asset (assumed to be BTC at whichever exchange you're viewing.
Happii Trades


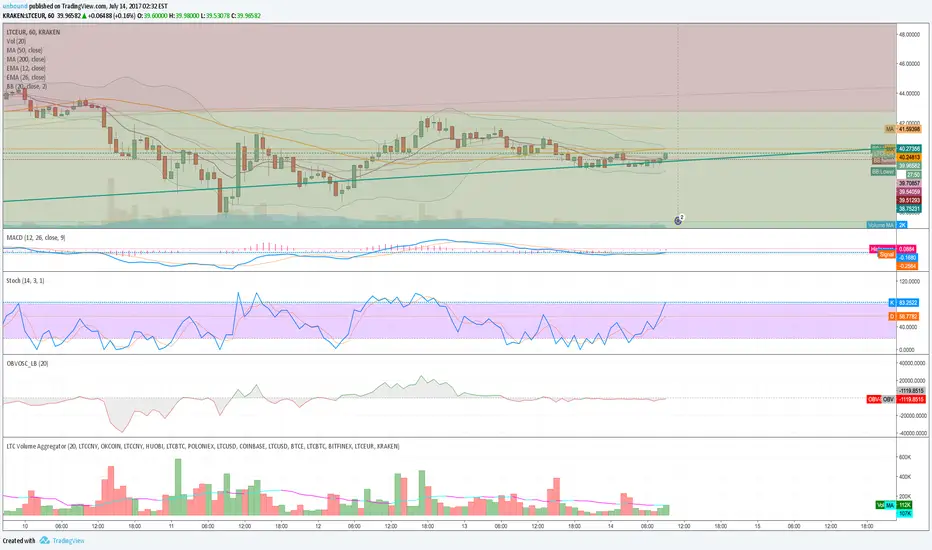
LTC Volume AggregatorThis script aggregates LTC volume from 7 major (with highest trading volume) LTC tickers available on tradingview.
Enhanced Volume Order Flow ImbalanceThe Enhanced Volume Order Flow Imbalance (E-VOFI) indicator provides insights into market sentiment by analyzing volume imbalances between bullish and bearish price movements. By identifying the relative strength of buying versus selling activity, this indicator helps traders understand the underlying momentum of price movements.
Key Features:
Volume Imbalance: The indicator calculates the imbalance between the volume of bullish bars (upward price movement) and bearish bars (downward price movement). A positive value indicates stronger buying pressure, while a negative value indicates stronger selling pressure.
Smoothed Imbalance: A smoothed version of the imbalance is plotted as a line, helping traders identify longer-term trends in market sentiment.
Color-Coding: The imbalance is displayed as a histogram with green bars representing bullish dominance and red bars representing bearish dominance.
Zero Line: The indicator includes a zero line for reference, making it easier to visualize when market sentiment is neutral or tilted in one direction.
Inputs:
Lookback Period: The number of bars used to calculate the moving averages of bullish and bearish volume (default: 14).
Strong Imbalance Threshold: A threshold to define a strong imbalance. This option has been removed from the script in the latest version, simplifying the display to only show the imbalance histogram and the smoothed line.
Usage:
The E-VOFI indicator can help traders assess the strength of buying or selling pressure in the market. By observing the imbalance histogram, traders can make more informed decisions about market trends and potential reversals. The smoothed imbalance line provides a clearer view of longer-term trends, helping to filter out short-term noise.

Key Historical Volume Bar on Price ChartThis is a unique indicator of volumne bar of price charts.
1. Show Highest Volume Ever(E)
2. Show Rolling Highest Volume Yearly(Y)
3. Show Rolling Highest Volume Quarterly(Q)
4. Show Lowest Volume Ever(e)
5. Show Rolling Lowest Volume Yearly(y)
6. Show Rolling Lowest Volume Quarterly(q)
You can toggle each of the 6 indicator on bar.
This indicator will only work on daily and weekly timeframe.
Also you can configure few settings like
Highlight Price bar only when stock is rising
No. of trading days In a Year
No. of trading days in a Quarter
No of trading days vary country to country, please set them up as per your country.

NIFTY IT volumeKEY TAKEAWAYS
-Uses NIFTY IT Index Stocks Volume .
-NIFTY IT Volume Indicator is created by adding all 10 NIFTY IT Stocks Volume together.
-NIFTY IT Volume will be an important indicator in NIFTY IT Index technical analysis because it is used to measure the relative significance of a market move.
-The higher the volume during a NIFTY IT index price move, the more significant the move and the lower the volume during a NIFTY IT index price move, the less significant the move.
-Moving Average is also added.

Sumon Pal Volume Osc
This is a volume oscillator calculated by the volume action on each bar price movement over a period of time.
When the short term volume(green line) is above the long term volume line(red)it indicates volume is coming and buying pressure may be observed.
Similarly when the short term volume is below the long term, volume is getting liquidated and selling pressure may be observed.
This indicator alone can't be used for buying or selling decision. This indicator can be used along with price action break out or break down level to get an idea whether volume is supporting the break out/down or not.
Disclaimer: Backtest this indicator with price action over a period of time and understand how it works before taking any trading decision. Trading in equity is always risky. Asses your risk profile and trade by managing proper risk.
Average Volume at Time (AVAT)Calculation of average volume at current time for a number of previous sessions, known as Average Volume at Time (AVAT).
Inputs:
* period to use for accumulation. "D" is the default value, useful to view data for each session.
* number of previous sessions to average
TODO: more intelligent accumulation of number of bars in a session, since there may be sessions with different values
TODO: interpolate volume according to current time, inside of the last bar

EGX30 Volume BY Sherif RaoufThe indicator can read volume for EGX30 with any time frame ( 10,15,30 mins ... etc. )

Price weighted volumeSimple script that displays volume relative to current price to mitigate the seemingly declining volume over time as prices increase.
Cumulative Volume v3The script, for Pine Script version 3, shows how to accumulate volume values during a defined session/period.
The input is the period to use for accumulation. "D" is the default value, useful to view data for each session.
This is slower than version 4 because there is no "var" and you need to use a loop. Also, you can't use "sum( volume , cnt_new_day)" with a variable length argument instead of "for".

Cumulative VolumeThe script shows how to accumulate volume values during a defined session/period.
The input is the period to use for accumulation. "D" is the default value, useful to view data for each session.
