Intellect TBTS V02 [Strategy]📌 Intellect V01 TBO – Trend Breakout Options Strategy
Intellect V01 TBO is an intraday trend-breakout strategy designed for index traders who follow Nifty, BankNifty, and FinNifty.
It identifies trend shifts using structural pivots, adaptive trendlines, and volatility-adjusted breakout zones.
The strategy provides automatic Long/Short signals, optional stop-loss and target projections, and allows users to generate alert messages that include index-option strike information.
🔍 How the Strategy Works
1. Pivot-Based Structure
The script identifies short-term high and low pivots using a user-defined period.
These pivots become anchor points for constructing directional trendlines.
2. Dynamic Trendline Projection
For each pivot, the script builds:
A projected trendline
Two offset lines above/below
A volatility band based on ATR
These help detect potential breakout zones.
3. Breakout Signal Logic
A trade signal is generated when price crosses the projected trendline:
Long Signal – detected when price breaks above a pivot-derived trendline.
Short Signal – detected when price breaks below a pivot-derived trendline.
Users may optionally restrict entries to a specific time window.
🎯 Stop-Loss & Target Zones
When a trade is active:
SL and TP levels are set using ATR-based volatility distance
Levels appear visually on the chart if enabled
Exits occur automatically when TP/SL is hit
The strategy also closes open trades near the end of the session (default 3:10 PM)
These levels are for visual and backtesting support only.
📝 Index Option Strike Calculation (For Alert Text Only)
The strategy can dynamically compute:
ATM strike (with optional bias)
Correct expiry day for Nifty (weekly) and BankNifty/FinNifty (monthly Tuesday)
CE strike for Long signals
PE strike for Short signals
This strike information is only included in alert text for users who configure external automation.
It does not affect backtesting results inside TradingView.
⏱️ Time Window Filter (Optional)
Users may define:
Start time
End time
Outside this window, no new trades are generated.
🎛️ User Adjustable Inputs
Pivot lookback period
Trendline style and extension
Display of target/stop-loss
Expiry selection mode
Strike-bias
Lot size (for alert formatting only)
Time filter settings
🔔 Alert Messages
Alerts include:
Direction (Long/Short)
Strike details
Option type (CE/PE)
Quantity
A formatted JSON message
TradingView does not execute these orders.
Users are responsible for managing external automation independently.
⚠️ Important Notes
This script does not integrate with any broker by default.
It does not place trades automatically; alerts only send text.
Backtests simulate index movement, not live option pricing.
We recommend using realistic slippage and commission settings.
✔️ This strategy is intended for educational and analytical use. Adjust settings as needed.
✅ 2. CLEAN CHART BEFORE PUBLISHING
To avoid moderator flags:
Do This Before Publishing:
✔ Remove all manual drawings
✔ Hide any other indicators on the chart
✔ Use light or clean background
✔ Keep only signals/SL/TP from your script
If you leave extra drawings, moderators may hide the script again.
✅ 3. FINAL PUBLISHING CHECKLIST
Before you click Publish, verify:
✔ Description matches the one above
✔ No broker names anywhere
✔ No "algo trading" or "automation" advertising
✔ Backtest settings are realistic
Commission enabled
Slippage > 1
Reasonable lot assumption
✔ Chart is clean
✔ Script is set to “Strategy” and compiles without warnings
Search in scripts for "algo"

Moving Average Band StrategyOverview
The Moving Average Band Strategy is a fully customizable breakout and trend-continuation system designed for traders who need both simplicity and control.
The strategy creates adaptive bands around a user-selected moving average and executes trades when price breaks out of these bands, with advanced risk-management settings including optional Risk:Reward targets.
This script is suitable for intraday, swing, and positional traders across all markets — equities, futures, crypto, and forex.
Key Features
✔ Six Moving Average Types
Choose the MA that best matches your trading style:
SMA
EMA
WMA
HMA
VWMA
RMA
✔ Dynamic Bands
Upper Band built from MA of highs
Lower Band built from MA of lows
Adjustable band offset (%)
Color-coded band fill indicating price position
✔ Configurable Strategy Preferences
Toggle Long and/or Short trades
Toggle Risk:Reward Take-Profit
Adjustable Risk:Reward Ratio
Default position sizing: % of equity (configurable via strategy settings)
Entry Conditions
Long Entry
A long trade triggers when:
Price crosses above the Upper Band
Long trades are enabled
No existing long position is active
Short Entry
A short trade triggers when:
Price crosses below the Lower Band
Short trades are enabled
No existing short position is active
Clear entry markers and price labels appear on the chart.
Risk Management
This strategy includes a complete set of risk-controls:
Stop-Loss (Fixed at Entry)
Long SL: Lower Band
Short SL: Upper Band
These levels remain constant for the entire trade.
Optional Risk:Reward Take-Profit
Enabled/disabled using a toggle switch.
When enabled:
Long TP = Entry + (Risk × Risk:Reward Ratio)
Short TP = Entry – (Risk × Risk:Reward Ratio)
When disabled:
Exits are handled by reverse crossover signals.
Exit Conditions
Long Exit
Stop-Loss Hit (touch-based)
Take-Profit Hit (if enabled)
Reverse Band Crossover (if TP disabled)
Short Exit
Stop-Loss Hit (touch-based)
Take-Profit Hit (if enabled)
Reverse Band Crossover (if TP disabled)
Exit markers and price labels are plotted automatically.
Visual Tools
To improve clarity:
Upper & Lower Band (blue, adjustable width)
Middle Line
Dynamic band fill (green/red/yellow)
SL & TP line plotting when in position
Entry/Exit markers
Price labels for all executed trades
These are built to help users visually follow the strategy logic.
Alerts Included
Every trading event is covered:
Long Entry
Short Entry
Long SL / TP / Cross Exit
Short SL / TP / Cross Exit
Combined Alert for webhook/automation (JSON-formatted)
Perfect for algo trading, Discord bots, or automation platforms.
Best For
This strategy performs best in:
Trending markets
Breakout environments
High-momentum instruments
Clean intraday swings
Works seamlessly on:
Stocks
Index futures
Commodities
Crypto
Forex
⚠️ Important Disclaimer
This script is for educational purposes only.
Trading involves risk. Backtest results are not indicative of future performance.
Always validate settings and use proper position sizing.

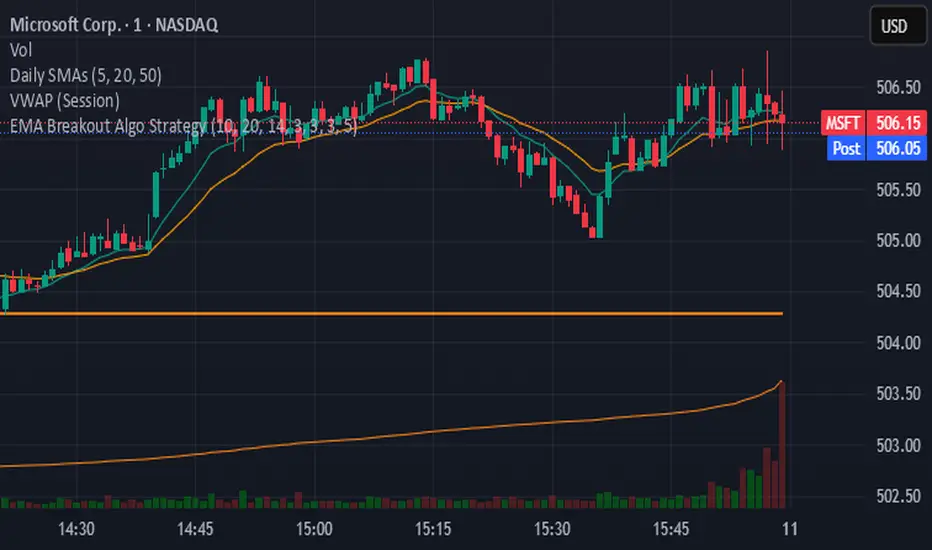
EMA Breakout Algo StrategyA volatility‑based breakout strategy using EMA alignment and ATR filters for risk‑managed entries and exits.
Real-Time EMA Cross Strategy For Fast Scalping📊 Overview
A professional-grade EMA crossover strategy with real-time execution capabilities. Designed for traders who need instant signal execution and seamless position management, this strategy adapts to any trading style with fully customizable EMA periods.
⚡ Core Features
Instant Execution Technology: Enter/exit positions immediately when signals occur
Seamless Position Switching: Automatically reverses positions without gaps or delays
Customizable EMA Periods: Adapt to any market or timeframe with adjustable settings
Real-Time & Bar-Close Modes: Choose your execution preference
Smart Position Management: No overlapping positions, clean entries and exits
Professional Dashboard: Live monitoring of indicators and position status
🎯 Ideal For
Scalpers requiring instant execution
Day traders seeking responsive strategies
Swing traders who need reliable crossover signals
Anyone looking for a clean, professional trading system
💎 What Makes This Special
No Lag: Real-time mode executes trades the moment crossover occurs
Clean Code: Optimized Pine Script v5 with best practices
Visual Clarity: Color-coded zones, clear signal markers, and info panel
Flexibility: Works across all timeframes and markets
Professional Grade: Includes proper position sizing and risk management
📈 How It Works
Long Signal: Fast EMA crosses above Slow EMA
Short Signal: Fast EMA crosses below Slow EMA
Position Management: Automatic reversal on opposite signals
Execution Options: Choose between instant or bar-close execution
⚙️ Customization
Adjust both EMA periods to match your strategy (2/5, 4/9, 9/21, 12/26, etc.)
Toggle real-time execution on/off
Full control over position sizing
Customizable visual elements
🔔 Built-in Alerts
Long entry signals
Short entry signals
Position reversal notifications
📝 Tips for Best Results
Lower timeframes (1-15min) for scalping with fast EMAs
Higher timeframes (1H-4H) for swing trading with slower EMAs
Test different EMA combinations to find your edge
Always use proper risk management
🚀 Version 3 Improvements
Enhanced crossover detection algorithm
Improved real-time execution logic
Better position management
Cleaner visual interface
More reliable signal generation

Empire OS Trading Fully Automated Prop Firm Ready💎 Prop-Firm-Ready Momentum System v3 — The Gold-Mine Algorithm 💎
Engineered for the same standards that top prop firms demand — minimal drawdown, consistent equity growth, and precision-based execution. This isn’t a basic indicator; it’s a refined momentum engine built for traders who scale capital and manage risk like professionals.
Performance Snapshot
• Profit Factor 2.26 • Win Rate 33 % • Max Drawdown 0.9 % • Total P/L + $447 • W/L Ratio 4.6 : 1
Stress-tested on Gold (XAUUSD) across live-market conditions, it stays composed under volatility and delivers structured, data-driven consistency.
⚡ See it. Test it. Scale it.
Built for prop-firm precision — from $10 K to $300 K and beyond.

[Aegis]Original Turtle System for CryptoAs Richard Dennis once said, "Even if I published all the Turtle rules in the newspaper right now, no one would be able to 'execute' them," and 40 years later, even in modern financial markets (like the crypto market) where all the conditions have been disclosed, this strategy continues to deliver amazing performance. The following outlines the original Turtle rules as disclosed by Curtis Faith in his book *Way of the Turtle*, and a TradingView algorithm that translates these rules for application in the crypto market.
---
### **The Original Turtle Trading Rules**
#### **1. Markets**
* Trade in liquid futures markets.
#### **2. Position Sizing**
The volatility measure, **N**, is used as the basis for all calculations.
**True Range (TR) Calculation:** Select the largest of the following three values:
* Current High - Current Low
* $|\text{Current High} - \text{Previous Close}|$ (Absolute Value)
* $|\text{Current Low} - \text{Previous Close}|$ (Absolute Value)
**N (Average True Range, ATR) Calculation:**
$$N = \frac{(19 \times \text{PDN} + \text{TR})}{20}$$
* **PDN:** Previous Day's N value
* **TR:** Current True Range
This is similar to a 20-day Exponential Moving Average, and is sometimes calculated using a Simple Moving Average.
**Unit Size Calculation:**
$$\text{Unit Size (Number of Contracts)} = \frac{1\% \text{ of Account Equity}}{(\text{N} \times \text{Dollars per Point})}$$
* **Dollars per Point (Tick Value):** The value of a 1-point change in price.
#### **3. Entries**
* **Entry:** Buy when the 55-day high is broken to the upside, and sell when the 55-day low is broken to the downside.
#### **5. Stops**
* The stop-loss for every unit is set at a price **2N** unfavorable from the entry price.
* For each additional unit added, the stop price for the **entire position** is adjusted favorably by **1/2 N**.
* In other words, the stop price of the last unit entered becomes the stop price for the entire position.
#### **6. Exits**
The exit rule for profitable positions (before a stop is hit) is as follows:
* **Long Positions:** Exit when the 20-day low is broken to the downside.
* **Short Positions:** Exit when the 20-day high is broken to the upside.
*Note: This exit rule is followed only if the price has moved up by a value greater than or equal to the N value multiplied by the criterion for changing the take-profit line (the original Korean text mentions a condition based on N, which is commonly interpreted as requiring a profit before applying the channel exit).*
리처드 데니스가 앞서 "내가 지금 당장 터틀의 모든 규칙을 신문에 공표한다고 해도 아무도 '실행'하지 못할 것"라고 말했듯 40년이 흘러 모든 조건이 공개된 현대 금융시장(크립토 시장)에서도 여전히 이 전략은 놀라운 퍼포먼스를 기록하고 있습니다. 아래는 커티스 페이스가 자신의 저서 '터틀의 방식'에 공개한 오리지널 터틀 규칙과 이를 알고리즘으로 변환하여 크립토마켓에 적용한 트레이딩뷰 알고리즘 입니다.
##### 1. 시장 (Markets)
• 유동성이 풍부한 선물 시장에서 거래한다.
##### 2. 포지션 크기 (Position Sizing)
변동성 측정 단위인 N을 모든 계산의 기초로 사용한다.
**True Range (TR) 계산:** 다음 세 가지 값 중 가장 큰 값을 선택한다.
- • 현재 고가 - 현재 저가
- • |현재 고가 - 전일 종가| (절대값)
- • |현재 저가 - 전일 종가| (절대값)
**N (Average True Range, ATR) 계산:**
N = (19 × PDN + TR) / 20
- • PDN: 이전 날의 N 값
- • TR: 현재 True Range
이는 20일 지수이동평균과 유사하며, 단순이동평균으로 계산하기도 한다.
**1 유닛(Unit)의 크기 계산:**
유닛 크기 (계약 수) = 계좌 자산의 1% / (N × 틱 가치)
• 틱 가치(Dollars per Point): 1포인트 변동 시의 가치
##### 3. 진입 (Entries)
- • 진입: 55일 고가를 상향 돌파하면 매수, 55일 저가를 하향 돌파하면 매도한다.
##### 5. 손절 (Stops)
- • 모든 유닛에 대한 손절 기준은 진입 가격으로부터 2N 만큼 불리한 가격에 설정한다.
- • 유닛이 추가될 때마다 전체 포지션의 손절 가격을 1/2 N 만큼 유리한 방향으로 상향 조정한다.
- • 즉, 마지막으로 진입한 유닛의 손절 가격이 전체 포지션의 손절 가격이 된다.
##### 6. 청산 (Exits)
손절에 도달하기 전 수익 중인 포지션의 청산 규칙은 다음과 같다.
- • 매수 포지션: 20일 저가를 하향 돌파할 때 청산한다.
- • 매도 포지션: 20일 고가를 상향 돌파할 때 청산한다.
단, N값에 익절선 변경 기준을 곱한 값 이상으로 가격이 상승할 경우, 위 규칙을 따른다.

Ekoparaloji Cyrpto StrategyEkoparaloji Crypto Strategy - User Information Document
📊 Strategy Overview
This strategy provides long-term position management in cryptocurrency markets using the averaging down (pyramiding) technique. The basic logic is to controllably grow positions as prices decline and exit when specific profit targets are reached.
🎯 Key Features
✅ Automatic Entry System
Market direction is determined using a proprietary trend identification algorithm
Trades are only opened in uptrends
Initial position opens automatically when specific conditions are met
📈 Pyramiding Mechanism
New positions are automatically added as price decreases
Up to 10 positions can be added maximum
Each addition occurs at predetermined decline levels
Risk management through dynamic position sizing
💰 Profit and Loss Management
Take Profit: All positions close when the specified percentage above average cost is reached
Stop Loss (Optional): Protects a specified percentage of total capital
A certain ratio of available capital is used in each trade
📊 Visual Tracking System
The following information is displayed in real-time on the chart:
✅ Average cost level
✅ Profit target level
✅ Stop loss level (if active)
✅ Next pyramiding level
✅ Liquidation (capital reset) level
✅ Trend indicator
🛡️ Risk Management Features
1. Dynamic Capital Protection
Automatic exit when losses exceed a specified percentage of total capital
Complete loss scenario can be previewed through liquidation level calculation
2. Position Control System
Protection preventing multiple trades on the same bar
Double trigger prevention mechanism
Maximum position limit
3. Time Filter
Optional trading within a date range
Ideal for testing on historical data
📱 Information Panel
Information table always visible in the upper right corner of the strategy:
When Position is Open:
Number of active positions
Average cost
Current price
Total capital status
Capital loss percentage
Profit target
Stop loss level and distance
Next entry level
Liquidation level and distance
When No Position:
Market trend (Uptrend/Downtrend)
Ready to trade?
Reason for waiting
Initial position size
Target profit percentage
⚙️ Adjustable Parameters
Customizable by user:
💵 Capital Amount: Base amount to be used for each position
📊 Profit Target: Profit percentage at which to exit
🛑 Stop Loss: Usage status and maximum loss percentage
📅 Time Filter: Start and end dates for testing
💬 Trade Comments: Custom labels for each trade
📘 Understanding Leverage Effect
1. What is the Leverage Effect?
Although there's no real leverage in the spot market, when Capital Amount is increased, capital usage works like leverage:
Capital Amount 5% (1.0x): 100% capital usage with full pyramiding = All your money in trades
Capital Amount 10% (2.0x): 200% capital usage with full pyramiding = Attempting to open trades worth 2x your capital
Capital Amount 15% (3.0x): 300% capital usage with full pyramiding = Attempting to open trades worth 3x your capital
⚠️ IMPORTANT: If your capital runs out in the spot market, you cannot open new positions, therefore it's recommended to keep Capital Amount at 5% or below!
⚠️ Important Warnings
Pyramiding Risk: If price continues to decline, position grows and risk increases
Capital Requirements: Up to 10 positions can be added, requiring sufficient capital
Trend Dependency: Only works in uptrends
Backtest Results: Past performance is not a guarantee of future results
Real Trading Risks: Slippage, commissions, and market conditions can affect results
🎓 How to Use
Add the strategy to your chart
Adjust parameters according to your risk appetite
Examine past performance by backtesting
Optionally set up alerts to activate notifications
Test with paper trading first
This strategy is for educational purposes. Do your own research and only trade with capital you can afford to lose.
Disclaimer: This strategy is not financial advice. All investment decisions are the user's responsibility.
Happy trading! 📊

Ekoparaloji Strategy Crypto Ekoparaloji Crypto Strategy - User Information Document
📊 Strategy Overview
This strategy provides long-term position management in cryptocurrency markets using the averaging down (pyramiding) technique. The basic logic is to controllably grow positions as prices decline and exit when specific profit targets are reached.
🎯 Key Features
✅ Automatic Entry System
Market direction is determined using a proprietary trend identification algorithm
Trades are only opened in uptrends
Initial position opens automatically when specific conditions are met
📈 Pyramiding Mechanism
New positions are automatically added as price decreases
Up to 10 positions can be added maximum
Each addition occurs at predetermined decline levels
Risk management through dynamic position sizing
💰 Profit and Loss Management
Take Profit: All positions close when the specified percentage above average cost is reached
Stop Loss (Optional): Protects a specified percentage of total capital
A certain ratio of available capital is used in each trade
📊 Visual Tracking System
The following information is displayed in real-time on the chart:
✅ Average cost level
✅ Profit target level
✅ Stop loss level (if active)
✅ Next pyramiding level
✅ Liquidation (capital reset) level
✅ Trend indicator
🛡️ Risk Management Features
1. Dynamic Capital Protection
Automatic exit when losses exceed a specified percentage of total capital
Complete loss scenario can be previewed through liquidation level calculation
2. Position Control System
Protection preventing multiple trades on the same bar
Double trigger prevention mechanism
Maximum position limit
3. Time Filter
Optional trading within a date range
Ideal for testing on historical data
📱 Information Panel
Information table always visible in the upper right corner of the strategy:
When Position is Open:
Number of active positions
Average cost
Current price
Total capital status
Capital loss percentage
Profit target
Stop loss level and distance
Next entry level
Liquidation level and distance
When No Position:
Market trend (Uptrend/Downtrend)
Ready to trade?
Reason for waiting
Initial position size
Target profit percentage
⚙️ Adjustable Parameters
Customizable by user:
💵 Capital Amount: Base amount to be used for each position
📊 Profit Target: Profit percentage at which to exit
🛑 Stop Loss: Usage status and maximum loss percentage
📅 Time Filter: Start and end dates for testing
💬 Trade Comments: Custom labels for each trade
📘 Understanding Leverage Effect
1. What is the Leverage Effect?
Although there's no real leverage in the spot market, when Capital Amount is increased, capital usage works like leverage:
Capital Amount 5% (1.0x): 100% capital usage with full pyramiding = All your money in trades
Capital Amount 10% (2.0x): 200% capital usage with full pyramiding = Attempting to open trades worth 2x your capital
Capital Amount 15% (3.0x): 300% capital usage with full pyramiding = Attempting to open trades worth 3x your capital
⚠️ IMPORTANT: If your capital runs out in the spot market, you cannot open new positions, therefore it's recommended to keep Capital Amount at 5% or below!
⚠️ Important Warnings
Pyramiding Risk: If price continues to decline, position grows and risk increases
Capital Requirements: Up to 10 positions can be added, requiring sufficient capital
Trend Dependency: Only works in uptrends
Backtest Results: Past performance is not a guarantee of future results
Real Trading Risks: Slippage, commissions, and market conditions can affect results
🎓 How to Use
Add the strategy to your chart
Adjust parameters according to your risk appetite
Examine past performance by backtesting
Optionally set up alerts to activate notifications
Test with paper trading first
This strategy is for educational purposes. Do your own research and only trade with capital you can afford to lose.
Disclaimer: This strategy is not financial advice. All investment decisions are the user's responsibility.

Ajay R5.41🔻 Ajay Gold 3H Sell Power Indicator 🔻
Precision-Based Smart Sell System for Gold (XAU/USD)
💡 Overview
This indicator is specifically designed for Gold (XAU/USD) and delivers best results on the 3-Hour Timeframe (3H TF).
It is a Smart Money Logic-based Sell Confirmation System, combining institutional structure and candle behavior to generate highly accurate bearish signals.
⚙️ Technical Foundation
The indicator uses multiple advanced confirmations:
📉 EMA Trend Filter → Confirms downtrend
💪 RSI Overbought Rejection → Momentum reversal signal
📊 MACD Bearish Cross → Confirms trend strength
🕯️ Bearish Candle Structure → Price action validation
When all conditions align, a clear 🔻 Sell Signal is plotted on the chart.
💎 Hidden Feature
This indicator includes a hidden feature that activates only when the correct market structure forms.
It helps reduce false signals and increases accuracy without being visible on the chart — fully automated internal logic.
📆 Recommended Settings
Symbol: XAU/USD (Gold)
Timeframe: 3-Hour (3H)
Market: Forex / Commodity
Mode: Sell-Only Confirmation Indicator
Performance: Best precision and consistency on 3H TF
📈 How to Use
Select XAU/USD on chart and set 3H timeframe.
Add the indicator to the chart.
Wait for the 🔻 Sell Signal and confirm the market structure after candle close.
Take entry according to your risk management.
⚠️ Disclaimer
This indicator is for educational and analytical purposes only.
No system is 100% accurate — always backtest and demo trade before using in real trading.
💬 Credits
Developed by Ajay Sahu (India)
Based on Institutional & Smart Money Logic
Best results on 3H TF
Hidden Algorithm for XAU/USD traders

Ajay R5.41🔻 Ajay Gold 3H Power Indicator 🔻
Precision-Based Smart Sell System for Gold (XAU/USD)
💡 Overview
This indicator is specifically designed for Gold (XAU/USD) and delivers best results on the 3-Hour Timeframe (3H TF).
It is a Smart Money Logic-based Sell Confirmation System, combining institutional structure and candle behavior to generate highly accurate bearish signals.
⚙️ Technical Foundation
The indicator uses multiple advanced confirmations:
📉 EMA Trend Filter → Confirms downtrend
💪 RSI Overbought Rejection → Momentum reversal signal
📊 MACD Bearish Cross → Confirms trend strength
🕯️ Bearish Candle Structure → Price action validation
When all conditions align, a clear 🔻 Sell Signal is plotted on the chart.
💎 Hidden Feature
This indicator includes a hidden feature that activates only when the correct market structure forms.
It helps reduce false signals and increases accuracy without being visible on the chart — fully automated internal logic.
📆 Recommended Settings
Symbol: XAU/USD (Gold)
Timeframe: 3-Hour (3H)
Market: Forex / Commodity
Mode: Sell-Only Confirmation Indicator
Performance: Best precision and consistency on 3H TF
📈 How to Use
Select XAU/USD on chart and set 3H timeframe.
Add the indicator to the chart.
Wait for the 🔻 Sell Signal and confirm the market structure after candle close.
Take entry according to your risk management.
⚠️ Disclaimer
This indicator is for educational and analytical purposes only.
No system is 100% accurate — always backtest and demo trade before using in real trading.
💬 Credits
Developed by Ajay Sahu (India)
Based on Institutional & Smart Money Logic
Best results on 3H TF
Hidden Algorithm for XAU/USD traders

Nemesis Strategy MLWinning That's all I know
Years of research been done to this strategy It's based on algorithm that detects where the markets are going Works on crypto this strategy his excellent indicators and it can generate a lot of money if you know what you are doing and depending on the fees of the exchanges as well So be smart and be kind God bless you all
AlgoAIDESIGNED FOR HEIKEN ASHI BARS
Gain Access here: algoai.store
AlgoAI
The Dark Edge of Trading
An AI-powered TradingView strategy that thrives across all markets. Short altcoin pumps. Ride NAS100 waves. Dominate gold, FX, stocks, and futures — all with one AI brain.
#1
Semi-Automatic Trading (Recommended)
Set up alerts on AlgoAI signals. As they come in, grade the setups and choose to enter manually. This gives you full control while leveraging AI precision.
#2
Fully Automated Trading
Pass signals via webhooks to TradersPost for futures or PineConnector for FX. Note: When running fully automated, it's suggested to use long-only or short-only mode to avoid side swiping and potential unintended drawdown.
BITSTAMP:BTCUSD

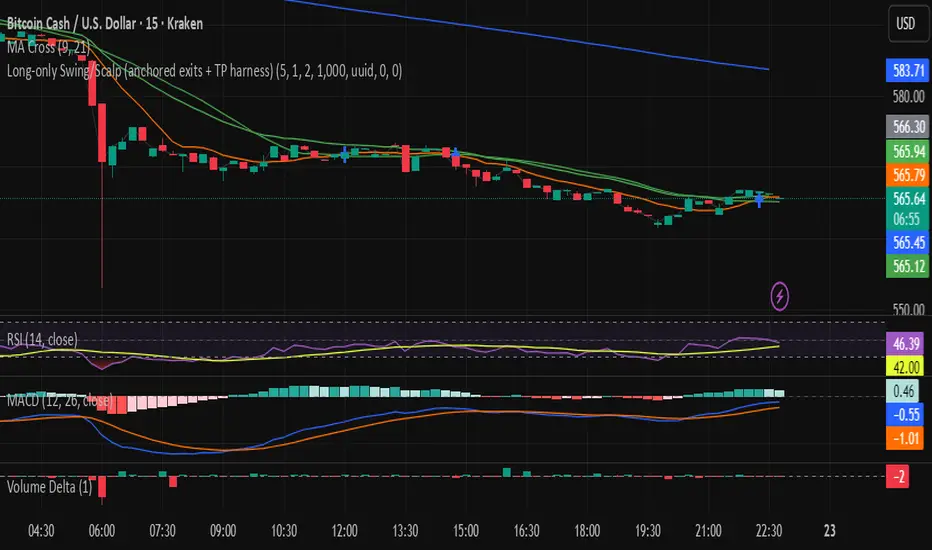
Long-only Swing/Scalp (anchored exits + TP harness) Traders PostThis is the Traders Post friendly drag and drop version of the swing/ scalp strategy for the algo traders out there. Let me know your thoughts, constructive criticism is always welcome.
TradeMastersAlgoOur strategy is a long only algorithm that has produced repeatable positive results in both back testing and live testing. The code is our proprietary IP. Users may have a 30 free trial to experiment with our strategy.
Results are not guaranteed.
This strategy was created for automated day trading a fully funded margin account. Please exercise caution and discipline when using any strategy. We've had the most positive results with heavy diversification (40 tickers trading 5% equity each).
Ticker selection, timeframe, and chart type ( we use standard candles ) are up to the user.
We encourage you to keep your own method to your self to prevent the dilution of your strategy.
Ajay Nayak - EMA ATR Trailinge strategy RSI aur RSI ke SMA ke crossover par CALL aur PUT signal generate karti hai.
Saath me ATR based stoploss aur crossover target bhi diya gaya hai.
Algo trading ke liye useful hai.

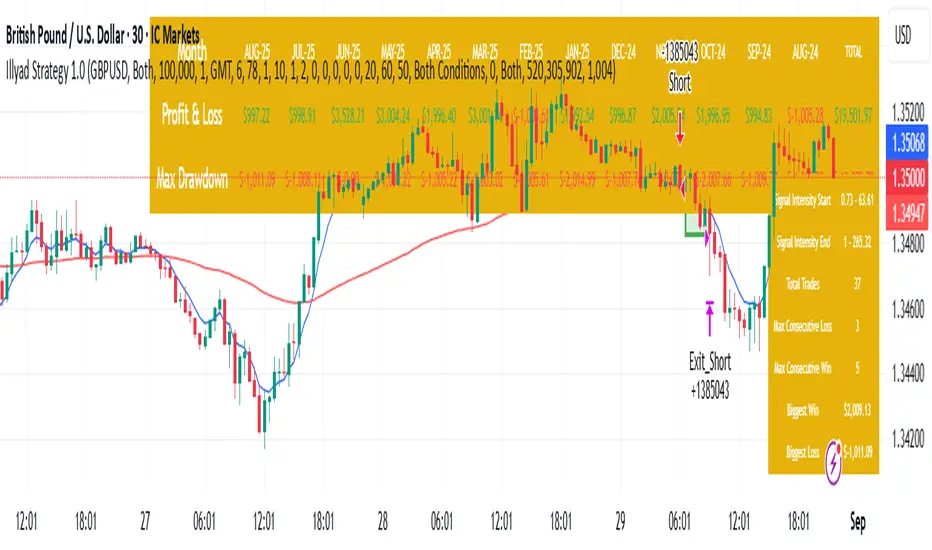
Optimised GBP/USD (IC Markets, 30m)This is the Illyad Strategy 1.0 optimised for GBP/USD on the 30-minute timeframe (IC Markets feed).
📊 Backtest Results (Jan 2024 – Aug 2025):
✅ Total P&L: +19,501.97 USD (+19.50%)
📉 Max Drawdown: 3.57% (3,607.64 USD)
🔁 Total Trades: 37
📈 Win Rate: 51.35% (19/37 trades)
⚖️ Profit Factor: 2.08
This version shows steady profitability with controlled drawdown, making it highly effective for prop firm evaluations and scaling accounts.
🔧 Optimisation Notes:
Works best on the 30-minute timeframe.
Each symbol behaves differently — always optimise the algo per instrument (e.g. GBP/USD vs EUR/GBP vs Gold).
Parameters such as moving averages, risk, and SL/TP ratios can be tuned to maximise performance.
💡 Best Use Cases:
Prop firm challenges (FTMO, AquaFunded, MyForexFunds, etc.).
Scaling funded capital by trading multiple accounts simultaneously.
Full automation via TradingView alerts → MT5 integration.
⚠️ Disclaimer:
This script is for educational purposes only. Past results do not guarantee future performance. Always backtest and forward-test on demo before going live.
📲 Next Steps:
This setup demonstrates the GBP/USD optimisation. The Illyad Strategy can be adjusted to perform across any forex pair, index, or stock with proper optimisation.
👉 Check my profile for full automation solutions.
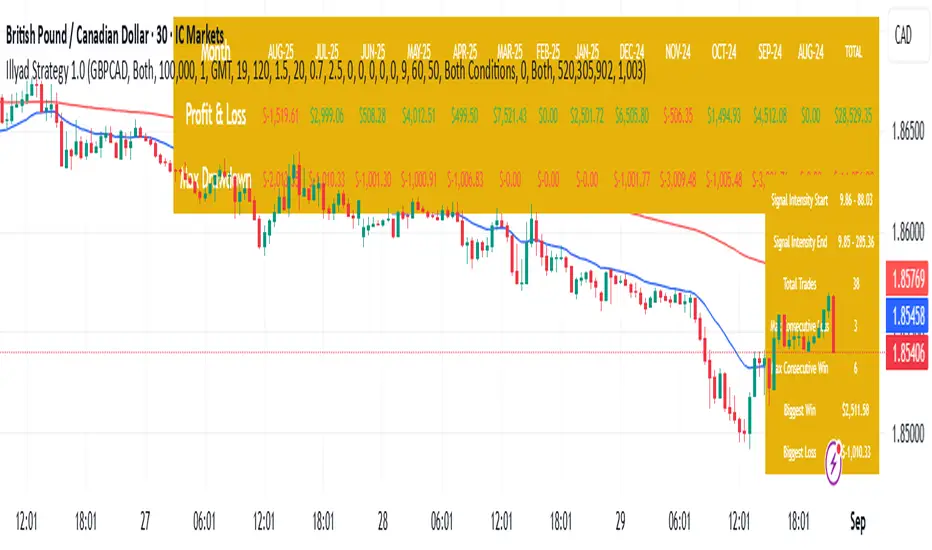
Optimised GBP/CAD (IC Markets, 30m) - Automated TradingHere’s the Illyad Strategy 1.0 optimised for GBP/CAD on the 30-minute timeframe (IC Markets feed).
📊 Backtest Results (Jan 2024 – Aug 2025):
✅ Total P&L: +28,529.35 CAD (+28.53%)
📉 Max Drawdown: 3.61% (3,822.27 CAD)
🔁 Total Trades: 38
📈 Win Rate: 50.00% (19/38 trades)
⚖️ Profit Factor: 2.49
This setup shows strong performance with low drawdown, making it well-suited for prop firm trading and long-term portfolio compounding.
🔧 Optimisation Notes:
Works best on the 30-minute timeframe.
Each symbol has unique volatility and structure. To maximise results, you must optimise the algo per symbol (e.g., GBP/CAD vs EUR/USD vs NASDAQ).
Parameters such as moving averages, signal intensity, and SL/TP levels should be tuned to the instrument.
💡 Best Use Cases:
Prop firm challenges (FTMO, AquaFunded, MyForexFunds alternatives).
Running across multiple accounts simultaneously for compounding.
Automated execution via TradingView alerts → MT5 integration.
⚠️ Disclaimer:
This script is provided for educational purposes only. Past results do not guarantee future performance. Always backtest and forward-test on demo before live trading.
📲 Next Steps:
This version demonstrates the GBP/CAD optimisation. The Illyad Strategy can be tuned to work on any symbol (forex, indices, or stocks).
👉 Visit my profile for full automation solutions (TradingView → MT5)
Illyad Strategy 1.0 - Automate your alerts by connecting to MT5Illyad Strategy 1.0 – Automated Prop Trading System (30m Timeframe)
Description:
The Illyad Strategy 1.0 is a rule-based automated trading system designed for serious traders and prop-firm challenges.
🔑 Key Features:
Optimised to work best on the 30-minute timeframe.
Built-in money management to keep drawdown controlled.
Dynamic stop-loss / take-profit levels.
Works across forex, indices, and stocks.
Compatible with TradingView alerts → MT5 automation.
⚙️ Optimisation:
Each symbol has its own behaviour. For best results, you should optimise the parameters (moving averages, signal intensity, SL/TP ratios) on the symbol you want to trade. The algo adapts differently to EURUSD vs NASDAQ vs stocks like TSLA, so proper tuning is critical.
💡 Best Use Case:
Prop firm accounts (FTMO, MyForexFunds, AquaFunded, etc.).
Consistent returns without emotional decision-making.
Traders who want to scale multiple accounts at once.
⚠️ Disclaimer:
This script is for educational purposes. Past results do not guarantee future returns. Always backtest and forward test on demo before going live.
📲 Next Step:
This is the public version. If you’d like to connect it directly to MT5/MT4 for fully automated trading, visit my profile or contact me for details.

fero.karma algoUnderstand what stocks, currencies (forex), and cryptocurrencies are. Learn common terms like bull market, bear market, volatility, and liquidity.
Study Analysis: There are two main types of analysis:

Twin Range Filter StrategyClarity Over Confusion: See price action through a全新的 lens. Watch as erratic, choppy movements are smoothed into a clear, actionable trajectory. The path of least resistance becomes obvious.
Confidence Over Hesitation: Receive high-probability entry and exit signals with a proven logic that waits for the market to commit before you do. No more second-guessing.
Discipline Over Emotion: Our algorithm enforces a systematic approach, helping you avoid emotional FOMO chasing and panic selling. Stick to the plan and execute with precision.
What Can You Expect?
Dynamic Adaptability: Unlike static indicators, continuously adapts to volatility. It widens its filter in turbulent markets to avoid whipsaws and tightens it in trending markets to capture more of the move.
The Power of Two: By synthesizing data from two distinct market perspectives, it confirms strength and filters out weakness, providing a confluence that standalone indicators simply cannot match.
Clean, Unambiguous Signals: We’ve eliminated the clutter. The software provides clear visual alerts (Green Arrows for Long, Red Arrows for Short) right on your chart, telling you exactly when the equilibrium has shifted.
Who is this for?
Swing Traders looking to capture the heart of a trend and avoid false breakouts.
Day Traders needing a reliable filter to navigate volatile intraday action.
Systematic Traders seeking a robust logic layer to add to their automated strategy.
Anyone overwhelmed by indicator overload and craving a single, trusted source of truth on their chart

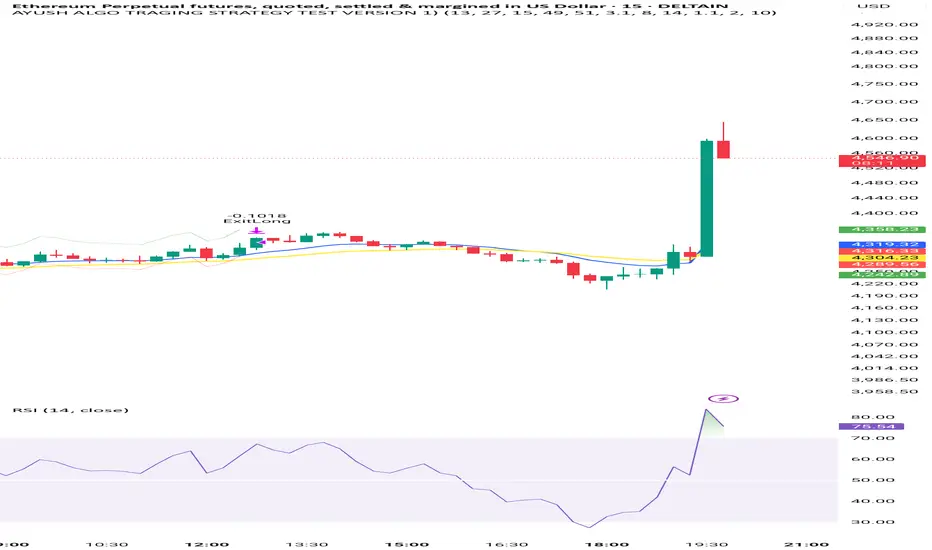
AYUSH ALGO TRAGING STRATEGY TEST VERSION 1)Very good strategy , it uses two moving avg crossovers and also rsi and atr for confirmation, this strategy is fully automated
Multi Channel GRID & DCA LTF [trade_lexx]Multi Channel GRID & DCA LTF
Usage Guide
Part 1: The concept and general possibilities of the "Multi Channel GRID & DCA LTF" strategy
Introduction
Welcome to the guide to "Multi Channel GRID & DCA LTF", a powerful and versatile automated trading strategy for the TradingView platform. This tool was developed for traders who are looking for flexibility, control and a high degree of adaptability to various market conditions.
The strategy is based on a hybrid approach that combines two popular and time-tested techniques.:
1. GRID (grid trading): The classic method of averaging a position is by placing a grid of limit orders.
2. DCA (Dollar Cost averaging): Smart position averaging based on signals from external indicators.
However, "Multi Channel GRID & DCA LTF" goes far beyond the simple combination of these two techniques. The strategy includes a number of unique and innovative features, such as cascading MultiGRID grids for dealing with extreme volatility, Channel Mode range trading mode for profiting from sideways movement, and Low Time Frame analysis (LTF) to achieve surgical accuracy in backtesting. Deep customization options for risk management, capital, take profits, and stop losses allow you to configure a strategy for almost any trading style, asset, and timeframe.
The basic idea: How does it work?
Let's take a detailed look at each of the key concepts embedded in the logic of the strategy.
1. GRID — Automatic placement of buy and sell orders at certain price intervals.
This is a fundamental mode of operation. Its main goal is to systematically improve the average entry price for a position if the market is going against you.
* The principle of operation: After opening the base (first) order (`BO`), the strategy automatically places a series of pending limit orders (here they are called "safety orders" or "SO") at certain price intervals. For a long position, orders are placed below the entry price, and for a short position, orders are placed higher.
* Target: When the price moves against an open position, it consistently hits and executes safety orders. Each such execution adds additional volume to the position at a more favorable price, thereby shifting the overall average entry price (`position_avg_price') closer to the current market price. This means that a much smaller corrective movement will be required to gain ground.
* Flexibility: You have full control over the geometry of the grid: the number of safety orders, the percentage distance between them (`SO Step`), and you can even set a coefficient that will increase this step for each subsequent order (`SO Multiplier`), creating an expanding grid.
2. DCA (Signal Averaging) — Smart Averaging
This mode adds an additional layer of analysis to the averaging process. Instead of just buying/selling at the set price levels, the strategy waits for a confirmation signal.
* Working principle: You can connect any external indicator (for example, RSI, CCI, or even your own complex signal system) to the strategy, which outputs numerical values. As standard, 1 is used for a long signal, and -1 is used for a short signal. The strategy will place the next averaging order only at the moment when it receives the appropriate signal.
* Goal: To average a position not just during a fall (or a rise for a short), but at the moments that your main trading system considers the most favorable for this. This allows you to avoid "catching falling knives" and enter only if there are good reasons.
3. Hybrid Mode (GRID+DCA) is the best of the previous two modes
This mode is designed for maximum filtering and control. It requires two conditions to be fulfilled simultaneously.
* Working principle: The safety order will be executed only if the price has reached the calculated grid level and a confirmation signal has been received from your external indicator. If a confirmation signal is received from an external indicator, the next calculated grid level activates the limit order.
* Goal: To create the most reliable averaging system that protects against premature entries and requires double confirmation (both by price and indicator) before increasing the position size.
4. MultiGRID — Adaptation to extreme volatility
This is one of the most powerful and unique features of a strategy designed to survive and make a profit in the face of strong, protracted trends or "black swans".
* The problem it solves: The usual grid of orders has a limited depth. If the price goes beyond the last safety order, the strategy loses the opportunity to average and becomes vulnerable.
* The principle of operation: The MultiGRID function allows you to create "cascades" — several grids following one another. When all the orders of the first grid are executed, the strategy does not stop. Instead, she can activate the second, third (and so on) a grid of orders. The new grid can be activated by one of two triggers:
1. Offset: The new grid is activated when the price passes another set percentage deviation from the last executed order.
2. Signal: The new grid is activated when a signal is received from an external indicator.
* Goal: To significantly expand the working range of the strategy. This allows it to adapt to strong market movements that would "break" the usual grid, and continue to effectively average a position at a much greater depth of decline or growth.
5. Channel Mode — Trading in the range
This feature turns a standard averaging strategy into a machine for "farming" profits within a price channel that is formed during a sideways market movement.
* The problem it solves: In the standard grid strategy, after partially closing a take profit position, the volume of this part "leaves" the trade until the deal is fully closed. You are missing the opportunity to reuse this capital.
* Operating principle: When Channel Mode is enabled, the following happens. Suppose the price went against you, executed several safety orders, and then turned around and reached one of the partial take profits. At this point, the strategy is:
1. Fixes the profit, as it should be.
2. Instantly places a new limit order to buy (or sell for a short) at exactly the same price level where the last triggered safety order was executed. The volume of this order is equal to the volume of the part that was just closed for take profit.
3. If the price goes down again and executes this "repeat" order, the strategy immediately sets a corresponding take profit for it at the level where the previous profit was taken.
* Goal: To create a continuous buy-sell cycle within the local range (channel). The lower limit of the channel is the price of the last averaging, and the upper limit is the price of a partial take profit. This allows you to repeatedly profit from sideways price fluctuations, without waiting for the full closure of the main, large transaction.
6. LTF (Lower Timeframe Analysis) — Surgical precision of backtesting
This feature is critically important for obtaining reliable results during historical testing (backtesting) of grid strategies.
* The problem it solves: The standard testing mechanism in TradingView has a serious limitation. Working, for example, on a 4-hour chart, he sees only 4 candle points: Open, High, Low and Close. He does not know in what order the price moved within these 4 hours. He could have touched High first and then Low, or vice versa. For grid strategies, this is fatal — the engine can show that a take profit has been executed, although in reality the price first went down, collected the entire grid of orders and only then turned around.
* How it works: When you turn on the LTF mode, the strategy for each candle on your main chart (for example, 4H) requests and analyzes all candles from the lower timeframe you specified (for example, 1-minute). Then it virtually trades the entire price path for these minute candles, executing orders, take profits and stop losses in the sequence in which they would occur in reality. It works in the single take profit mode of the Grid strategy.
* Goal: To provide the most realistic and reliable backtest that reflects the real dynamics of the market. This allows you to avoid false expectations and accurately assess the potential performance of the strategy.
// ------------------------
Part 2: Detailed description of the strategy settings
This section is your main guide to all the switches and options available in the strategy. Understanding each setting is the key to unlocking the full potential of this powerful tool.
1. 🛡️ Risk Management 🛡️
This group contains fundamental parameters that determine the basic logic of risk management and the geometry of grid orders.
* Strategy type: Determines the direction of transactions.
* Long: The strategy will only open long positions (buy).
* Short: The strategy will only open short positions (sell).
* Both: The strategy will work both ways, opening long or short depending on the incoming signal.
* SO Count: Sets the maximum number of Safety (averaging) Orders (SO) that the strategy will place within the same grid. If you have MultiGRID enabled, this number applies to each individual grid.
* SO Step (%): This is the base percentage deviation from the entry price at which the first safety order will be placed. For example, at a value of 0.5, the first SO in a long trade will be placed 0.5% lower than the opening price of the base order.
* SO Multiplier: A coefficient that exponentially increases the step for each subsequent safety order. This allows you to create an expanding grid where averaging orders are placed further and further apart, which is effective with strong and accelerating price movements.
* *The step formula for the nth order*: Step(N) = (SO Step) * (SO Multiplier ^(N-1)).
* If the value is 1, all steps will be the same.
* With a value of 1.6, the step of the second SO will be 1.6 times larger than the first, the step of the third will be 1.6 times larger than the second, and so on.
* 1️⃣ TP/SL: These are simplified settings for quick configuration. They allow you to turn on/off the main take profit and stop loss and set basic percentage values for them. More detailed settings for these parameters can be found in the relevant sections below.
// ------------------------
2. 💰 Money Management 💰
Everything related to position size, leverage, and capital is configured here.
* Volume BO (Base Order): Determines the size of the trade's opening order.
* Volume BO: A fixed amount in the quote currency (for example, in USDT).
* USDT (check mark): Manages the information in the comments to the orders. If enabled, the volume of orders in USDT will be displayed in the comments. This is convenient for visual analysis and for sending the amount of USDT by the placeholder {{strategy.order.comment}} via webhooks when connecting the strategy to the exchange or trading terminals.
* or % of deposit: The amount calculated as a percentage of the available capital of the strategy. The check mark to the right of this field enables this mode. Important: using a percentage activates the effect of compounding (compound interest), as the amount of each new transaction will be automatically recalculated based on the current capital (initial capital + profit/loss). If enabled, the percentage of orders will be displayed in the comments. This is convenient for visual analysis and for sending percentages on the placeholder {{strategy.order.comment}} via webhooks when connecting the strategy to the stock exchange, trading terminals, or creating Copy trading.
* Martingale: The coefficient applied to the volume of orders. It increases the size of each subsequent insurance order compared to the base one.
* Volume formula for the nth SO: Volume SO (N) = (Volume BO) * (Martingale^N).
* With a value of 1.2, the volume of the first SO will be 1.2 times greater than the base, the second — 1.44 times (`1.2 * 1.2`) and so on.
* Leverage: Specify the size of your leverage. This parameter is used exclusively for calculating and displaying the approximate liquidation price. It does not affect the size of positions, but it helps to visually assess the risks.
* Liquidation: Enables or disables the calculation and display of the liquidation line on the chart.
* Margin type: Allows you to select a method for calculating the liquidation price, simulating the logic of exchanges:
* Isolated: The liquidation price is calculated based on the size and leverage of the current open position only.
* Cross: The calculation simulates using the entire available balance to maintain a position. In the strategy, the liquidation price is calculated as the level at which the loss on the current transaction is equal to the current capital.
* Commission (%): Specify the percentage of your exchange's commission per transaction. The correct value of this parameter is crucial for obtaining realistic backtest results.
// ------------------------
3. 🕸️ Grid Management 🕸️
This group is responsible for the logic of safety orders and advanced mechanics such as Channel Mode and MultiGRID.
* SO Type: Defines the logic of placing averaging orders.
* GRID: Classic grid. All safety orders are placed in advance as limit orders.
* DCA: Signal averaging. The strategy is waiting for a signal from an external indicator to place a market averaging order.
* GRID+DCA: Hybrid. The strategy waits for a signal, and if it arrives, places a limit order at the appropriate price level of the grid or executes a market order if the signal has arrived below the limit order level.
* Signal for SO: A data source (indicator) that will be used for signals in DCA and GRID+DCA modes.
* ↔️ Channel Mode: When this option is enabled, the strategy tries to trade in a sideways range. After partially closing a take profit position, it immediately places a limit order for re-entry at the price of the last triggered safety order. This creates a buy-sell cycle within the local channel.
* Best Price Only: This filter adds an additional condition for averaging in DCA and MultiGRID modes (when it operates on a signal). The next averaging order or a new grid will be activated only if the current price is more favorable (lower for long, higher for short) than the price of the previous entry.
* 🧩 MultiGRID ⮕ Enables cascading grid mode.
* Grid Count: The total number of grids that can be activated sequentially.
* Offset: Percentage deviation from the price of the last order of the previous grid. When this margin is reached, the following grid of orders is activated (this mode does not require a signal).
* Or signal: Allows you to use the signal from an external indicator as a trigger to activate the next grid. The checkmark on the right turns on this mode.
// ------------------------
4. 🎯 Entry and Stop 🎯
This group of settings allows you to fine-tune the conditions for starting a new trade and all aspects related to protective stop orders, including the complex mechanics of trailing and managing SL after partial take profits.
* 🎯 Signal: A data source (indicator) that will be used to determine when to enter a trade. The strategy expects a value of 1 for the start of a long trade and -1 for a short trade.
* Min Bars: Sets the minimum number of candles that must pass from the moment of opening the previous trade to the moment of opening the next one. A value of 0 disables this filter. This is a useful tool to prevent overly frequent entries in a "noisy" market.
* Non-stop: If this option is enabled, the strategy ignores the Entry Signal and opens a new trade immediately after closing the previous one (taking into account the Min Bars filter, if it is set). This turns the strategy into a constantly working mechanism that is always on the market.
* 🛑 SL Type: Defines the base price from which the stop loss percentage will be calculated. The stop loss in the first section must be enabled for this block of settings to work.
* From the entry point: SL is always calculated from the opening price of the very first base order. It remains static throughout the entire transaction unless it is moved by other functions.
* From breakeven line: SL is dynamically recalculated and shifted each time a safety order is executed. It always follows the average price of the position, being at a given percentage distance from it.
* From last executed SO: SL is recalculated from the price of the last executed order, whether it is a base or a safety order.
* From last SO: SL is calculated from the price of the most recent possible safety order in the grid. This is usually the most remote and conservative type of SL.
* Trailing SL Type: Defines the algorithm by which the stop loss will move after its activation.
* Standard: Classic trailing. After activation, SL will follow the price at a fixed distance.
* ATR: SL will follow the price at a distance equal to the value of the ATR indicator multiplied by the specified multiplier.
* External Source: SL will follow any selected line of the third-party indicator.
* Period and Multiplier: Common parameters for all types of trailing.
* Source: The source of the line for the trailing SL of the third-party indicator.
* Trailing SL after entry: The mode of activation of the trailing SL after entering the transaction
* SL management after TP (sections 1️⃣, 2️⃣, 3️⃣): These three blocks allow you to create a complex stop loss management logic as profits are recorded.
For each take profit level (TP1, TP2, TP3), you can configure:
* SL BE / SL TP1 / SL TP2: When the corresponding TP is reached, the stop loss will be moved to the breakeven point (for TP1), to the TP1 price level (for TP2) or to the TP2 price level (for TP3).
* Trailing SL: When the corresponding TP is reached, the trailing stop loss is activated according to the settings above.
* By ↔️ Signal: A very powerful option. If it is enabled, the above action (SL transfer or trailing activation) will occur when the opposite trading signal is received from an external indicator. This allows you to protect profits or reduce losses if the market turns sharply, even before reaching the target.
* SL Delay ⮕ Allows you to delay the activation of the stop loss.
* Number of Bars: The Stop loss will be physically placed on the market only after the specified number of candles has passed since entering the trade. This can help to avoid "taking out" the stop with a random short movement (squiz) immediately after opening a position.
* SL Block: Unique defensive mechanics for trading both ways (`Strategy Type: Both`).
* Number of SL: If the strategy receives the specified number of stop losses in a row in one direction (for example, 2 stops long), it temporarily blocks the opportunity to open new trades in that direction.
* Lock Reset mode:
* By direction: The lock is lifted if a profitable trade is closed in the allowed direction or if a stop loss is triggered in the opposite direction.
* First profit: The lock is lifted after closing any profitable transaction, regardless of its direction.
// ------------------------
5. ✅ Take Profit ✅
This group of settings provides comprehensive control over profit taking, from a simple take profit to a complex system of partial closures and trailing.
* ✅ TP Type: Defines the base price for calculating the percentage deviation of the take profit.
* From entry point: TP is calculated from the base order price.
* From breakeven line: TP dynamically follows the average position price.
* From last executed SO: TP is calculated from the price of the last executed order.
* Filters for closing on signal
* Only ➕: If TP is triggered by a signal, the deal will be closed only if it is in the black relative to the average price.
* Or >TP: If TP is triggered by a signal, the trade will be closed only if the closing price is better than (or equal to) the estimated price of this TP.
* TP type of trailing: Yes, take profit has a trailing too! It works differently than the SL trailing.
* Standard / ATR: After the price touches the "virtual" TP level, the trailing is activated. He does not place a stop order, but begins to move away from the price, dynamically moving the limit order to close further and further in the profitable direction, allowing him to collect the maximum from the impulse movement.
* External Source: TP will follow any selected line of the third-party indicator.
* Period and Multiplier: Parameters for calculating the trailing margin TP.
* Source: The source of the line for the trailing TP of the third-party indicator.
* TP level settings (sections 1️⃣, 2️⃣, 3️⃣, 4️⃣): The strategy supports up to four independent take profit levels, which allows for a flexible system of partial commits.
For each level, you can set:
* TP: Enable the level and set its percentage deviation from the base price.
* Size: What percentage of the current position will be closed when this level is reached. For the last active TP, this parameter is ignored, and 100% of the remaining position is closed.
* Trailing TP: Enable the above-described trailing mechanism for this particular level.
* Signal: Enable closing based on the signal from the external indicator for this level.
* Or take: If both the closing on the signal and the limit order are enabled, then whatever comes first will work.
* After SO: Activate this TP level only after the specified number of safety orders has been executed. This allows you to set closer targets for riskier (deeply averaged) positions.
// ------------------------
6. 🔬 GRID and MultiGrid Analysis on Lower TFs (LTF) 🔬
This group activates one of the most important functions for accurate testing of grid strategies.
* Enable LTF Calculation ⮕ The main switch of the analysis mode on the lower timeframes.
* Timeframe selection: A drop-down list where you can select a timeframe for detailed analysis. For example, if your main schedule is 1 hour, you can select 1 minute here. The strategy will emulate the trading of minute candles within each hour candle.
❗️Important: As mentioned in the first part, the use of this mode is critically necessary to obtain realistic backtest results, especially for strategies with a dense grid of orders. Without it, the results may be overly optimistic and not reflect the real dynamics of the market. It should be remembered that TradingView imposes a limit on the number of intra-bars (minor TF bars) that can be requested. This is usually about 100,000 bars.
// ------------------------
7. 🕘 Backtest Date Range 🕘
This group allows you to focus testing on a specific historical period.
* Limit Date Range: Enables date filtering.
* Start time: The date and time when the strategy will start analyzing and opening deals.
* End time: The date and time after which the strategy will stop opening new deals and complete testing.
// ------------------------
8. 🎨 Visualization 🎨
All the options responsible for the appearance and information content of the chart are collected here.
* Show PnL labels: Enables/disables the display of text labels with the result (profit/loss) after closing each trade.
* Statistics Table: Enables/disables the main dashboard with detailed statistics on the results of the backtest.
* Strategy Settings Table: Enables/disables an additional panel that summarizes all the key parameters of the current configuration.
* Monthly Profit Table: Enables/disables a table with a breakdown of percentage returns by month and year.
* Table settings: For each of the three tables, you can individually adjust the Text size and Table Position on the screen to position them as conveniently as possible.
* Decimal places: Defines how many decimal places will be displayed in numeric values in tables and on labels.
// ------------------------
9. ✉️ Webhook Settings ✉️
This group is intended for traders who want to automate trading on strategy signals using third-party services and exchanges (for example, 3Commas, WunderTrading, Cryptorobotics, Cryptohopper, Bitsgap, Binance, ByBit, OKX, Pionex, Bitget or proprietary solutions).
For each key event in the strategy, there is a separate switch and a text field:
* Webhook for Open: Enable and set a message for the webhook that will be sent when the base order is opened.
* Webhook for Averaging: A message sent when executing any insurance order.
* Webhook for Take Profit: A message sent when closing on take profit (including partial ones).
* Webhook for Stop-Loss: A message sent when a stop loss is closed.
You can insert a JSON code or any other message format that your service requires for automation into the text fields. The strategy supports special placeholders (for example, `{{strategy.order.alert_message}}`), which allow you to dynamically insert the necessary data into the message, such as the amount of USDT or the percentage of the deposit for entry, averaging and take profit orders.
