MOSTIFWhat is MOSTIF ?
MOSTIF is a combined trading strategies. There are indicators according to 3 different trading strategies and 7 different indicators are included. Trailing Stop and Partial Profits options are included.
Indicators
1-) Improved MOST. Values can be changed according to your wishes any market but settings may vary by market.
2-) Tillson T3 Indicator. Values can be changed according to your wishes any market and activating T3 Line for confirmation.
3-) 5 Different Oscillator Types. ("CCI", "RSI", "STOCH", "MFI" and "AVERAGE") are created with special algo types.
Search in scripts for "algo"
Ruckard TradingLatinoThis strategy tries to mimic TradingLatino strategy.
The current implementation is beta.
Si hablas castellano o espanyol por favor consulta MENSAJE EN CASTELLANO más abajo.
It's aimed at BTCUSDT pair and 4h timeframe.
STRATEGY DEFAULT SETTINGS EXPLANATION
max_bars_back=5000 : This is a random number of bars so that the strategy test lasts for one or two years
calc_on_order_fills=false : To wait for the 4h closing is too much. Try to check if it's worth entering a position after closing one. I finally decided not to recheck if it's worth entering after an order is closed. So it is false.
calc_on_every_tick=false
pyramiding=0 : We only want one entry allowed in the same direction. And we don't want the order to scale by error.
initial_capital=1000 : These are 1000 USDT. By using 1% maximum loss per trade and 7% as a default stop loss by using 1000 USDT at 12000 USDT per BTC price you would entry with around 142 USDT which are converted into: 0.010 BTC . The maximum number of decimal for contracts on this BTCUSDT market is 3 decimals. E.g. the minimum might be: 0.001 BTC . So, this minimal 1000 amount ensures us not to entry with less than 0.001 entries which might have happened when using 100 USDT as an initial capital.
slippage=1 : Binance BTCUSDT mintick is: 0.01. Binance slippage: 0.1 % (Let's assume). TV has an integer slippage. It does not have a percentage based slippage. If we assume a 1000 initial capital, the recommended equity is 142 which at 11996 USDT per BTC price means: 0.011 BTC. The 0.1% slippage of: 0.011 BTC would be: 0.000011 . This is way smaller than the mintick. So our slippage is going to be 1. E.g. 1 (slippage) * 0.01 (mintick)
commission_type=strategy.commission.percent and commission_value=0.1 : According to: binance . com / en / fee / schedule in VIP 0 level both maker and taker fees are: 0.1 %.
BACKGROUND
Jaime Merino is a well known Youtuber focused on crypto trading
His channel TradingLatino
features monday to friday videos where he explains his strategy.
JAIME MERINO STANCE ON BOTS
Jaime Merino stance on bots (taken from memory out of a 2020 June video from him):
'~
You know. They can program you a bot and it might work.
But, there are some special situations that the bot would not be able to handle.
And, I, as a human, I would handle it. And the bot wouldn't do it.
~'
My long term target with this strategy script is add as many
special situations as I can to the script
so that it can match Jaime Merino behaviour even in non normal circumstances.
My alternate target is learn Pine script
and enjoy programming with it.
WARNING
This script might be bigger than other TradingView scripts.
However, please, do not be confused because the current status is beta.
This script has not been tested with real money.
This is NOT an official strategy from Jaime Merino.
This is NOT an official strategy from TradingLatino . net .
HOW IT WORKS
It basically uses ADX slope and LazyBear's Squeeze Momentum Indicator
to make its buy and sell decisions.
Fast paced EMA being bigger than slow paced EMA
(on higher timeframe) advices going long.
Fast paced EMA being smaller than slow paced EMA
(on higher timeframe) advices going short.
It finally add many substrats that TradingLatino uses.
SETTINGS
__ SETTINGS - Basics
____ SETTINGS - Basics - ADX
(ADX) Smoothing {14}
(ADX) DI Length {14}
(ADX) key level {23}
____ SETTINGS - Basics - LazyBear Squeeze Momentum
(SQZMOM) BB Length {20}
(SQZMOM) BB MultFactor {2.0}
(SQZMOM) KC Length {20}
(SQZMOM) KC MultFactor {1.5}
(SQZMOM) Use TrueRange (KC) {True}
____ SETTINGS - Basics - EMAs
(EMAS) EMA10 - Length {10}
(EMAS) EMA10 - Source {close}
(EMAS) EMA55 - Length {55}
(EMAS) EMA55 - Source {close}
____ SETTINGS - Volume Profile
Lowest and highest VPoC from last three days
is used to know if an entry has a support
VPVR of last 100 4h bars
is also taken into account
(VP) Use number of bars (not VP timeframe): Uses 'Number of bars {100}' setting instead of 'Volume Profile timeframe' setting for calculating session VPoC
(VP) Show tick difference from current price {False}: BETA . Might be useful for actions some day.
(VP) Number of bars {100}: If 'Use number of bars (not VP timeframe)' is turned on this setting is used to calculate session VPoC.
(VP) Volume Profile timeframe {1 day}: If 'Use number of bars (not VP timeframe)' is turned off this setting is used to calculate session VPoC.
(VP) Row width multiplier {0.6}: Adjust how the extra Volume Profile bars are shown in the chart.
(VP) Resistances prices number of decimal digits : Round Volume Profile bars label numbers so that they don't have so many decimals.
(VP) Number of bars for bottom VPOC {18}: 18 bars equals 3 days in suggested timeframe of 4 hours. It's used to calculate lowest session VPoC from previous three days. It's also used as a top VPOC for sells.
(VP) Ignore VPOC bottom advice on long {False}: If turned on it ignores bottom VPOC (or top VPOC on sells) when evaluating if a buy entry is worth it.
(VP) Number of bars for VPVR VPOC {100}: Number of bars to calculate the VPVR VPoC. We use 100 as Jaime once used. When the price bounces back to the EMA55 it might just bounce to this VPVR VPoC if its price it's lower than the EMA55 (Sells have inverse algorithm).
____ SETTINGS - ADX Slope
ADX Slope
help us to understand if ADX
has a positive slope, negative slope
or it is rather still.
(ADXSLOPE) ADX cut {23}: If ADX value is greater than this cut (23) then ADX has strength
(ADXSLOPE) ADX minimum steepness entry {45}: ADX slope needs to be 45 degrees to be considered as a positive one.
(ADXSLOPE) ADX minimum steepness exit {45}: ADX slope needs to be -45 degrees to be considered as a negative one.
(ADXSLOPE) ADX steepness periods {3}: In order to avoid false detection the slope is calculated along 3 periods.
____ SETTINGS - Next to EMA55
(NEXTEMA55) EMA10 to EMA55 bounce back percentage {80}: EMA10 might bounce back to EMA55 or maybe to 80% of its complete way to EMA55
(NEXTEMA55) Next to EMA55 percentage {15}: How much next to the EMA55 you need to be to consider it's going to bounce back upwards again.
____ SETTINGS - Stop Loss and Take Profit
You can set a default stop loss or a default take profit.
(STOPTAKE) Stop Loss % {7.0}
(STOPTAKE) Take Profit % {2.0}
____ SETTINGS - Trailing Take Profit
You can customize the default trailing take profit values
(TRAILING) Trailing Take Profit (%) {1.0}: Trailing take profit offset in percentage
(TRAILING) Trailing Take Profit Trigger (%) {2.0}: When 2.0% of benefit is reached then activate the trailing take profit.
____ SETTINGS - MAIN TURN ON/OFF OPTIONS
(EMAS) Ignore advice based on emas {false}.
(EMAS) Ignore advice based on emas (On closing long signal) {False}: Ignore advice based on emas but only when deciding to close a buy entry.
(SQZMOM) Ignore advice based on SQZMOM {false}: Ignores advice based on SQZMOM indicator.
(ADXSLOPE) Ignore advice based on ADX positive slope {false}
(ADXSLOPE) Ignore advice based on ADX cut (23) {true}
(STOPTAKE) Take Profit? {false}: Enables simple Take Profit.
(STOPTAKE) Stop Loss? {True}: Enables simple Stop Loss.
(TRAILING) Enable Trailing Take Profit (%) {True}: Enables Trailing Take Profit.
____ SETTINGS - Strategy mode
(STRAT) Type Strategy: 'Long and Short', 'Long Only' or 'Short Only'. Default: 'Long and Short'.
____ SETTINGS - Risk Management
(RISKM) Risk Management Type: 'Safe', 'Somewhat safe compound' or 'Unsafe compound'. ' Safe ': Calculations are always done with the initial capital (1000) in mind. The maximum losses per trade/day/week/month are taken into account. ' Somewhat safe compound ': Calculations are done with initial capital (1000) or a higher capital if it increases. The maximum losses per trade/day/week/month are taken into account. ' Unsafe compound ': In each order all the current capital is gambled and only the default stop loss per order is taken into account. That means that the maximum losses per trade/day/week/month are not taken into account. Default : 'Somewhat safe compound'.
(RISKM) Maximum loss per trade % {1.0}.
(RISKM) Maximum loss per day % {6.0}.
(RISKM) Maximum loss per week % {8.0}.
(RISKM) Maximum loss per month % {10.0}.
____ SETTINGS - Decimals
(DECIMAL) Maximum number of decimal for contracts {3}: How small (3 decimals means 0.001) an entry position might be in your exchange.
EXTRA 1 - PRICE IS IN RANGE indicator
(PRANGE) Print price is in range {False}: Enable a bottom label that indicates if the price is in range or not.
(PRANGE) Price range periods {5}: How many previous periods are used to calculate the medians
(PRANGE) Price range maximum desviation (%) {0.6} ( > 0 ): Maximum positive desviation for range detection
(PRANGE) Price range minimum desviation (%) {0.6} ( > 0 ): Mininum negative desviation for range detection
EXTRA 2 - SQUEEZE MOMENTUM Desviation indicator
(SQZDIVER) Show degrees {False}: Show degrees of each Squeeze Momentum Divergence lines to the x-axis.
(SQZDIVER) Show desviation labels {False}: Whether to show or not desviation labels for the Squeeze Momentum Divergences.
(SQZDIVER) Show desviation lines {False}: Whether to show or not desviation lines for the Squeeze Momentum Divergences.
EXTRA 3 - VOLUME PROFILE indicator
WARNING: This indicator works not on current bar but on previous bar. So in the worst case it might be VP from 4 hours ago. Don't worry, inside the strategy calculus the correct values are used. It's just that I cannot show the most recent one in the chart.
(VP) Print recent profile {False}: Show Volume Profile indicator
(VP) Avoid label price overlaps {False}: Avoid label prices to overlap on the chart.
EXTRA 4 - ZIGNALY SUPPORT
(ZIG) Zignaly Alert Type {Email}: 'Email', 'Webhook'. ' Email ': Prepare alert_message variable content to be compatible with zignaly expected email content format. ' Webhook ': Prepare alert_message variable content to be compatible with zignaly expected json content format.
EXTRA 5 - DEBUG
(DEBUG) Enable debug on order comments {False}: If set to true it prepares the order message to match the alert_message variable. It makes easier to debug what would have been sent by email or webhook on each of the times an order is triggered.
HOW TO USE THIS STRATEGY
BOT MODE: This is the default setting.
PROPER VOLUME PROFILE VIEWING: Click on this strategy settings. Properties tab. Make sure Recalculate 'each time the order was run' is turned off.
NEWBIE USER: (Check PROPER VOLUME PROFILE VIEWING above!) You might want to turn on the 'Print recent profile {False}' setting. Alternatively you can use my alternate realtime study: 'Resistances and supports based on simplified Volume Profile' but, be aware, it might consume one indicator.
ADVANCED USER 1: Turn on the 'Print price is in range {False}' setting and help us to debug this subindicator. Also help us to figure out how to include this value in the strategy.
ADVANCED USER 2: Turn on the all the (SQZDIVER) settings and help us to figure out how to include this value in the strategy.
ADVANCED USER 3: (Check PROPER VOLUME PROFILE VIEWING above!) Turn on the 'Print recent profile {False}' setting and report any problem with it.
JAIME MERINO: Just use the indicator as it comes by default. It should only show BUY signals, SELL signals and their associated closing signals. From time to time you might want to check 'ADVANCED USER 2' instructions to check that there's actually a divergence. Check also 'ADVANCED USER 1' instructions for your amusement.
EXTRA ADVICE
It's advised that you use this strategy in addition to these two other indicators:
* Squeeze Momentum Indicator
* ADX
so that your chart matches as close as possible to TradingLatino chart.
ZIGNALY INTEGRATION
This strategy supports Zignaly email integration by default. It also supports Zignaly Webhook integration.
ZIGNALY INTEGRATION - Email integration example
What you would write in your alert message:
||{{strategy.order.alert_message}}||key=MYSECRETKEY||
ZIGNALY INTEGRATION - Webhook integration example
What you would write in your alert message:
{ {{strategy.order.alert_message}} , "key" : "MYSECRETKEY" }
CREDITS
I have reused and adapted some code from
'Directional Movement Index + ADX & Keylevel Support' study
which it's from TradingView console user.
I have reused and adapted some code from
'3ema' study
which it's from TradingView hunganhnguyen1193 user.
I have reused and adapted some code from
'Squeeze Momentum Indicator ' study
which it's from TradingView LazyBear user.
I have reused and adapted some code from
'Strategy Tester EMA-SMA-RSI-MACD' study
which it's from TradingView fikira user.
I have reused and adapted some code from
'Support Resistance MTF' study
which it's from TradingView LonesomeTheBlue user.
I have reused and adapted some code from
'TF Segmented Linear Regression' study
which it's from TradingView alexgrover user.
I have reused and adapted some code from
"Poor man's volume profile" study
which it's from TradingView IldarAkhmetgaleev user.
FEEDBACK
Please check the strategy source code for more detailed information
where, among others, I explain all of the substrats
and if they are implemented or not.
Q1. Did I understand wrong any of the Jaime substrats (which I have implemented)?
Q2. The strategy yields quite profit when we should long (EMA10 from 1d timeframe is higher than EMA55 from 1d timeframe.
Why the strategy yields much less profit when we should short (EMA10 from 1d timeframe is lower than EMA55 from 1d timeframe)?
Any idea if you need to do something else rather than just reverse what Jaime does when longing?
FREQUENTLY ASKED QUESTIONS
FAQ1. Why are you giving this strategy for free?
TradingLatino and his fellow enthusiasts taught me this strategy. Now I'm giving back to them.
FAQ2. Seriously! Why are you giving this strategy for free?
I'm confident his strategy might be improved a lot. By keeping it to myself I would avoid other people contributions to improve it.
Now that everyone can contribute this is a win-win.
FAQ3. How can I connect this strategy to my Exchange account?
It seems that you can attach alerts to strategies.
You might want to combine it with a paying account which enable Webhook URLs to work.
I don't know how all of this works right now so I cannot give you advice on it.
You will have to do your own research on this subject. But, be careful. Automating trades, if not done properly,
might end on you automating losses.
FAQ4. I have just found that this strategy by default gives more than 3.97% of 'maximum series of losses'. That's unacceptable according to my risk management policy.
You might want to reduce default stop loss setting from 7% to something like 5% till you are ok with the 'maximum series of losses'.
FAQ5. Where can I learn more about your work on this strategy?
Check the source code. You might find unused strategies. Either because there's not a substantial increases on earnings. Or maybe because they have not been implemented yet.
FAQ6. How much leverage is applied in this strategy?
No leverage.
FAQ7. Any difference with original Jaime Merino strategy?
Most of the times Jaime defines an stop loss at the price entry. That's not the case here. The default stop loss is 7% (but, don't be confused it only means losing 1% of your investment thanks to risk management). There's also a trailing take profit that triggers at 2% profit with a 1% trailing.
FAQ8. Why this strategy return is so small?
The strategy should be improved a lot. And, well, backtesting in this platform is not guaranteed to return theoric results comparable to real-life returns. That's why I'm personally forward testing this strategy to verify it.
MENSAJE EN CASTELLANO
En primer lugar se agradece feedback para mejorar la estrategia.
Si eres un usuario avanzado y quieres colaborar en mejorar el script no dudes en comentar abajo.
Ten en cuenta que aunque toda esta descripción tenga que estar en inglés no es obligatorio que el comentario esté en inglés.
CHISTE - CASTELLANO
¡Pero Jaime!
¡400.000!
¡Tu da mun!

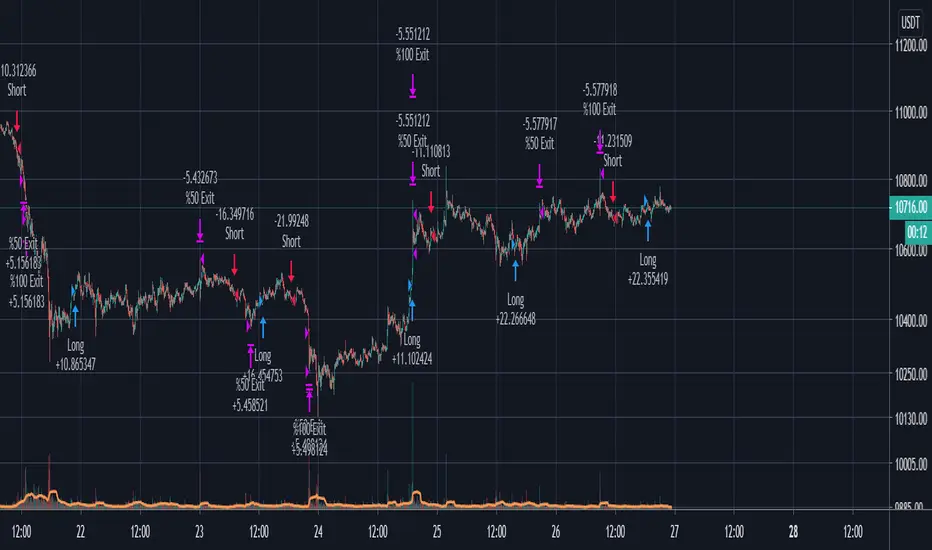
cardi - trend followingTrading strategy tries to get involved in trends at the beginning in the low time frame. Instead of staying flat, the statistical components in the algorithm help strategy to stay in the trend as long as it predicts that buyers or sellers will continue to profit.
Backtest is calculated by using 10% of equity and 0.075% market fee is defined as default. Commission may differ depending on the preferred exchange to trade.
PM us to obtain access.

BV's MACD SIGNAL TESTERHello ladies and gentlemen,
Today, as you may have seen in the title, I have coded a strategy to determine once and for all if MACD could make you money in 2020.
So, at the end of this video, you will know which MACD strategy will bring you the most money.
Spoiler alert: we've hit the 90% WinRAte mark on the Euro New Zealand Dollar chart.
I've seen a lot of videos of people testing different MACD signals, some up to 100 times.
But In my opinion, all traders must rely on statistics to put all the odds on their side and good statistics require a lot more data.
The algorithm I'm showing you tests each signal one by one over a 3 year period and on 28 different graphs.
That way we are sure that we have encountered all possible market behavior.
From phases of congestion to major trends or even the effects of COVID-19
I use the ATR to determine my Stop Loss and Take Profits. The Stop Loss is placed at 1.5 times the ATR, the Take Profit is placed at 1 time the ATR.
If my Take Profit is hit, I take 50% of the profits and let the position run by moving my Stop Loss to Zero.
This way, the position can no longer be a losing position.
If you are not familiar with this practice, I invite you to study the "Scaling out" video from the NoNonsenseForex channel.
BV's Trading Journal.

TREND +SIDEWAYS OPTIMIZED algo signalsThis indicator will try to capture maximum trend of a stock
it will keep trailing stoploss to capture maximum trend
Works best in trendy markets
FEATURES:
Done and backtested on indian stocks.
Trade session and exit session can be specified as inputs.
Optional Stoploss
Specially developed for intraday trading
It would be good to use on normal candlesticks and time frame between (3 to 15 min)
INPUTS:
TRADE FREQUENCY: it can be an integer from from 1 to 5 , Frequency denotes the trading frequency,
low frequency will take less number of trades and will have HIGHER risk rewads (to use lowest frequency 1 )
High freqency it will take more trades and with less profits good for scalpers , it will have low risk and low reward)
Frequency requirement can be given between 1 to 5 , 1 is the lowest and 5 is the Highest frequency
Sideways Bias:
This is an extra filter to reduce the loss in sideways movement,
Your sideways bias can be given between 0 to 3
0 if No bias on sideways
3 if biased on sideways
Reduce the risk filter:
This would try to bok profit quickly and begginers can use this
Optional stoploss:
you can define your risk in points
Trade Quantity:This is quantity you want to trade on particular day, it is used to plot buy or sell quantity on chart (quantity is not taken into consideration in backtest)
Trade session: Session for entries can be specified
Exit session: session for exit can be specified
Custom Bactesting:
This is to provide backtesting results of a stock in given range of dates

CROSSOVER LONG N SHORTThis is a algo bot which identifies the trend with the help of ema and give buy signals..
It is backtested personaly by me and has shown good results
This script is intended to educational purpose only ...
Enigma (STRATEGY)Based on volatility algorithm that measures changes in market prices over a period of time.
Trading Rules
1. Go long when the buy signal appears.
2. Go short when the sell signal appears.
3. Close the position when the take profit signal appears.
4. Risk 2-5% of porfolio max.
5. Use stop loss of 3% from entry.
Please PM me for access.

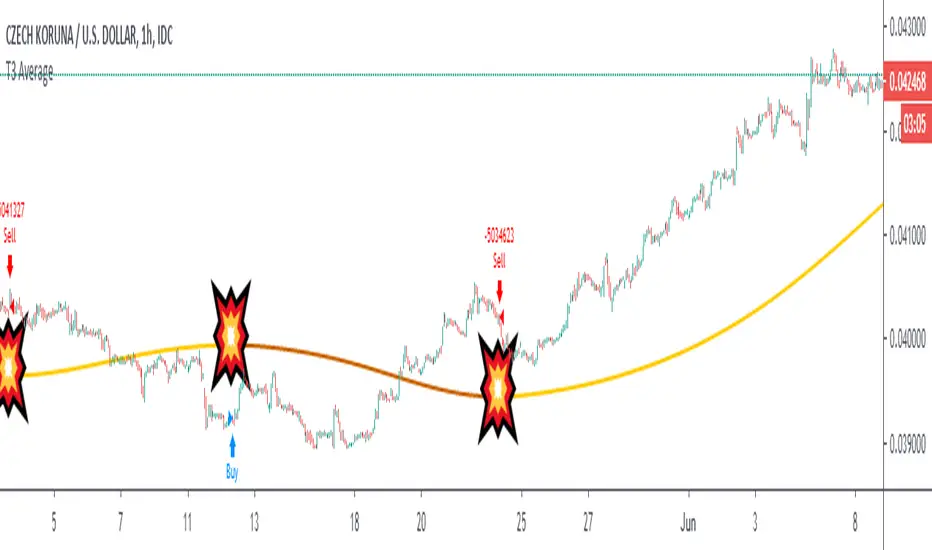
T3 Explosive Moving Average BacktestA simple backtesting algorithm for my joke indicator T Explosive Moving Average
• Buys when it starts to ascend
• Sells when it starts to descend
• Switch the wires to reverse this logic
Some currencies show good results with 75 on daily, 65 (reverse wires) on 4h and 210 (reverse wires) on 1h
To be clear, this strategy has no stop-loss which leads to large drawdowns and unreliability of the backtesting data. It shows some performance but it is still a joke. And unless you like T3 moving average calculation, don't use it, perhaps.
VK trend scalper 30mThis strategy is designed to be used on the 30 minute time frame
In this strategy, I actually implemented my own scalping style into building the strategy. Having to replicate my own trading strategy into an algorithm, I can't make it exactly perfect to how I would trade, but what I can do is try and program the parameters that give it the absolute best chance of making a big move with a small drawdown- which replicates part of my trend trading style. Here I am using VWMA , EMA and trend filtering values to find trend change and best entries.
you can also try it on any cryptocurrency/forex/commodity/stocks
*This script is currently experimental you can try it if you want.

Twin Range Filter Algo@Colinmck used two different ranges to generate signals. Read his release notes to find out what the original script does.
I added one condition which seems to increase performance on 15m BTCUSD as well as 1h BTCUSD and that is ATR with 32 periods being smaller than ATR with 64 periods. I used my script Volatility Optimiser to discover this tendency.
Both buying and selling conditions are same as in @Colinmck's script plus one condition of my own. You can disable my condition.
Target and stop-loss are manually set values in ticks.
Time stop-loss is manually set value in a number of candles. After this number of candles, a position always exits (or should 😇). You can disable it by inserting a very long period. I do not recommend it, because a value of indicator should not be measured in luck and if market starts moving in the direction after 40 periods, the predictive capability of an indicator is questionable.
I used 300/150/17 for 15m BTCUSD chart and 900/30/17 for 1h BTCUSD. I didn't try to optimize any other parameters for these periods.
Since this script relies mostly on volatility for its prediction, I wouldn't recommend using it on its own. Individual approach to the market is recommended. Also, it didn't work on EURUSD when using the same default values and different order management (tp, sl, time sl), so it is probably not as versatile.
Let me know what do you think of this strategy. If you have some ideas about how to make it more reliable, share it in the comments, I might put it to the test. Good luck 🍀

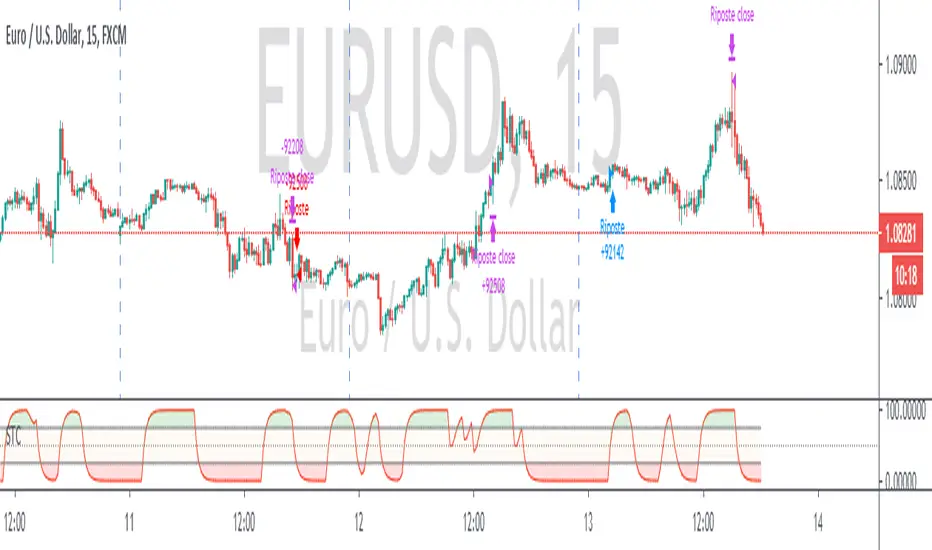
Schaff Trend Cycle + Double MAThis strategy uses two different moving averages to determine a trend. It opens a position on a pullback from a trend.
Conditions for buy signal are:
►Crossover out of Shaff Trend Cycle's extreme levels
►The price is above its short period exponential moving average.
►A short period exponential moving average is above a long period exponential moving average.
*Conditions for sell are the opposite.
All in all, I don't think it needs to be on your chart but it can be optimized and even successful on some timeframes.
Shaff Trend Cycle solution was provided by @everget, I converted his script to Pine v.4, added exponential averages and created an algorithm for backtesting.
BKN: Hickory Smoked StrategyThis strategy is to be used with the BKN: Hickory Smoked Indicator. This is a strategy that thrives in trending environments. We've included settings for crypto and forex and lower speed options for lower timeframes.
The script offers a stop loss or trailing stop loss that will trigger when an entry is triggered. You can also choose to use it as long or short only. Pictured is the LONG only settings.
You can use this strategy to backtest settings for the indicator.
***IMPORTANT***
For access, please do not comment below. Instead, send a DM here on TradingView or on my linked Twitter account.

The MATRIX: Ultimate Crypto Position StrategyHi all,
We are cryptocurrency miners and 'hodlers’ since 2013, with unwavering confidence in the technology behind it. We’d always thought that it would be a life-changing êvent. And we were right. We went from “broke” to making shit loads of money and all the way back to bitter nothing. If you are lucky, you probably haven’t experienced what if feels to be high on cash and then fall very deep low, but let me reassure you, it is a nasty feeling.
Then we wondered, what the hell did we do wrong? Or better say, what didn’t we do right! The answer was dead simple: We had no experience in trading, we were overwhelmed by emotions and we didn't use any trading strategy. Hence, we were doomed to fail from the beginning.
In order to build an all-in-one profitable trading strategy, we had to start from zero. The one thing we learned is that your goal for financial gain cannot be achieved without discipline and consistency. Our prime focus was to absorb as much info as possible regarding trading and coding by doing an extensive self-study, which consequentially took us to the next level.
One of the secrets to being successful from a trading perspective is to have an indefatigable and undying thirst for information and knowledge. As Bruce Lee once said: “Learning is never cumulative; it is a movement of knowing which has no beginning nor end”. So, we adapted what was useful, rejected what was useless, and added our own preferences based on our mindset. We were totally committed to be the best. Our goal was never to lose money again! Of course, this is an illusion, as no single strategy is correct all of the time.
Therefore, the final trading strategy was based on the following key elements:
• The avoidance of risk is more important than absolute profit. Do not anticipate and do not move without market confirmation. Being a little late in your trade is your indication if you are right or wrong.
• Offering simplicity and practicality, for those that do not have the time to trade 24/7.
• Believe in analysis and not in forecasting. Trading is a skill for those who are smart and gambling for those who are not.
In conclusion, we are absolutely thrilled to finally release this trading strategy after one year of extensive back testing and optimization. The script was supposed to be for personal use only, but because Tradingview has helped us a lot in this process, we want to share it with all of you and give something back to this amazing community. If you learned something new today and found value, please give us a like to show your support! We’d really appreciate it.
***The script is invite-only, message us to get script access***
-------------------------------------------------------------------------------------------------
The MATRIX: Ultimate Crypto Position Strategy should be used as follows:
• The trading strategy was designed and optimized for trading cryptocurrencies only ; furthermore it works best on established high market cap cryptocurrencies that have a clear trend such as:
BTCUSD
ETHUSD
LTCUSD
XRMUSD
EOSUSD
ADAUSD
DASHUSD
ETCUSD
• The trading strategy is based on swing/position methodology. The script must therefore be used on daily timeframe candles only (1D) .
• Use USD trading pairs only (e.g. use ETHUSD instead of the ETHBTC) since the individual trend is captured more effectively and therefore gives better results.
-------------------------------------------------------------------------------------------------
The MATRIX:Ultimate Crypto Position Strategy is based on the following indicators:
• Ichimoku Cloud ; acts as the leading indicator.
• Volume ; without strong volume , a market move is not valid.
• MACD and Vortex ; both being used as confirmation indicators.
• Choppiness index ; avoids trading in choppy markets.
• Bullish/ Bearish Regular Divergences in combination with RSI to spot tops and bottoms.
• Simple and Exponential Moving Averages ; prêvents trading against the trend.
The trading strategy is easy to use, trend based and without repainting, meaning once a signal has been made it is permanent and that no future data is used in the decision making. It detects the trend and filters out market noise based on more than 10 technical indicators. ONLY when all indicators align with each other the algorithm prints a BUY or SELL signal. The trading strategy provides high probability trading signals and minimizes risk! This script aims to capture the profit from longer term trending moves and by doing so filters out non-substantial trends and avoids the associated risks with these trades.
-------------------------------------------------------------------------------------------------
The MATRIX: Ultimate Crypto Position Strategy has the following features:
• Automatically generated Buy / Sell alerts in the form of a label.
• NO Repaint once candle is closed.
• SAFEGUARD ; custom built-in security prevẹnts trading when the price is out of equilibrium.
• Customizable Display for the Ichimoku cloud indicator display.
-------------------------------------------------------------------------------------------------
Below are the backtest results. Keep in mind that this strategy is quite conservative resulting in few long positions. These results are therefore no guarantee for the future.
Back test results: (only Long trades, signal to signal, order size: 100% of equity, commision fee 0.1%, period: start of chart)
Exchange-----Asset---------Timeframe---Percent Profitable----Profit Factor-----Total Trades----Max Drawdown---Average bars in trade-----Net Profit
Coinbase-----BTC/USD---------1D----------------100----------------N/A------------------10---------------0.00---------------------54-------------------6183.6
Coinbase-----ETH/USD---------1D----------------100----------------N/A------------------7----------------0.00---------------------46-------------------11673.0
Coinbase-----LTC/USD---------1D-----------------100---------------N/A-------------------7----------------0.00---------------------46------------------4727.0
Bínance------EOS/USD---------1D-----------------100---------------N/A-------------------3----------------0.00---------------------34------------------42.8
Bínance------ADA/USD---------1D-----------------100---------------N/A-------------------2----------------0.00---------------------40------------------118.4
Coinbase-----XTZ/USD---------1D-----------------100---------------N/A-------------------1----------------0.00---------------------36------------------34.4
Bínance------BNB/USD---------1D-----------------66.7--------------10.8-------------------6---------------24.22--------------------38------------------1488.8
Bínance------ETC/USD---------1D-----------------100---------------N/A-------------------2----------------0.00---------------------33------------------94.9
Bínance------XMR/USD---------1D-----------------100---------------N/A-------------------3----------------0.00---------------------43------------------74.2
Bínance------ICX/USD----------1D-----------------100---------------N/A-------------------2----------------0.00---------------------29------------------215.3
-------------------------------------------------------------------------------------------------
Reminder: Use this trading strategy at your own risk and trade responsibly. We are not responsible for any financial loss using this strategy.
***The script is invite-only, message us to get script access***

888 BOT #backtest█ 888 BOT #backtest
This is an Expert Advisor 'EA' or Automated trading script for ‘longs’ and ‘shorts’, which uses only a Take Profit or, in the worst case, a Stop Loss to close the trade.
It's a much improved version of the previous ‘Repanocha’. It doesn`t use 'Trailing Stop' or 'security()' functions (although using a security function doesn`t mean that the script repaints) and all signals are confirmed, therefore the script doesn`t repaint in alert mode and is accurate in backtest mode.
Apart from the previous indicators, some more and other functions have been added for Stop-Loss, re-entry and leverage.
It uses 8 indicators, (many of you already know what they are, but in case there is someone new), these are the following:
1. Jurik Moving Average
It's a moving average created by Mark Jurik for professionals which eliminates the 'lag' or delay of the signal. It's better than other moving averages like EMA, DEMA, AMA or T3.
There are two ways to decrease noise using JMA. Increasing the 'LENGTH' parameter will cause JMA to move more slowly and therefore reduce noise at the expense of adding 'lag'
The 'JMA LENGTH', 'PHASE' and 'POWER' parameters offer a way to select the optimal balance between 'lag' and over boost.
Green: Bullish, Red: Bearish.
2. Range filter
Created by Donovan Wall, its function is to filter or eliminate noise and to better determine the price trend in the short term.
First, a uniform average price range 'SAMPLING PERIOD' is calculated for the filter base and multiplied by a specific quantity 'RANGE MULTIPLIER'.
The filter is then calculated by adjusting price movements that do not exceed the specified range.
Finally, the target ranges are plotted to show the prices that will trigger the filter movement.
Green: Bullish, Red: Bearish.
3. Average Directional Index (ADX Classic) and (ADX Masanakamura)
It's an indicator designed by Welles Wilder to measure the strength and direction of the market trend. The price movement is strong when the ADX has a positive slope and is above a certain minimum level 'ADX THRESHOLD' and for a given period 'ADX LENGTH'.
The green color of the bars indicates that the trend is bullish and that the ADX is above the level established by the threshold.
The red color of the bars indicates that the trend is down and that the ADX is above the threshold level.
The orange color of the bars indicates that the price is not strong and will surely lateralize.
You can choose between the classic option and the one created by a certain 'Masanakamura'. The main difference between the two is that in the first it uses RMA () and in the second SMA () in its calculation.
4. Parabolic SAR
This indicator, also created by Welles Wilder, places points that help define a trend. The Parabolic SAR can follow the price above or below, the peculiarity that it offers is that when the price touches the indicator, it jumps to the other side of the price (if the Parabolic SAR was below the price it jumps up and vice versa) to a distance predetermined by the indicator. At this time the indicator continues to follow the price, reducing the distance with each candle until it is finally touched again by the price and the process starts again. This procedure explains the name of the indicator: the Parabolic SAR follows the price generating a characteristic parabolic shape, when the price touches it, stops and turns (SAR is the acronym for 'stop and reverse'), giving rise to a new cycle. When the points are below the price, the trend is up, while the points above the price indicate a downward trend.
5. RSI with Volume
This indicator was created by LazyBear from the popular RSI.
The RSI is an oscillator-type indicator used in technical analysis and also created by Welles Wilder that shows the strength of the price by comparing individual movements up or down in successive closing prices.
LazyBear added a volume parameter that makes it more accurate to the market movement.
A good way to use RSI is by considering the 50 'RSI CENTER LINE' centerline. When the oscillator is above, the trend is bullish and when it is below, the trend is bearish.
6. Moving Average Convergence Divergence (MACD) and (MAC-Z)
It was created by Gerald Appel. Subsequently, the histogram was added to anticipate the crossing of MA. Broadly speaking, we can say that the MACD is an oscillator consisting of two moving averages that rotate around the zero line. The MACD line is the difference between a short moving average 'MACD FAST MA LENGTH' and a long moving average 'MACD SLOW MA LENGTH'. It's an indicator that allows us to have a reference on the trend of the asset on which it is operating, thus generating market entry and exit signals.
We can talk about a bull market when the MACD histogram is above the zero line, along with the signal line, while we are talking about a bear market when the MACD histogram is below the zero line.
There is the option of using the MAC-Z indicator created by LazyBear, which according to its author is more effective, by using the parameter VWAP (volume weighted average price) 'Z-VWAP LENGTH' together with a standard deviation 'STDEV LENGTH' in its calculation.
7. Volume Condition
Volume indicates the number of participants in this war between bulls and bears, the more volume the more likely the price will move in favor of the trend. A low trading volume indicates a lower number of participants and interest in the instrument in question. Low volumes may reveal weakness behind a price movement.
With this condition, those signals whose volume is less than the volume SMA for a period 'SMA VOLUME LENGTH' multiplied by a factor 'VOLUME FACTOR' are filtered. In addition, it determines the leverage used, the more volume, the more participants, the more probability that the price will move in our favor, that is, we can use more leverage. The leverage in this script is determined by how many times the volume is above the SMA line.
The maximum leverage is 8.
8. Bollinger Bands
This indicator was created by John Bollinger and consists of three bands that are drawn superimposed on the price evolution graph.
The central band is a moving average, normally a simple moving average calculated with 20 periods is used. ('BB LENGTH' Number of periods of the moving average)
The upper band is calculated by adding the value of the simple moving average X times the standard deviation of the moving average. ('BB MULTIPLIER' Number of times the standard deviation of the moving average)
The lower band is calculated by subtracting the simple moving average X times the standard deviation of the moving average.
the band between the upper and lower bands contains, statistically, almost 90% of the possible price variations, which means that any movement of the price outside the bands has special relevance.
In practical terms, Bollinger bands behave as if they were an elastic band so that, if the price touches them, it has a high probability of bouncing.
Sometimes, after the entry order is filled, the price is returned to the opposite side. If price touch the Bollinger band in the same previous conditions, another order is filled in the same direction of the position to improve the average entry price, (% MINIMUM BETTER PRICE ': Minimum price for the re-entry to be executed and that is better than the price of the previous position in a given %) in this way we give the trade a chance that the Take Profit is executed before. The downside is that the position is doubled in size. 'ACTIVATE DIVIDE TP': Divide the size of the TP in half. More probability of the trade closing but less profit.
█ STOP LOSS and RISK MANAGEMENT.
A good risk management is what can make your equity go up or be liquidated.
The % risk is the percentage of our capital that we are willing to lose by operation. This is recommended to be between 1-5%.
% Risk: (% Stop Loss x % Equity per trade x Leverage) / 100
First the strategy is calculated with Stop Loss, then the risk per operation is determined and from there, the amount per operation is calculated and not vice versa.
In this script you can use a normal Stop Loss or one according to the ATR. Also activate the option to trigger it earlier if the risk percentage is reached. '% RISK ALLOWED'
'STOP LOSS CONFIRMED': The Stop Loss is only activated if the closing of the previous bar is in the loss limit condition. It's useful to prevent the SL from triggering when they do a ‘pump’ to sweep Stops and then return the price to the previous state.
█ BACKTEST
The objective of the Backtest is to evaluate the effectiveness of our strategy. A good Backtest is determined by some parameters such as:
- RECOVERY FACTOR: It consists of dividing the 'net profit' by the 'drawdown’. An excellent trading system has a recovery factor of 10 or more; that is, it generates 10 times more net profit than drawdown.
- PROFIT FACTOR: The ‘Profit Factor’ is another popular measure of system performance. It's as simple as dividing what win trades earn by what loser trades lose. If the strategy is profitable then by definition the 'Profit Factor' is going to be greater than 1. Strategies that are not profitable produce profit factors less than one. A good system has a profit factor of 2 or more. The good thing about the ‘Profit Factor’ is that it tells us what we are going to earn for each dollar we lose. A profit factor of 2.5 tells us that for every dollar we lose operating we will earn 2.5.
- SHARPE: (Return system - Return without risk) / Deviation of returns.
When the variations of gains and losses are very high, the deviation is very high and that leads to a very poor ‘Sharpe’ ratio. If the operations are very close to the average (little deviation) the result is a fairly high 'Sharpe' ratio. If a strategy has a 'Sharpe' ratio greater than 1 it is a good strategy. If it has a 'Sharpe' ratio greater than 2, it is excellent. If it has a ‘Sharpe’ ratio less than 1 then we don't know if it is good or bad, we have to look at other parameters.
- MATHEMATICAL EXPECTATION: (% winning trades X average profit) + (% losing trades X average loss).
To earn money with a Trading system, it is not necessary to win all the operations, what is really important is the final result of the operation. A Trading system has to have positive mathematical expectation as is the case with this script: ME = (0.87 x 30.74$) - (0.13 x 56.16$) = (26.74 - 7.30) = 19.44$ > 0
The game of roulette, for example, has negative mathematical expectation for the player, it can have positive winning streaks, but in the long term, if you continue playing you will end up losing, and casinos know this very well.
PARAMETERS
'BACKTEST DAYS': Number of days back of historical data for the calculation of the Backtest.
'ENTRY TYPE': For '% EQUITY' if you have $ 10,000 of capital and select 7.5%, for example, your entry would be $ 750 without leverage. If you select CONTRACTS for the 'BTCUSDT' pair, for example, it would be the amount in 'Bitcoins' and if you select 'CASH' it would be the amount in $ dollars.
'QUANTITY (LEVERAGE 1X)': The amount for an entry with X1 leverage according to the previous section.
'MAXIMUM LEVERAGE': It's the maximum allowed multiplier of the quantity entered in the previous section according to the volume condition.
The settings are for Bitcoin at Binance Futures (BTC: USDTPERP) in 30 minutes.
For other pairs and other timeframes, the settings have to be adjusted again. And within a month, the settings will be different because we all know the market and the trend are changing.
█ 888 BOT (SPANISH)
Este es un Expert Advisor 'EA' o script de trading automatizado para ‘longs’ y ‘shorts’, el cual, utiliza solo un Take Profit o, en el peor de los casos, un Stop Loss para cerrar el trade.
Es una versión muy mejorada del anterior ‘Repanocha’. No utiliza ‘Trailing Stop’, ni funciones ‘security()’ (aunque usar una función security no significa que el script repinte) y todas las señales son confirmadas, por consiguiente, el script no repinta en modo alertas y es preciso en en el modo backtest.
Aparte de los anteriores indicadores se han añadido algunos más y otras funciones para Stop-Loss, de re-entrada y apalancamiento.
Utiliza 8 indicadores, (muchos ya sabéis sobradamente lo que son, pero por si hay alguien nuevo), son los siguientes:
1. Jurik Moving Average
Es una media móvil creada por Mark Jurik para profesionales la cual elimina el ‘lag’ o retardo de la señal. Es mejor que otras medias móviles como la EMA, DEMA, AMA o T3.
Hay dos formas de disminuir el ruido utilizando JMA. El aumento del parámetro 'LENGTH' hará que JMA se mueva más lentamente y, por lo tanto, reducirá el ruido a expensas de añadir ‘lag’
Los parámetros 'JMA LENGTH', 'PHASE' y 'POWER' ofrecen una forma de seleccionar el equilibrio óptimo entre ‘lag’ y sobre impulso.
Verde : Alcista, Rojo: Bajista.
2. Range filter
Creado por Donovan Wall, su función es la de filtrar o eliminar el ruido y poder determinar mejor la tendencia del precio a corto plazo.
Primero, se calcula un rango de precio promedio uniforme 'SAMPLING PERIOD' para la base del filtro y se multiplica por una cantidad específica 'RANGE MULTIPLIER'.
A continuación, el filtro se calcula ajustando los movimientos de precios que no exceden el rango especificado.
Por último, los rangos objetivo se trazan para mostrar los precios que activarán el movimiento del filtro.
Verde : Alcista, Rojo: Bajista.
3. Average Directional Index (ADX Classic) y (ADX Masanakamura)
Es un indicador diseñado por Welles Wilder para medir la fuerza y dirección de la tendencia del mercado. El movimiento del precio tiene fuerza cuando el ADX tiene pendiente positiva y está por encima de cierto nivel mínimo 'ADX THRESHOLD' y para un periodo dado 'ADX LENGTH'.
El color verde de las barras indica que la tendencia es alcista y que el ADX está por encima del nivel establecido por el threshold.
El color Rojo de las barras indica que la tendencia es bajista y que el ADX está por encima del nivel de threshold.
El color naranja de las barras indica que el precio no tiene fuerza y seguramente lateralizará.
Se puede elegir entre la opción clásica y la creada por un tal 'Masanakamura'. La diferencia principal entre los dos es que en el primero utiliza RMA() y en el segundo SMA() en su cálculo.
4. Parabolic SAR
Este indicador, creado también por Welles Wilder, coloca puntos que ayudan a definir una tendencia. El Parabolic SAR puede seguir al precio por encima o por debajo, la particularidad que ofrece es que cuando el precio toca al indicador, este salta al otro lado del precio (si el Parabolic SAR estaba por debajo del precio salta arriba y viceversa) a una distancia predeterminada por el indicador. En este momento el indicador vuelve a seguir al precio, reduciendo la distancia con cada vela hasta que finalmente es tocado otra vez por el precio y se vuelve a iniciar el proceso. Este procedimiento explica el nombre del indicador: el Parabolic SAR va siguiendo al precio generando una característica forma parabólica, cuando el precio lo toca, se para y da la vuelta (SAR son las siglas en inglés de ‘stop and reverse’), dando lugar a un nuevo ciclo. Cuando los puntos están por debajo del precio, la tendencia es alcista, mientras que los puntos por encima del precio indica una tendencia bajista.
5. RSI with Volume
Este indicador lo creo un tal LazyBear de TV a partir del popular RSI.
El RSI es un indicador tipo oscilador utilizado en análisis técnico y creado también por Welles Wilder que muestra la fuerza del precio mediante la comparación de los movimientos individuales al alza o a la baja de los sucesivos precios de cierre.
LazyBear le añadió un parámetro de volumen que lo hace más preciso al movimiento del mercado.
Una buena forma de usar el RSI es teniendo en cuenta la línea central de 50 'RSI CENTER LINE'. Cuando el oscilador está por encima, la tendencia es alcista y cuando está por debajo la tendencia es bajista.
6. Moving Average Convergence Divergence (MACD) y (MAC-Z)
Fue creado por Gerald Appel. Posteriormente se añadió el histograma para anticipar el cruce de medias. A grandes rasgos podemos decir que el MACD es un oscilador consistente en dos medias móviles que van girando en torno a la línea de cero. La línea del MACD no es más que la diferencia entre una media móvil corta 'MACD FAST MA LENGTH' y una media móvil larga 'MACD SLOW MA LENGTH'. Es un indicador que nos permite tener una referencia sobre la tendencia del activo sobre el cual se está operando, generando de este modo señales de entrada y salida del mercado.
Podemos hablar de mercado alcista cuando el histograma del MACD se sitúe por encima de la línea cero, junto con la línea de señal, mientras que hablaremos de mercado bajista cuando el histograma MACD se situará por debajo de la línea cero.
Está la opción de utilizar el indicador MAC-Z creado por LazyBear que según su autor es más eficaz, por utilizar el parámetro VWAP (precio medio ponderado por volumen) 'Z-VWAP LENGTH' junto con una desviación standard 'STDEV LENGTH' en su cálculo.
7. Volume Condition
El volumen indica el número de participantes en esta guerra entre toros y osos, cuanto más volumen más probabilidad de que se mueva el precio a favor de la tendencia. Un volumen bajo de negociación indica un menor número de participantes e interés por el instrumento en cuestión. Los bajos volúmenes pueden revelar debilidad detrás de un movimiento de precios.
Con esta condición se filtran aquellas señales cuyo volumen es inferior a la SMA de volumen para un periodo 'SMA VOLUME LENGTH' multiplicado por un factor 'VOLUME FACTOR'. Además, determina el apalancamiento utilizado, a más volumen, más participantes, más probabilidad de que se mueva el precio a nuestro favor, es decir, podemos utilizar más apalancamiento. El apalancamiento en este script lo determina las veces que está el volumen por encima de la línea de la SMA.
El apalancamiento máximo es de 8.
8. Bollinger Bands
Este indicador fue creado por John Bollinger y consiste en tres bandas que se dibujan superpuestas al gráfico de evolución del precio.
La banda central es una media móvil, normalmente se emplea una media móvil simple calculada con 20 períodos. ('BB LENGTH' Número de periodos de la media móvil)
La banda superior se calcula sumando al valor de la media móvil simple X veces la desviación típica de la media móvil. ('BB MULTIPLIER' Número de veces la desviación típica de la media móvil)
La banda inferior de calcula restando a la media móvil simple X veces la desviación típica de la media móvil.
la franja comprendida entre las bandas superior e inferior contiene, estadísticamente, casi un 90% de las posibles variaciones del precio, lo que significa que cualquier movimiento del precio fuera de las bandas tiene especial relevancia.
En términos prácticos, las bandas de Bollinger se comporta como si de una banda elástica se tratara de manera que, si el precio las toca, éste tiene mucha probabilidad de rebotar.
En ocasiones, después de rellenarse la orden de entrada, el precio se devuelve hacia el lado contrario. Si toca la banda de Bollinger se rellena otra orden en la misma dirección de la posición para mejorar el precio medio de entrada, (% MINIMUM BETTER PRICE': Precio mínimo para que se ejecute la re-entrada y que sea mejor que el precio de la posición anterior en un % dado) de esta manera damos una oportunidad al trade de que el Take Profit se ejecute antes. La desventaja es que se dobla el tamaño de la posición. 'ACTIVATE DIVIDE TP': Divide el tamaño del TP a la mitad. Más probabilidad de que se cierre el trade pero menos ganancias.
█ STOP LOSS y RISK MANAGEMENT.
Una buena gestión de las pérdidas o gestión del riesgo es lo que puede hacer que tu cuenta suba o se liquide en poco tiempo.
El % de riesgo es el porcentaje de nuestro capital que estamos dispuestos a perder por operación. Este se aconseja que debe estar comprendido entre un 1-5%.
% Risk = (% Stop Loss x % Equity per trade x Leverage) / 100
Primero se calcula la estrategia con Stop Loss, después se determina el riesgo por operación y a partir de ahí se calcula el monto por operación y no al revés.
En este script puedes usar un Stop Loss normal o uno según el ATR. También activar la opción de que salte antes si se alcanza el porcentaje de riesgo. '% RISK ALLOWED'
'STOP LOSS CONFIRMED': Solamente se activa el Stop Loss si el cierre de la barra anterior se encuentra en la condición de límite de pérdidas. Es útil para evitar que se dispare el SL cuando hacen un ‘pump’ para barrer Stops y luego se devuelve el precio a la normalidad.
█ BACKTEST
El objetivo del Backtest es evaluar la eficacia de nuestra estrategia. Un buen Backtest lo determinan algunos parámetros como son:
- RECOVERY FACTOR: Consiste en dividir el ‘beneficio neto’ entre el ‘drawdown’. Un excelente sistema de trading tiene un recovery factor de 10 o más; es decir, genera 10 veces más beneficio neto que drawdown.
- PROFIT FACTOR: El ‘Profit Factor’ es otra medida popular del rendimiento de un sistema. Es algo tan simple como dividir lo que ganan las operaciones con ganancias entre lo que pierden las operaciones con pérdidas. Si la estrategia es rentable entonces por definición el ‘Profit Factor’ va a ser mayor que 1. Las estrategias que no son rentables producen factores de beneficio menores que uno. Un buen sistema tiene un profit factor de 2 o más. Lo bueno del ‘Profit Factor’ es que nos dice lo que vamos a ganar por cada dolar que perdemos. Un profit factor de 2.5 nos dice que por cada dolar que perdamos operando vamos a ganar 2.5.
- SHARPE: (Retorno sistema – Retorno sin riesgo) / Desviación de los retornos.
Cuando las variaciones de ganancias y pérdidas son muy altas, la desviación es muy elevada y eso conlleva un ratio de ‘Sharpe’ muy pobre. Si las operaciones están muy cerca de la media (poca desviación) el resultado es un ratio de ‘Sharpe’ bastante elevado. Si una estrategia tiene un ratio de ‘Sharpe’ mayor que 1 es una buena estrategia. Si tiene un ratio de ‘Sharpe’ mayor que 2, es excelente. Si tiene un ratio de ‘Sharpe’ menor que 1 entonces no sabemos si es buena o mala, hay que mirar otros parámetros.
- MATHEMATICAL EXPECTATION:(% operaciones ganadoras X ganancia media) + (% operaciones perdedoras X pérdida media).
Para ganar dinero con un sistema de Trading, no es necesario ganar todas las operaciones, lo verdaderamente importante es el resultado final de la operativa. Un sistema de Trading tiene que tener esperanza matemática positiva como es el caso de este script.
El juego de la ruleta, por ejemplo, tiene esperanza matemática negativa para el jugador, puede tener rachas positivas de ganancias, pero a la larga, si se sigue jugando se acabará perdiendo, y esto los casinos lo saben muy bien.
PARAMETROS
'BACKTEST DAYS': Número de días atrás de datos históricos para el calculo del Backtest.
'ENTRY TYPE': Para % EQUITY si tienes 10000$ de capital y seleccionas 7.5% tu entrada sería de 750$ sin apalancamiento. Si seleccionas CONTRACTS para el par BTCUSDT sería la cantidad en Bitcoins y si seleccionas CASH sería la cantidad en dólares.
'QUANTITY (LEVERAGE 1X)': La cantidad para una entrada con apalancamiento X! según el apartado anterior.
'MAXIMUM LEVERAGE': Es el máximo multiplicador permitido de la cantidad introducida en el apartado anterior según la condición de volumen.
Los settings son para Bitcoin en Binance Futures (BTC:USDTPERP) en 30 minutos.
Para otro pares y otras temporalidades se tienen que ajustar las opciones de nuevo. Además para dentro de un mes, los ajustes serán otros distintos ya que el mercado y la tendencia es cambiante.

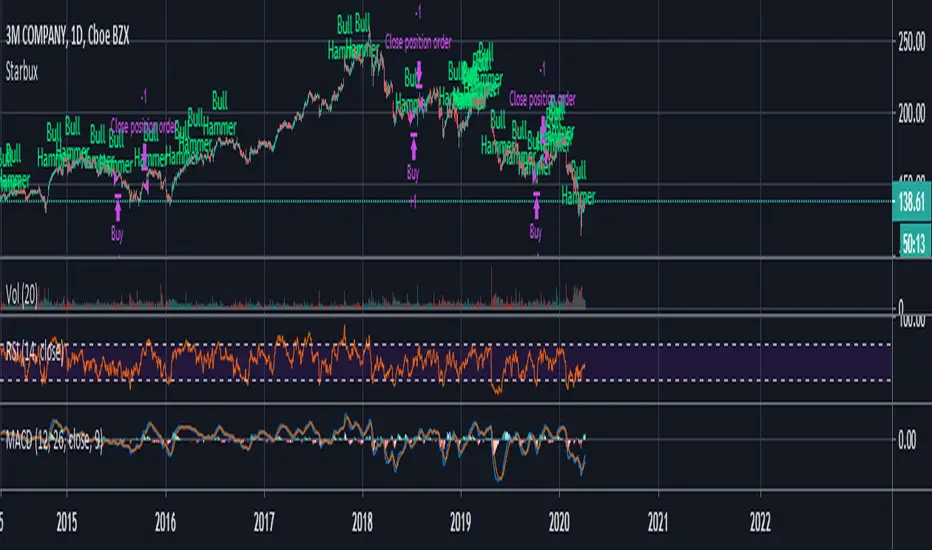
StarbuxI made this in starbucks .
Bullish hammer trading signal algorithm
using MACD for trend determination and holding period.
Underworld Hunter Backtesting AlgorhitmThis strategy is built to prove the profitability of my Underworld Hunter indicator . It tests two different strategies. I won't be going into the calculation again since it is part of the original script. I just made a few adjustments.
First one is clearly visual. It plots slimmer twin-coloured lines now and has a different colour for every extreme level. Second is less obvious - I switched Relative Strength Index for Commodity Channel Index.
Extreme levels are as follows: green 100 -► 120, yellow 120 -► 140, orange 140 -► 160, red 160 -► 180 and purple above 180, I will have a special separate algorithm for testing optimal CCI levels someday, in this script, these values are only meant to help you with manual operations and do not influence results of the strategy in any way.
#Trending strategy
The trending strategy opens a position whenever the price leaves the bands and holds it until two consecutive bars are closed within the bands. The picture shows one winning position that hasn't yet been resulted. It also shows a few fakeouts. For this strategy, you want to keep the length below 110, the deviation should be below 2 and you probably want to play lower timeframes.
#Within the bands
The second strategy is pretty much the opposite. It opens a position when the price reaches outer bands and holds it until two consecutive bars are closed within the bands and current bar closes below previous bars low in case of long. It is working on hourly timeframes and you need higher length and deviation to succeed. The picture shows a few positions on EURUSD. Each of them is profitable but would be much higher if you closed it manually when it was time. You need to enable this strategy, which automatically disables the other one.
When using my script, you need to bear in mind that the first strategy doesn't detect optimal levels to close the price. A trend is often followed by a less volatile and boring correction which causes bands to shrink and lower your profits if you don't close manually as it will take longer till bands are reached.
On the other hand, second script literally has no stop-loss. As long as the price is outside the range, it will never close which will cause major drawdowns, unless you control the trade manually. CCI is here to help you with both.
I also recommend combining this with Market Profile (on TW, there is only Volume Profile, which can be used in a similar way) and trading day theory (trending with multiple distributions, trending day, normal day, a variation on a normal day, non-trending day or neutral day). Always keep in mind that it is up to traders to be profitable, indicators can support a good trader, but they will not fix a bad one.

Profit Sniper 2.0 | BACKTESTProfit Sniper 2.0 Backtest now offering up huge improvements, including multiple position triggers, derived from Bollinger Bands and Chande Momentum as well as our own bespoke stochastic ribbons that provide trend pivots .
Profit Sniper now works with regular Japanese candles, however, still provides the flexibility of Heiken Ashi settings for certain elements of the indicator, this allows the accuracy of Japanese candlestick prices, and the smooth trends of HA.
Profit Sniper 2.0 has been specifically re-written for use with automation, including our own in-house trading robot known as C.A.T (Crypto Algo Trader) and as such we have chosen to remove several noisy elements of the now defunct Profit Sniper that were underused, such as the PPO and RSI variants.
Another big decision was to remove the MACD from the indicator package, as invariably users preferred using the built in MACD .
So how does it work?
HUNT
In true Sniper fashion, when our stochastic HA ribbons pivot between short and long trends, the indicator will offer up a colour coded flag the says “1. HUNT” green for long, red for short.
SIGHT
At this stage, the indicator is now looking for a second condition, this is displayed as “2. Sight” at this point the indicator as noticed a drop in the previous momentum, to pre-empt a flip between long and short. Red is for short, green is for Long
FIRE
The final condition to be met, is based on the positioning of the Bollinger Bands , which is show as the “3. Fire Flag” again, as with hunt and sight, red is for short and green is for long.
User parameters allow traders to add trailing stop, toggle between percentage and USD value, as well as edit all the indicator settings in both HA and JPY Candles providing higher accuracy in the forecast rate.
** Please note, that trade execution occurs at the open of the candle after the FIRE condition is met, this means that it is likely that the back test may throw up slightly worse results than in real time trading with using CAT as CAT will execute on Bollinger moving average line in real time.

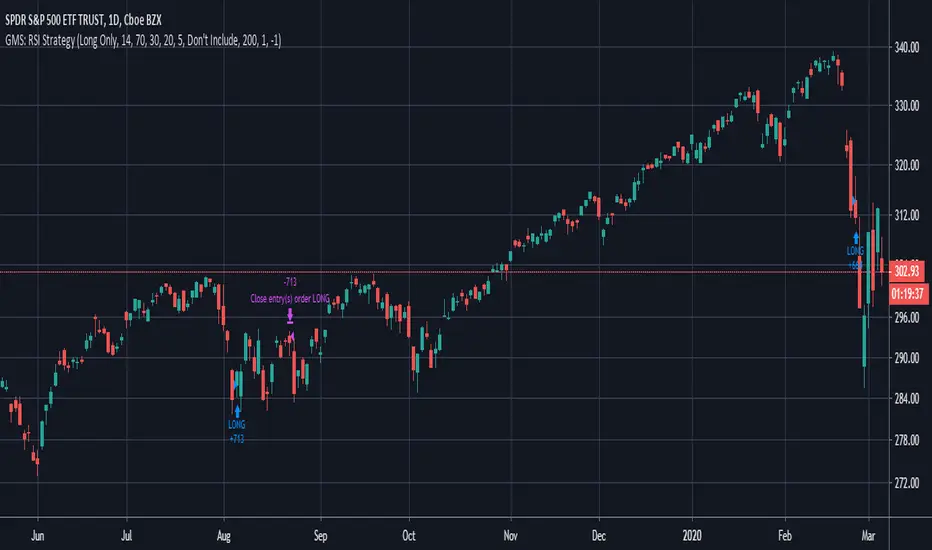
GMS: RSI StrategyThis is just a basic RSI strategy that it easy to use and quite comprehensive so you can quickly test out an idea based on RSI.
- I made it comprehensive in that you can select long, short, or both.
- There is a simple moving average trend filter. You can filter for trades above, below, or don't include it at all.
- The exit is based on a simple moving average.
The source code should be open if you want to see it or modify it for your own project. I hope it helps!
Andre
Global Market Signals
BEST Engulfing + Breakout StrategyHello traders
This is a simple algorithm for a Tradingview strategy tracking a convergence of 2 unrelated indicators.
Convergence is the solution to my trading problems.
It's a puzzle with infinite possibilities and only a few working combinations.
Here's one that I like
- Engulfing pattern
- Price vs Moving average for detecting a breakout
Definition
Take out the notebooks :) and some coffee (good for focus). I'm bullish in coffee
The engulfing pattern is a two-candle reversal pattern.
The second candle completely ‘engulfs’ the real body of the first one, without regard to the length of the tail shadows.
The bullish Engulfing pattern appears in a downtrend and is a combination of one red candle followed by a larger green candle
The bearish Engulfing pattern appears in a downtrend and is a combination of one green candle followed by a larger red candle
Example: imgur.com
We're bored sir... what's the point of all this?
In summary, an engulfing is a pattern to track reversals. (the whole TradingView audience stands up now giving a standing ovation)
Adding the Price vs Moving average filters allows to track reversals with momentums (half of the audience collapsed because this is too awesome)
Ok sir... you picked up my interest
I included some cool backtest filters:
- date range filtering
- flexible take profit in USD value (plotted in blue)
- flexible stop loss in USD value (plotted in red)
All the best
Dave

Stochastic Pop and Drop by Jake Bernstein v1 [Bitduke]I found a simple strategy by Jake Bernstein, modified it a little and created a strategy with Risk Management System (SL+TP); After that I test it on the different cryptocurrency pairs.
About the Indicator
Basically it's the strategy of 2 indicators: Stochastic Oscillator to define the bias and Average Directional Index to confirm it.
One again, It uses Stochastic Oscillator to define the trading bias. In particular, the trading bias was deemed bullish when the weekly 14-period Stochastic Oscillator was above some default value (in him paper - 50) and rising and vice versa.
Once the trading bias is established, Steckler used the Average Directional Index (ADX) to define a slowdown in the trend. ADX measures the strength of the trend and a move below 20 signals a weak trend.
Modifications
I didn't implement Average Directional Index (ADX) and test just different sources for data, oscillator periods and different levels in relation to the crypto market.
So, it shows good results with two tight thresholds at 55 and 45 level.
The bar chart below the defining the bullish and bearish periods (green and red) and gives a signal to enter the trade (purple bars).
Backtesting
Backtested on XBTUSD , BTCPERP (FTX) pairs. You may notice it shows good results on 3h timeframe.
Relatively low drawdown
~ 10% (from 2019 to date) FTX
~ 22% (4 years from 2016) Bitmex
I backtested on the different altcoin pairs as well, but the results were just not good.
Relatively good results were shown by some index pairs from the FTX exchange ( FTX:SHITPERP ), but I think there is a few data for backtesting to be asure in them.
Bitmex 3h (2017 - 2020) :
i.imgur.com
FTX 3h (2019 - 2020):
i.imgur.com
Possible Improvements
- Regarding trading algorithm it would be good to check with strategy with ADX somehow. Maybe for the better entries
- As for Risk Management system, it can be improved by adding trailing stop to the strategy.
Link: school.stockcharts.com

The 100% - Bitcoin BeatsHello, Hello, Hello,
And welcome back, to Bitcoin Beats.
This is a strategy & Indicator that's essentially supertrend. However, we have used machine learning and AI to determine the best parameters in order to never lose money.
Yes you read that correctly, this Algo has NEVER lost a trade. All trades have come through successfully based on % moves.
A 'Supertrend' indicator is one, which can give you precise buy or sell signal in a trending market. ... The buy and sell signals are generated when the indicator starts plotting either on top of the closing price or below the closing price.
This strategy finds the best exit point without ever having to take a loss. This means you can use Cross leverage if the risk management is good enough and not worry about your account getting REKT as the trade always comes through in the end.
Trade at your own risk.
Thanks you and Goodbye, From Bitcoin Beats.

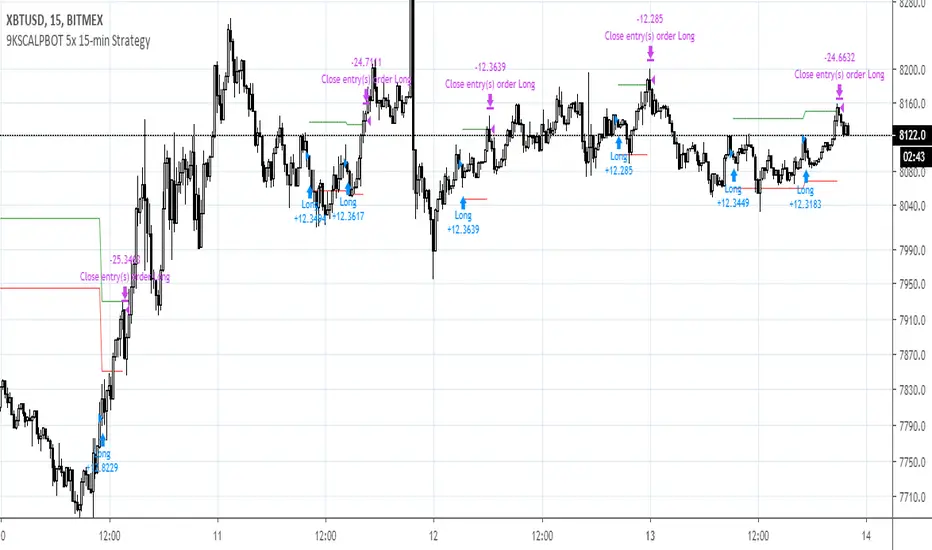
9KSCALPBOT 5x 15-min StrategyThis scalp bot uses low leverage to scalp small but high certainty movements on the 15-minute timeframe. Its amazing proprietary feature addresses the common problem of accumulated losses due to excessive stop-lossing -- this is done by assessing macro trends on higher timeframes when underwater, and then riding the position out until profitable again. You will get an average of about 1 entry and 1 exit per day.
The core logic uses a modified combination of CCI and Schaff Trend oscillators and a proprietary pattern recognition mechanic. Leverage should be kept low (5X or less) as the algorithm could temporarily go significantly underwater as well as pyramid (stack) same direction entries up to five times before closing. Any leverage higher than 5X significantly increases risk of liquidation. This bot has been consistently backtested for 10 months with about 75-85% win rate, 100%+ 3-month profitability, very low ~5% drawdown, all after factoring typical BitMex fees (0.06% after counting affiliate self-referral).
As with any automated strategy, it does not account for black swan events or disruptions in server connectivity (e.g., BitMex overload errors).
FearsAndHopesA strategy based on the assumption that if you buy in a panic and sell on the euphoria of the crowd, then in the long run you get a profit. The strategy is symmetrical, that is, we assume that FOMO and FUD have an equal impact on the crowd. Never make different paired parameters. Do not try to get a perfect result on the backtest. The setup is symmetrical, the program does not use EMA, requests to larger timeframes, and other things that can cause repaintings. However, if you use the value 1 in the Fast Sma Length field, repaintings is possible, use with caution. This algorithm makes me profit 2600% profit per year, which, of course, does not mean that the next year will bring the same. API history on Bitmex on request in PM. Use it as an indicator with pleasure. Access to the script and help in setting up costs 0.5 btc
