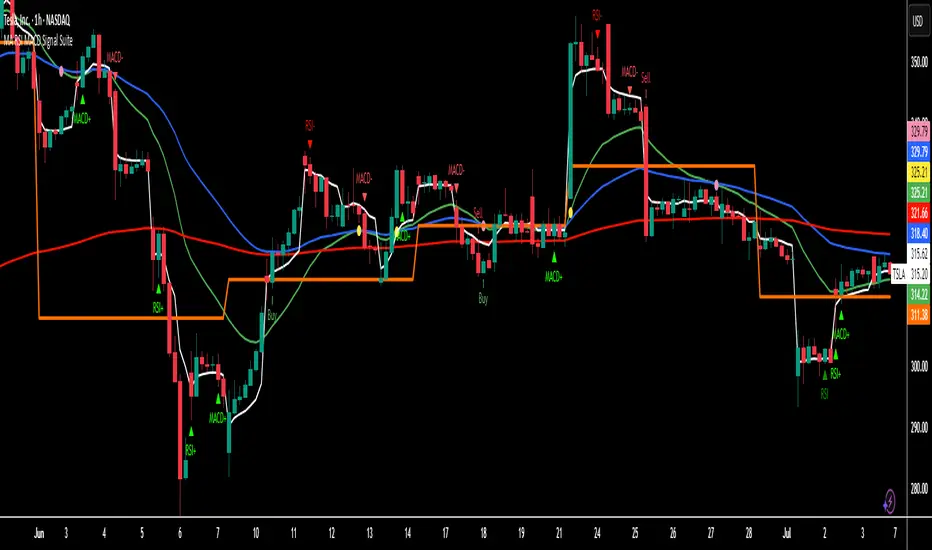
MA RSI MACD Signal SuiteThis Pine Script™ is designed for use in Trading View and generates trading signals based on moving average (MA) crossovers, RSI (Relative Strength Index) signals, and MACD (Moving Average Convergence Divergence) indicators. It provides visual markers on the chart and can be configured to suit various trading strategies.
1. Indicator Overview
The indicator includes signals for:
Moving Averages (MA): It tracks crossovers between different types of moving averages.
RSI: Signals based on RSI crossing certain levels or its signal line.
MACD: Buy and sell signals generated by MACD crossovers.
2. Inputs and Customization
Moving Averages (MAs):
You can customize up to 6 moving averages with different types, lengths, and colors.
MA Type: Choose from different types of moving averages:
SMA (Simple Moving Average)
EMA (Exponential Moving Average)
HMA (Hull Moving Average)
SMMA (RMA) (Smoothed Moving Average)
WMA (Weighted Moving Average)
VWMA (Volume Weighted Moving Average)
T3, DEMA, TEMA
Source: Select the price to base the MA on (e.g., close, open, high, low).
Length: Define the number of periods for each moving average.
Examples:
MA1: Exponential Moving Average (EMA) with a period of 9
MA2: Exponential Moving Average (EMA) with a period of 21
RSI Settings:
RSI is calculated based on a user-defined period and is used to identify potential overbought or oversold conditions.
RSI Length: Lookback period for RSI (default 14).
Overbought Level: Defines the overbought threshold for RSI (default 70).
Oversold Level: Defines the oversold threshold for RSI (default 30).
You can also adjust the smoothing for the RSI signal line and customize when to trigger buy and sell signals based on the RSI crossing these levels.
MACD Settings:
MACD is used for identifying changes in momentum and trends.
Fast Length: The period for the fast moving average (default 12).
Slow Length: The period for the slow moving average (default 26).
Signal Length: The period for the signal line (default 9).
Smoothing Method: Choose between SMA or EMA for both the MACD and the signal line.
3. Signal Logic
Moving Average (MA) Crossover Signals:
Crossover: A bullish signal is generated when a fast MA crosses above a slow MA.
Crossunder: A bearish signal is generated when a fast MA crosses below a slow MA.
The crossovers are plotted with distinct colors, and the chart will display markers for these crossover events.
RSI Signals:
Oversold Crossover: A bullish signal when RSI crosses over its signal line below the oversold level (30).
Overbought Crossunder: A bearish signal when RSI crosses under its signal line above the overbought level (70).
RSI signals are divided into:
Aggressive (Early) Entries: Signals when RSI is crossing the oversold/overbought levels.
Conservative Entries: Signals when RSI confirms a reversal after crossing these levels.
MACD Signals:
Buy Signal: Generated when the MACD line crosses above the signal line (bullish crossover).
Sell Signal: Generated when the MACD line crosses below the signal line (bearish crossunder).
Additionally, the MACD histogram is used to identify momentum shifts:
Rising to Falling Histogram: Alerts when the MACD histogram switches from rising to falling.
Falling to Rising Histogram: Alerts when the MACD histogram switches from falling to rising.
4. Visuals and Alerts
Plotting:
The script plots the following on the price chart:
Moving Averages (MA): The selected MAs are plotted as lines.
Buy/Sell Shapes: Triangular markers are displayed for buy and sell signals generated by RSI and MACD.
Crossover and Crossunder Markers: Crosses are shown when two MAs crossover or crossunder.
Alerts:
Alerts can be configured based on the following conditions:
RSI Signals: Alerts for oversold or overbought crossover and crossunder events.
MACD Signals: Alerts for MACD line crossovers or momentum shifts in the MACD histogram.
Alerts are triggered when specific conditions are met, such as:
RSI crosses over or under the oversold/overbought levels.
MACD crosses the signal line.
Changes in the MACD histogram.
5. Example Usage
1. Trend Reversal Setup:
Buy Signal: Use the RSI oversold crossover and MACD bullish crossover to identify potential entry points in a downtrend.
Sell Signal: Use the RSI overbought crossunder and MACD bearish crossunder to identify potential exit points or short entries in an uptrend.
2. Momentum Strategy:
Combine MACD and RSI signals to identify the strength of a trend. Use MACD histogram analysis and RSI levels for confirmation.
3. Moving Average Crossover Strategy:
Focus on specific MA crossovers, such as the 9-period EMA crossing above the 21-period EMA, for buy signals. When a longer-term MA (e.g., 50-period) crosses a shorter-term MA, it may indicate a strong trend change.
6. Alerts Conditions
The script includes several alert conditions, which can be triggered and customized based on the user’s preferences:
RSI Oversold Crossover: Alerts when RSI crosses over the signal line below the oversold level (30).
RSI Overbought Crossunder: Alerts when RSI crosses under the signal line above the overbought level (70).
MACD Buy/Sell Crossover: Alerts when the MACD line crosses the signal line for a buy or sell signal.
7. Conclusion
This script is highly customizable and can be adjusted to suit different trading strategies. By combining MAs, RSI, and MACD, traders can gain multiple perspectives on the market, enhancing their ability to identify potential buy and sell opportunities.
Search in scripts for "averages"
Cross Alert with Configurable Rectangles**Description:**
This TradingView script, **"Cross Alert with Configurable Rectangles"**, is a technical analysis tool designed to help traders visualize and analyze market trends effectively. It combines configurable moving averages with customizable timeframe-based rectangles for highlighting price ranges.
### Features:
1. **Moving Averages:**
- Calculates and plots an Exponential Moving Average (EMA) and a Simple Moving Average (SMA) based on user-defined lengths.
- Provides both short and long moving averages to identify potential trend reversals or confirmations.
2. **Customizable Timeframe Rectangles:**
- Dynamically draws rectangles around price action based on user-selected timeframes: **Hourly (60 minutes), Daily, Weekly, or Monthly.**
- Automatically updates the rectangles to reflect high and low price levels within the selected timeframe.
- Customizable rectangle color and transparency for better chart visibility.
3. **Dynamic Line Projections:**
- Projects the trend of the long and short moving averages forward in time to help anticipate price movements.
### Use Case:
This script is ideal for traders who want to:
- Identify key support and resistance levels within different timeframes.
- Analyze price behavior relative to moving averages.
- Spot potential trend changes by observing price interaction with the moving averages and timeframe rectangles.
The script is fully configurable, allowing traders to adapt it to their trading strategy and preferences.

Volume-Based RSI Color Indicator with MAsVolume-Based RSI Color Indicator with MAs
Overview
This script combines the Relative Strength Index (RSI) with volume analysis to provide an enhanced perspective on market conditions. By dynamically coloring the RSI line based on overbought/oversold conditions and volume thresholds, this indicator helps traders quickly identify high-probability reversal zones. Additionally, it incorporates short-term and long-term moving averages (MAs) of the RSI for trend analysis, making it a versatile tool for scalping and swing trading strategies.
Key Features
Dynamic RSI Color Coding:
The RSI line changes color based on two conditions:
Overbought/High Volume: RSI is above the overbought threshold (default: 70) and volume exceeds the average volume by a user-defined multiplier (default: 2.0). The line turns red, indicating potential reversal zones.
Oversold/High Volume: RSI is below the oversold threshold (default: 30) and volume exceeds the average volume by the multiplier. The line turns green, suggesting potential buying opportunities.
Neutral Conditions: Default blue color for all other scenarios.
Volume Integration:
Unlike standard RSI indicators, this script incorporates volume data to refine signals, helping traders avoid false signals in low-volume environments.
RSI Moving Averages:
Two moving averages of the RSI (short-term and long-term) provide trend context:
200-period MA: Highlights the long-term trend in RSI values.
20-period MA: Shows short-term fluctuations for quick decision-making.
Both MAs can be calculated using Simple or Exponential methods, giving users flexibility.
Visual Aids:
Horizontal lines at the overbought (70) and oversold (30) levels help define the boundaries of expected price action extremes.
How It Works
The script calculates the RSI over a user-defined length (default: 14).
Volume data is compared to its moving average to determine if it exceeds the user-defined high-volume threshold.
When RSI and volume conditions align, the RSI line is dynamically colored to indicate potential overbought/oversold zones.
The RSI moving averages provide additional context to confirm trends or reversals.
How to Use
Identify Reversal Zones:
Look for green RSI signals in oversold conditions to identify potential buying opportunities.
Look for red RSI signals in overbought conditions to identify potential selling opportunities.
Use Moving Averages for Confirmation:
When the RSI is above its 200-period MA, the long-term trend is bullish; consider only long trades.
When the RSI is below its 200-period MA, the trend is bearish; consider only short trades.
Combine with Other Tools:
This indicator works best when used alongside price action analysis, candlestick patterns, or support/resistance levels.
Originality
This script is unique in combining volume analysis with RSI and RSI-specific moving averages. While many indicators focus on RSI or volume separately, this script marries these two key metrics to filter out weak signals and improve trade decision accuracy.
Chart Recommendations
Clean Chart: Use this indicator on a clean chart without additional overlays for maximum clarity.
Timeframes: Works well on intraday charts (e.g., 5m, 15m) for scalping and on higher timeframes (e.g., 1H, 4H, Daily) for swing trading.
Disclaimer
This indicator is a tool to aid trading decisions and should not be used in isolation. Always consider other factors such as market conditions, news events, and risk management.

Trend Detection with AlertsPurpose of the Script
The script identifies trends on a chart (uptrend, downtrend, or sideways trend) and provides both visual cues and alerts when a trend changes. It uses two methods for trend detection:
Moving Averages (MA): It compares a short-term moving average (fast) with a long-term moving average (slow).
An uptrend occurs when the short-term MA is above the long-term MA.
A downtrend occurs when the short-term MA is below the long-term MA.
Price Action:
Higher highs (HH) indicate bullish momentum.
Lower lows (LL) indicate bearish momentum.
When these methods align, the script determines the trend and notifies the user of any trend changes.
Key Features
Moving Average Calculation:
A short-term moving average and a long-term moving average are calculated to determine the overall trend direction.
Trend Determination:
An uptrend is detected when the short-term MA is above the long-term MA and higher highs are present.
A downtrend is detected when the short-term MA is below the long-term MA and lower lows are present.
Otherwise, the trend is classified as sideways.
Alerts for Trend Changes:
Alerts are triggered when the trend changes from one state to another (e.g., sideways to uptrend).
Custom messages indicate the type of trend detected.
Background Colors:
The script changes the chart’s background color based on the current trend:
Green for uptrends.
Red for downtrends.
Gray for sideways trends.
Visualization of Moving Averages:
The moving averages are plotted on the chart for visual reference.
How It Works
Inputs for Flexibility:
The user can configure the lengths of the short-term and long-term moving averages.
A lookback period is used to determine higher highs or lower lows for additional confirmation.
Trend Logic:
The script checks the relationship between the moving averages to identify general trends.
It also evaluates price action to confirm trend strength (e.g., whether a higher high or lower low occurred).
Alert System:
When the detected trend changes (e.g., from sideways to uptrend), an alert is triggered. This ensures the user is notified of important market movements.
Dynamic Background Coloring:
The background color of the chart changes to reflect the current trend, making it easy to interpret the trend visually.
Use Cases
Trend Identification: Helps traders quickly identify market trends for decision-making.
Alerts for Trend Changes: Notifies traders when a new trend begins, ensuring they don’t miss key opportunities.
Visual Assistance: Makes it easier to interpret trends through color-coded backgrounds and moving average overlays.
Customization Options
Adjust Moving Average Lengths: Users can modify the short-term and long-term moving averages to suit their trading strategies.
Change Lookback Period: The sensitivity of higher highs and lower lows can be adjusted.
Personalized Alerts: Alerts can be customized for different trading scenarios.
Summary
This script provides an intuitive way to detect and visualize market trends while offering real-time alerts for trend changes. It’s an excellent tool for traders who want to stay informed about market conditions and make data-driven decisions.
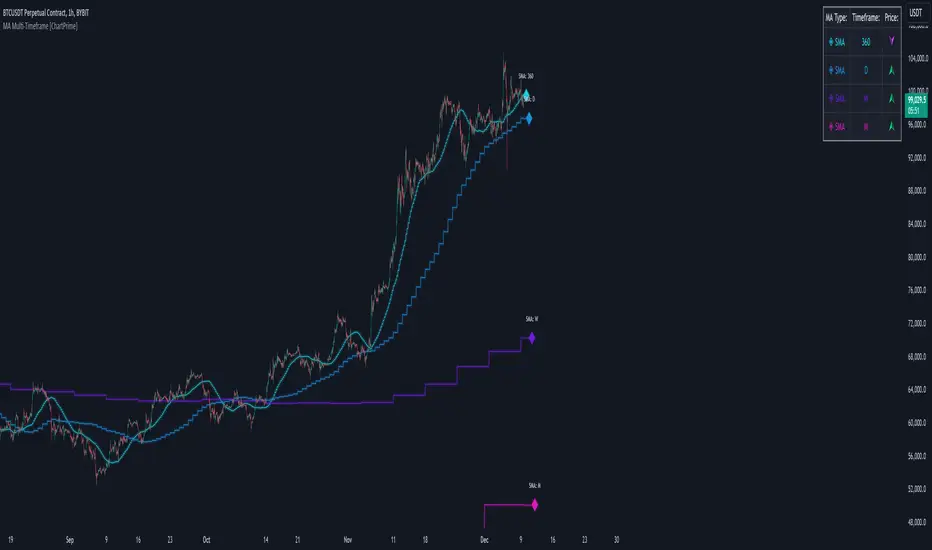
MA Multi-Timeframe [ChartPrime]The MA Multi-Timeframe indicator is designed to provide multi-timeframe moving averages (MAs) for better trend analysis across different periods. This tool allows traders to monitor up to four different MAs on a single chart, each coming from a selectable timeframe and type (SMA, EMA, SMMA, WMA, VWMA). The indicator helps traders gauge both short-term and long-term price trends, allowing for a clearer understanding of market dynamics.
⯁ KEY FEATURES AND HOW TO USE
⯌ Multi-Timeframe Moving Averages :
The indicator allows traders to select up to four MAs, each from different timeframes. These timeframes can be set in the input settings (e.g., Daily, Weekly, Monthly), and each moving average can be displayed with its corresponding timeframe label directly on the chart.
Example of different timeframes for MAs:
⯌ Moving Average Types :
Users can choose from several types of moving averages, including SMA, EMA, SMMA, WMA, and VWMA, making the indicator adaptable to different strategies and market conditions. This flexibility allows traders to tailor the MAs to their preference.
Example of different types of MAs:
⯌ Dashboard Display :
The indicator includes a built-in dashboard that shows each MA, its timeframe, and whether the price is currently above or below that MA. This dashboard provides a quick overview of the trend across different timeframes, allowing traders to determine whether the overall trend is up or down.
Example of trend overview via the dashboard:
⯌ Polyline Representation :
Each MA is plotted using polylines to avoid plot functions and create a curves across up to 4000 bars back, ensuring that historical data is visualized clearly for a deeper analysis of how the price interacts with these levels over time.
if barstate.islast
for i = 0 to 4000
cp.push(chart.point.from_index(bar_index , ma ))
polyline.delete(polyline.new(cp, curved = false, line_color = color, line_style = style) )
Example of polylines for moving averages:
⯌ Customization Options :
Traders can customize the length of the MAs for all timeframes using a single input. The color, style (solid, dashed, dotted) of each moving average are also customizable, giving users full control over the visual appearance of the indicator on their chart.
Example of custom MA styles:
⯁ USER INPUTS
MA Type : Select the type of moving average for each timeframe (SMA, EMA, SMMA, WMA, VWMA).
Timeframe : Choose the timeframe for each moving average (e.g., Daily, Weekly, Monthly).
MA Length : Set the length for the moving averages, which will be applied to all four MAs.
Line Style : Customize the style of each MA line (solid, dashed, or dotted).
Colors : Set the color for each MA for better visual distinction.
⯁ CONCLUSION
The MA Multi-Timeframe indicator is a versatile and powerful tool for traders looking to monitor price trends across multiple timeframes with different types of moving averages. The dashboard simplifies trend identification, while the customizable options make it easy to adapt to individual trading strategies. Whether you're analyzing short-term price movements or long-term trends, this indicator offers a comprehensive solution for tracking market direction.
GocchiMulti-Indicator: RSI & Moving Averages
This versatile TradingView indicator combines two essential tools for technical analysis—Relative Strength Index (RSI) and Moving Averages (MAs)—into one comprehensive solution. It is designed for traders seeking flexibility, customization, and efficiency in their charting experience.
Features:
Relative Strength Index (RSI):
Customizable RSI length.
Adjustable overbought and oversold levels.
Selectable source input (e.g., close, open, high, low).
Visual levels for overbought and oversold zones, aiding in quick trend and momentum identification.
Three Moving Averages:
Three independently customizable moving averages.
Options for Simple Moving Average (SMA) or Exponential Moving Average (EMA) for each line.
Adjustable lengths for short-, medium-, and long-term trend tracking.
Visual Enhancements:
Clear, color-coded plots for RSI and each moving average.
Overbought and oversold zones are highlighted with horizontal dotted lines.
Alerts:
Get notified when RSI crosses above the overbought level or below the oversold level.
Alerts help traders stay on top of potential market reversals or breakout opportunities.
Use Cases:
RSI Analysis: Spot overbought or oversold conditions to identify potential reversals.
Trend Following: Use moving averages to confirm trends or identify crossovers for potential entry and exit points.
Custom Strategies: Tailor the settings to fit specific trading styles, such as scalping, swing trading, or long-term investing.
This all-in-one indicator streamlines your analysis by reducing the need for multiple overlays, making your charts cleaner and more actionable. Whether you're a novice or an experienced trader, this tool provides the flexibility and insights you need to succeed in any market condition.

Moving Average Z-Score Suite [BackQuant]Moving Average Z-Score Suite
1. What is this indicator
The Moving Average Z-Score Suite is a versatile indicator designed to help traders identify and capitalize on market trends by utilizing a variety of moving averages. This indicator transforms selected moving averages into a Z-Score oscillator, providing clear signals for potential buy and sell opportunities. The indicator includes options to choose from eleven different moving average types, each offering unique benefits and characteristics. It also provides additional features such as standard deviation levels, extreme levels, and divergence detection, enhancing its utility in various market conditions.
2. What is a Z-Score
A Z-Score is a statistical measurement that describes a value's relationship to the mean of a group of values. It is measured in terms of standard deviations from the mean. For instance, a Z-Score of 1.0 means the value is one standard deviation above the mean, while a Z-Score of -1.0 indicates it is one standard deviation below the mean. In the context of financial markets, Z-Scores can be used to identify overbought or oversold conditions by determining how far a particular value (such as a moving average) deviates from its historical mean.
3. What moving averages can be used
The Moving Average Z-Score Suite allows users to select from the following eleven moving averages:
Simple Moving Average (SMA)
Hull Moving Average (HMA)
Exponential Moving Average (EMA)
Weighted Moving Average (WMA)
Double Exponential Moving Average (DEMA)
Running Moving Average (RMA)
Linear Regression Curve (LINREG) (This script can be found standalone )
Triple Exponential Moving Average (TEMA)
Arnaud Legoux Moving Average (ALMA)
Kalman Hull Moving Average (KHMA)
T3 Moving Average
Each of these moving averages has distinct properties and reacts differently to price changes, allowing traders to select the one that best fits their trading style and market conditions.
4. Why Turning a Moving Average into a Z-Score is Innovative and Its Benefits
Transforming a moving average into a Z-Score is an innovative approach because it normalizes the moving average values, making them more comparable across different periods and instruments. This normalization process helps in identifying extreme price movements and mean-reversion opportunities more effectively. By converting the moving average into a Z-Score, traders can better gauge the relative strength or weakness of a trend and detect potential reversals. This method enhances the traditional moving average analysis by adding a statistical perspective, providing clearer and more objective trading signals.
5. How It Can Be Used in the Context of a Trading System
In a trading system, it can be used to generate buy and sell signals based on the Z-Score values. When the Z-Score crosses above zero, it indicates a potential buying opportunity, suggesting that the price is above its mean and possibly trending upward. Conversely, a Z-Score crossing below zero signals a potential selling opportunity, indicating that the price is below its mean and might be trending downward. Additionally, the indicator's ability to show standard deviation levels and extreme levels helps traders set profit targets and stop-loss levels, improving risk management and trade planning.
6. How It Can Be Used for Trend Following
For trend-following strategies, it can be particularly useful. The Z-Score oscillator helps traders identify the strength and direction of a trend. By monitoring the Z-Score and its rate of change, traders can confirm the persistence of a trend and make informed decisions to enter or exit trades. The indicator's divergence detection feature further enhances trend-following by identifying potential reversals before they occur, allowing traders to capitalize on trend shifts. By providing a clear and quantifiable measure of trend strength, this indicator supports disciplined and systematic trend-following strategies.
No backtests for this indicator due to the many options and ways it can be used,
Enjoy
Normalized Volume Rate of ChangeThis indicator is designed to help traders gauge changes in volume dynamics and identify potential shifts in buying or selling pressure. By normalizing the volume rate of change and comparing it to moving averages of itself, it offers valuable insights into market trends and can assist in making informed trading decisions.
Calculation:
The indicator calculates the Volume Rate of Change (VROC) by measuring the percentage change in volume over a specified length. This calculation provides a relative measure of how quickly the volume is increasing or decreasing. It then normalizes the VROC to a range of -1 to +1 by scaling it based on the highest and lowest values observed within the specified length. This normalization allows for easy comparison of the current VROC value with historical levels, enabling traders to assess the intensity of volume fluctuations.
Interpretation:
The main plot of the indicator displays the normalized VROC values as columns. The color of each column provides valuable information about the relationship between the VROC and the moving averages. Lime-colored columns indicate that the VROC is above both moving averages, suggesting increased buying pressure and potential bullish sentiment. Conversely, fuchsia-colored columns indicate that the VROC is below both moving averages, suggesting increased selling pressure and potential bearish sentiment. Yellow-colored columns indicate that the VROC is between the two moving averages, reflecting a period of consolidation or indecision in the market.
To further enhance interpretation, the indicator includes two moving averages. The Aqua line represents the faster moving average (MA1), and the Orange line represents the slower moving average (MA2). These moving averages provide additional context by smoothing out the VROC values and highlighting the overall trend. Traders can observe the interaction between the moving averages and the VROC to identify potential crossovers and assess the strength of trend reversals or continuations.
Colors:
-- Lime : The lime color is used to represent high volume rate of change above both moving averages. This color indicates a potentially bullish market sentiment, suggesting that buyers are dominant.
-- Fuchsia : The fuchsia color is used to represent low volume rate of change below both moving averages. This color indicates a potentially bearish market sentiment, suggesting that sellers are dominant.
-- Yellow : The yellow color is used to represent the volume rate of change between the two moving averages. This color reflects a transitional phase where neither buyers nor sellers have a clear advantage, signaling a period of consolidation or indecision in the market.
To provide additional visual cues for potential trade signals, the indicator includes lime-colored arrows below the price chart when there is a crossover upwards (MA1 crossing above MA2). This lime arrow indicates a potential bullish signal, suggesting a favorable time to consider long positions. Similarly, fuchsia-colored arrows are displayed above the price chart when there is a crossover downwards (MA1 crossing below MA2), signaling a potential bearish signal and suggesting a favorable time to consider short positions.
Applications:
This indicator offers various applications in trading strategies, including:
-- Trend Identification : By observing the relationship between the normalized VROC and the moving averages, traders can identify potential shifts in market trends. Lime-colored columns above both moving averages indicate a strong bullish trend, suggesting an opportunity to capitalize on upward price movements. Conversely, fuchsia-colored columns below both moving averages indicate a strong bearish trend, suggesting an opportunity to profit from downward price movements. Yellow-colored columns between the moving averages indicate a period of consolidation or uncertainty, signaling a potential trend reversal or continuation.
-- Confirmation of Price Moves : The indicator's ability to reflect volume dynamics in relation to the moving averages can help traders validate price moves. When significant price movements are accompanied by lime-colored columns (indicating high volume rate of change above both moving averages), it adds confirmation to the bullish sentiment. Similarly, fuchsia-colored columns accompanying downward price movements validate the bearish sentiment. This confirmation can enhance traders' confidence in the reliability of price moves.
-- Trade Timing : The indicator's moving average crossovers and the presence of arrows provide timing signals for trade entries and exits. Lime arrows appearing below the price chart signal potential long entry opportunities, indicating a bullish market sentiment. Conversely, fuchsia arrows appearing above the price chart suggest potential short entry opportunities, indicating a bearish market sentiment. These signals can be used in conjunction with other technical analysis tools to improve trade timing and increase the probability of successful trades.
Parameter Adjustments:
Traders can adjust the length of the VROC and the moving averages according to their trading preferences and timeframes. Longer VROC lengths provide a broader view of volume dynamics over an extended period, making it suitable for assessing long-term trends. Shorter VROC lengths offer a more sensitive measure of recent volume changes, making it suitable for shorter-term analysis. Similarly, adjusting the lengths of the moving averages can help adapt the indicator to different market conditions and trading styles.
Limitations:
While the indicator provides valuable insights, it has some limitations that traders should be aware of:
-- False Signals : Like any technical indicator, false signals can occur. During periods of low liquidity or in choppy markets, the indicator may generate misleading signals. It is essential to consider other indicators, price action, and fundamental analysis to confirm the signals before taking any trading actions.
-- Lagging Nature : Moving averages inherently lag behind the price action and volume changes. As a result, there may be a delay in the generation of signals and capturing trend reversals. Traders should exercise patience and avoid solely relying on this indicator for immediate trade decisions. Combining it with other indicators and tools can provide a more comprehensive picture of market conditions.
In conclusion, this indicator offers valuable insights into volume dynamics and trend analysis. By comparing the normalized VROC with moving averages, traders can identify shifts in buying or selling pressure, validate price moves, and improve trade timing. However, it is important to consider its limitations and use it in conjunction with other technical analysis tools to form a well-rounded trading strategy. Additionally, thorough testing, experimentation, and customization of the indicator's parameters are recommended to align it with individual trading preferences and market conditions.

Pivot Breakouts with MA FilterPivot Breakouts with MA Filter
This script identifies pivot breakouts (both bullish and bearish) using support and resistance levels and overlays breakout labels, arrows, and customizable Moving Averages. It allows traders to fine-tune their analysis with multiple options to customize the display and behavior of the breakout signals.
Key Features:
Pivot Support and Resistance:
Support is defined by the lowest low in a given range (using the lookback period).
Resistance is defined by the highest high in a given range (using the lookback period).
The script draws support and resistance boxes on the chart when these levels change, providing clear visual markers for potential breakout areas.
Breakout Detection:
Bullish Breakout: A breakout above resistance and the price is above the selected moving average (MA).
Bearish Breakout: A breakdown below support and the price is below the selected MA.
Breakout events trigger labels indicating "Resistance Breakout" (for bullish) and "Support Breakout" (for bearish).
The option to show Breakout Labels (with customizable colors) is available in the settings.
Moving Average Filter:
You can select the type of moving average (SMA or EMA) to use for filtering breakout signals.
MA Filter Length: This input allows you to set the period of the moving average to act as a filter for breakout conditions. This helps ensure the breakout aligns with the broader trend.
Multiple Moving Averages (Optional):
You can add up to four different moving averages (SMA or EMA), each with its own length and color.
You have the option to toggle each moving average on or off and adjust their appearance settings (color and length).
The script supports dynamic plots for each moving average, helping to visualize multiple trends at once.
Breakout Arrows:
The script can display arrows (or other shapes) below the bar for bullish breakouts and above the bar for bearish breakouts.
Arrows are optional and can be turned on/off in the settings.
You can customize the shape of the arrows (e.g., arrow, circle, square, or even a large or small triangle).
Customizable Colors and Labels:
The color of the breakout labels and arrows can be customized in the settings to make them fit your chart's style and personal preferences.
Alerts:
Alerts can be set for new support and resistance levels, as well as when breakouts occur (either bullish or bearish).
The alert system helps to notify traders when significant price action takes place without needing to constantly monitor the chart.
Settings:
Select Moving Average Type (SMA or EMA)
MA Filter Length: Length of the moving average used for filtering breakout conditions.
Lookback Range: Determines the range over which the pivot points (support and resistance) are calculated.
Breakout Labels: Option to turn on/off breakout labels, and customize label colors.
Show Breakout Arrows: Enable or disable breakout arrows with shape options (arrow, circle, square, large triangle, small triangle).
Multiple Moving Averages: Option to show up to 4 MAs with customizable colors and lengths.

Combined EMA, SMMA, and 60-Day Cycle Indicator V2What This Script Does:
This script is designed to help traders visualize market trends and generate trading signals based on a combination of moving averages and price action. Here's a breakdown of its components and functionality:
Moving Averages:
EMAs (Exponential Moving Averages): These are indicators that smooth out price data to help identify trends. The script uses several EMAs:
200 EMA: A long-term trend indicator.
400 EMA: An even longer-term trend indicator.
55 EMA: A medium-term trend indicator.
89 EMA: Another medium-term trend indicator.
SMMA (Smoothed Moving Average): Similar to EMAs but with different smoothing. The script calculates:
21 SMMA: Short-term smoothed average.
9 SMMA: Very short-term smoothed average.
Cycle High and Low:
60-Day Cycle: The script looks back over the past 60 days to find the highest price (cycle high) and the lowest price (cycle low). These are plotted as horizontal lines on the chart.
Color-Coded Clouds:
Clouds: The script fills the area between certain EMAs with color-coded clouds to visually indicate trend conditions:
200 EMA vs. 400 EMA Cloud: Green when the 200 EMA is above the 400 EMA (bullish trend) and red when it’s below (bearish trend).
21 SMMA vs. 9 SMMA Cloud: Orange when the 21 SMMA is above the 9 SMMA and green when it’s below.
55 EMA vs. 89 EMA Cloud: Light green when the 55 EMA is above the 89 EMA and red when it’s below.
Trading Signals:
Buy Signal: This is shown when:
The price crosses above the 60-day low and
The EMAs indicate a bullish trend (e.g., the 200 EMA is above the 400 EMA and the 55 EMA is above the 89 EMA).
Sell Signal: This is shown when:
The price crosses below the 60-day high and
The EMAs indicate a bearish trend (e.g., the 200 EMA is below the 400 EMA and the 55 EMA is below the 89 EMA).
How It Helps Traders:
Trend Visualization: The colored clouds and EMA lines help you quickly see whether the market is in a bullish or bearish phase.
Trading Signals: The script provides clear visual signals (buy and sell labels) based on specific market conditions, helping you make more informed trading decisions.
In summary, this script combines several tools to help identify market trends and provide buy and sell signals based on price action relative to a 60-day high/low and the positioning of moving averages. It’s a useful tool for traders looking to visualize trends and automate some aspects of their trading strategy.
MA15, MA50 with Support/Resistance, CHoCH, Trend, and Entry/Exita comprehensive indicator that includes moving averages (MA), support and resistance levels, Change of Character (CHoCH) detection, trend identification, and entry/exit signals. Here's a breakdown of its components:
Input Parameters:
ma15_length and ma50_length: Lengths for the moving averages.
lookback: Period for detecting support and resistance levels.
Moving Averages:
ma15 and ma50 are simple moving averages with lengths defined by the user.
Support and Resistance Levels:
The script identifies swing highs and lows to update support and resistance levels.
These levels are plotted using extended lines for visualization.
Change of Character (CHoCH):
CHoCH up is detected when ma15 crosses above ma50.
CHoCH down is detected when ma15 crosses below ma50.
Corresponding signals are plotted on the chart.
Trend Identification:
An uptrend is confirmed when ma15 crosses above ma50 and the close price is above ma50.
A downtrend is confirmed when ma15 crosses below ma50 and the close price is below ma50.
Background colors are used to highlight uptrend (green) and downtrend (red).
Entry and Exit Signals:
Buy signals are generated when CHoCH up occurs, and the price pulls back to support during an uptrend.
Sell signals are generated when CHoCH down occurs, and the price pulls back to resistance during a downtrend.
These signals are plotted on the chart.
Alerts:
Alerts are set up to notify the user when a buy or sell signal is detected.

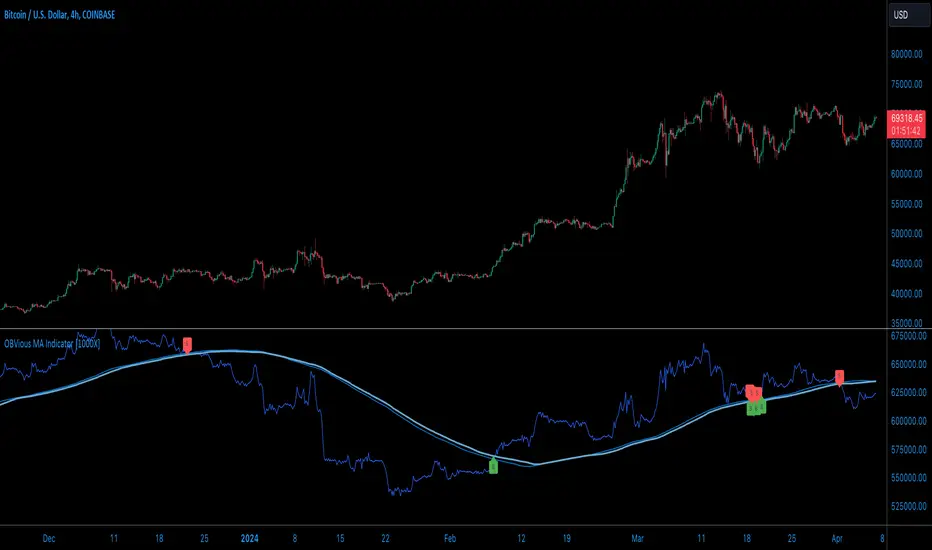
OBVious MA Indicator [1000X] On Balance Volume (OBV) is a gift to traders. OBV often provides a leading signal at the outset of a trend, when compression in the markets produces a surge in OBV prior to increased volatility.
This indicator demonstrates one method of utilizing OBV to your advantage. I call it the "OBVious MA Indicator ” only because it is simple in its mechanics. The primary utility of the OBVious MA indicator is as a volume confirmation filter that complements other components of a strategy.
Indicator Features:
• The Indicator revolves around the On Balance Volume indicator. OBV is a straightforward indicator: it registers a value by adding total volume traded on up candles, and subtracts total volume on down candles, generating a line by connecting those values. OBV was described in 1963 by Joe Granville in his book "Granville's New Key to Stock Market Profits” in which the author argues that OBV is the most vital key to success as a trader, with volume changes are a major predictor of price changes.
• Dual Moving Averages: here we use separate moving averages for entries and exits. This allows for more granular trade management; for example, one can either extend the length of the exit MA to hold positions longer, or shorten the MA for swifter exits, independently of the entry signals.
Execution: long trades are signalled when the OBV line crosses above the Long Entry Moving Average of the OBV. Long exits signals occur when the OBV line crosses under the Long Exit MA of the OBV. Shorts signal occur on a cross below the Short Entry MA, and exit signals come on a cross above the Short Exit MA.
Application:
While this indicator outlines entry and exit conditions based on OBV crossovers with designated moving averages, is is, as stated, best used in conjunction with a supporting cast of confirmatory indicators (feel free to drop me a note and tell me how you've used it). It can be used to confirm entries, or you might try using it as a sole exit indicator in a strategy.
Visualization:
The indicator includes conditional plotting of the OBV MAs, which plot based on the selected trading direction. This visualization aids in understanding how OBV interacts with the set moving averages.
Further Discussion:
We all know the importance of volume; this indicator demonstrates one simple yet effective method of incorporating the OBV for volume analysis. The OBV indicator can be used in many ways - for example, we can monitor OBV trend line breaks, look for divergences, or as we do here, watch for breaks of the moving average.
Despite its simplicity, I'm unaware of any previously published cases of this method. But the concept of applying MAs or EMAs to volume-based indicators like OBV is not uncommon in technical analysisIf, so I expect work like this has been done before. If you know of other similar indicators or strategies, please mention in the comments.
One comparable method uses EMAs of the OBV is QuantNomad’s "On Balance Volume Oscillator Strategy ”. That strategy uses a pair of EMAs on a normalized-range OBV-based oscillator. In that strategy, however, entry and exit signals occur on one EMA crossing the other, which places trades at distinctly different times than crossings of the OBV itself. Both are valid approaches with strength in simplicity.
Note: This is the indicator version of the Strategy found here .
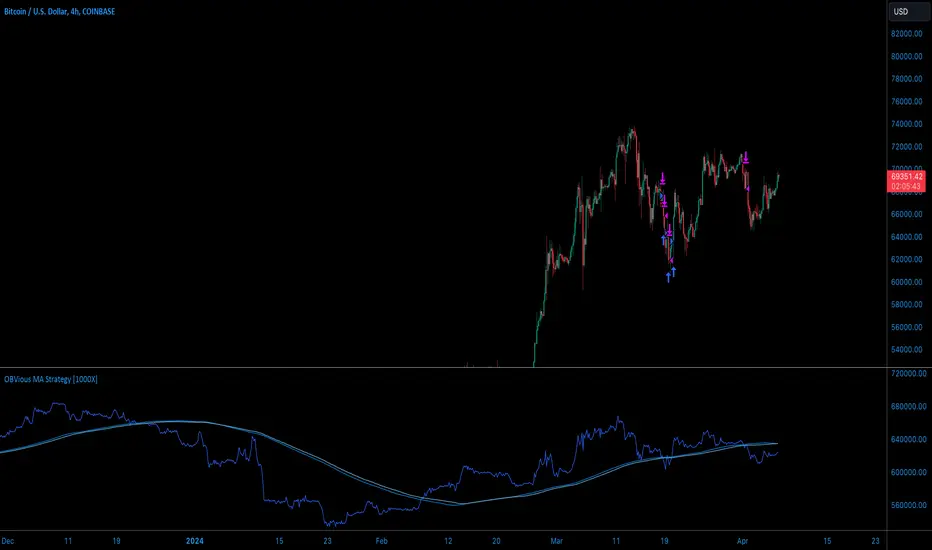
OBVious MA Strategy [1000X Trader]Exploring OBV: The OBVious MA Strategy
Are you using On Balance Volume (OBV) effectively? OBV is a gift to traders. OBV often provides a leading signal at the outset of a trend, when compression in the markets produces a surge in OBV prior to increased volatility.
This strategy demonstrates one method of utilizing OBV to your advantage. I call it the "OBVious MA Strategy ” only because it is so simple in its mechanics. This is meant to be a demonstration, not a strategy to utilize in live trading, as the primary utility of the OBVious MA indicator is as a volume confirmation filter that complements other components of a strategy. That said, I felt useful to present this indicator in isolation in this strategy to demonstrate the power it holds.
Strategy Features:
• OBV is the core signal: this strategy revolves around the On Balance Volume indicator. OBV is a straightforward indicator: it registers a value by adding total volume traded on up candles, and subtracts total volume on down candles, generating a line by connecting those values. OBV was described in 1963 by Joe Granville in his book "Granville's New Key to Stock Market Profits” in which the author argues that OBV is the most vital key to success as a trader, as volume changes are a major predictor of price changes.
• Dual Moving Averages: here we use separate moving averages for entries and exits. This allows for more granular trade management; for example, one can either extend the length of the exit MA to hold positions longer, or shorten the MA for swifter exits, independently of the entry signals.
Execution: long trades are taken when the OBV line crosses above the Long Entry Moving Average of the OBV. Long exits occur when the OBV line crosses under the Long Exit MA of the OBV. Shorts enter on a cross below the Short Entry MA, and exit on a cross above the Short Exit MA.
• Directional Trading: a direction filter can be set to "long" or "short," but not “both”, given that there is no trend filter in this strategy. When used in a bi-directional strategy with a trend filter, we add “both” to the script as a third option.
Application:
While this strategy outlines entry and exit conditions based on OBV crossovers with designated moving averages, is is, as stated, best used in conjunction with a supporting cast of confirmatory indicators (feel free to drop me a note and tell me how you've used it). It can be used to confirm entries, or you might try using it as a sole exit indicator in a strategy.
Visualization:
The strategy includes conditional plotting of the OBV MAs, which plot based on the selected trading direction. This visualization aids in understanding how OBV interacts with the set moving averages.
Further Discussion:
We all know the importance of volume; this strategy demonstrates one simple yet effective method of incorporating the OBV for volume analysis. The OBV indicator can be used in many ways - for example, we can monitor OBV trend line breaks, look for divergences, or as we do here, watch for breaks of the moving average.
Despite its simplicity, I'm unaware of any previously published cases of this method. The concept of applying MAs or EMAs to volume-based indicators like OBV is not uncommon in technical analysis, so I expect that work like this has been done before. If you know of other similar indicators or strategies, please mention in the comments.
One comparable strategy that uses EMAs of the OBV is QuantNomad’s "On Balance Volume Oscillator Strategy ", which uses a pair of EMAs on a normalized-range OBV-based oscillator. In that strategy, however, entries and exits occur on one EMA crossing the other, which places trades at distinctly different times than crossings of the OBV itself. Both are valid approaches with strength in simplicity.
Herrick Payoff Index @shrilssThis indicator combines elements of price action, volume, and open interest to provide insights into market strength and potential trend reversals. This script calculates the Herrick Payoff Index (HPI) based on a modified formula that incorporates volume and open interest adjustments.
The HPI is derived from comparing the current day's mean price to the previous day's mean price, factoring in volume and open interest changes. By analyzing these factors, the indicator aims to gauge the effectiveness of market participants' positions.
Key Features:
- HPI Calculation: The HPI value is calculated using the formula: ((M - My) * C * V) * (1 + |OI - OI | / min(OI, OI )), where M represents the mean price for the current day, My represents the mean price for the previous day, C is a constant (set to 1), V is the volume, and OI is the open interest. This adjusted calculation accounts for changes in volume and open interest, providing a more nuanced view of market dynamics.
- Moving Averages: The script also includes two Exponential Moving Averages (EMAs) of the HPI values, allowing traders to identify trends and potential reversal points. Users can customize the length of these moving averages to suit their trading strategies.
- Visual Signals: The indicator visually represents the HPI values and their relationship to the moving averages. When the HPI value is above the shorter-term EMA, it suggests bullish momentum, while values below indicate bearish sentiment.

buy/sell signals with Support/Resistance (InvestYourAsset) 📣The present indicator is a MACD based buy/sell signals indicator with support and resistance, that can be used to identify potential buy and sell signals in a security's price.
📣It is based on the MACD (Moving Average Convergence Divergence) indicator, which is a momentum indicator that shows the relationship between two moving averages of a security's price.
📣 The indicator also plots support and resistance levels, which can be used to confirm buy and sell signals. The support and resistance can also be used as a stoploss for existing position.
👉 To use the indicator, simply add it to your trading chart. The indicator will plot three sections:
📈 Price and Signals: This section plots the security's price and the MACD buy and sell signals.
📈 MACD Oscillator: This section plots the MACD oscillator, which is a histogram that shows the difference between the two moving averages.
📈 Moving Averages: This section plots the two moving averages that the MACD oscillator is based on.
📈 Support and Resistance: This section plots support and resistance levels, which are calculated based on the security's recent price action.
👉 To identify buy and sell signals, you can look for the following:
📈 Buy signal: When shorter Moving Average crosses over longer Moving Average.
📈 Sell signal: When shorter moving average crosses under longer moving average.
📈 You can also look for divergences between the MACD oscillator and the security's price. A divergence occurs when the MACD oscillator is moving in one direction, but the security's price is moving in the opposite direction. Divergences can be a sign of a potential trend reversal.
👉 To confirm buy and sell signals, you can look for support and resistance levels take a look at below snapshot. If a buy signal occurs at a support level, it is a stronger signal than if it occurs at a random price level. Similarly, if a sell signal occurs at a resistance level, it is a stronger signal than if it occurs at a random price level.
⚡ Here is a example of how to use the indicator to identify buy signal:
☑ Add the indicator to your trading chart.
☑Look for a buy signal when short MA crosses over Long MA.
☑Look for the buy signal to occur at a support level.
☑Enter a long position at the next candle.
☑Place a stop loss order below the support level.
☑Take profit when the MACD line crosses below the signal line, or when the security reaches a resistance level.
⚡ Here is an example of how to use the indicator to identify a sell signal:
☑Add the indicator to your trading chart.
☑Look for a sell signal, when shorter moving average crosses under longer moving average.
☑Look for the sell signal to occur at a resistance level.
☑Enter a short position at the next candle.
☑Place a stop loss order above the resistance level.
☑Take profit when the MACD line crosses above the signal line, or when the security reaches a support level.
✅Things to consider while using the indicator:
📈Look for buy signals in an uptrend and sell signals in a downtrend. This will increase the likelihood of your trades being successful.
📈Place your stop losses below the previous swing low or support for buy signals and above the previous swing high or resistance for sell signals. This will help to limit your losses if the trade goes against you.
📈Consider taking profits at key resistance and support levels. This will help you to lock in your profits and avoid giving them back to the market.
Follow us for timely updates regarding indicators that we may publish in future and give it a like if you appreciate the indicator.

Moving Average Multitool CrossoverAs per request, this is a moving average crossover version of my original moving average multitool script .
It allows you to easily access and switch between different types of moving averages, without having to continuously add and remove different moving averages from your chart. This should make backtesting moving average crossovers much, much more easier. It also has the option to show buy and sell signals for the crossovers of the chosen moving averages.
It contains the following moving averages:
Exponential Moving Average (EMA)
Simple Moving Average (SMA)
Weighted Moving Average (WMA)
Double Exponential Moving Average (DEMA)
Triple Exponential Moving Average (TEMA)
Triangular Moving Average (TMA)
Volume-Weighted Moving Average (VWMA)
Smoothed Moving Average (SMMA)
Hull Moving Average (HMA)
Least Squares Moving Average (LSMA)
Kijun-Sen line from the Ichimoku Kinko-Hyo system (Kijun)
McGinley Dynamic (MD)
Rolling Moving Average (RMA)
Jurik Moving Average (JMA)
Arnaud Legoux Moving Average (ALMA)
Vector Autoregression Moving Average (VAR)
Welles Wilder Moving Average (WWMA)
Sine Weighted Moving Average (SWMA)
Leo Moving Average (LMA)
Variable Index Dynamic Average (VIDYA)
Fractal Adaptive Moving Average (FRAMA)
Variable Moving Average (VAR)
Geometric Mean Moving Average (GMMA)
Corrective Moving Average (CMA)
Moving Median (MM)
Quick Moving Average (QMA)
Kaufman's Adaptive Moving Average (KAMA)
Volatility-Adjusted Moving Average (VAMA)
Modular Filter (MF)

5 MAs w. alerts [LucF]Is this gazillionth MA indicator worth an addition to the already crowded field of contenders? I say yes! This one shows up to 5 MAs and 6 different marker conditions that can be used to create alerts, among many other goodies.
Features
MAs can be darkened when they are falling.
MAs from another time frame can be displayed, with the option of smoothing them.
Markers can be filtered to Longs or Shorts only.
EMAs can be selected for either all or the two shortest MAs.
The background can be colored using any of the marker states except no. 3.
Markers are:
1. On crosses between any two user-defined MAs,
2. When price is above or below an MA,
3. On Quick Flips (a specific setup involving a cross, multiple MA states and increasing volume, when available),
4. When the difference between two MAs is within a % of its high/low historic values,
5. When an MA has been rising/falling for n bars,
6. When the difference between two MAs is greater than a multiple of ATR.
Some markers use similar visual cues, so distinguishing them will be a challenge if they are used concurrently.
Alerts
Alerts can be created on any combination of alerts. Only non-consecutive instances of markers 5 and 6 will trigger the alert condition. Make sure you are on the interval you want the alert to run at. Using the “Once Per Bar Close” trigger condition is usually the best option.
When an alert is created in TradingView, a snapshot of the indicator’s settings is saved with the alert, which then takes on a life of its own. That is why even though there is only one alert to choose from when you bring up the alert creation dialog box and choose “5 MAs”, that alert can be triggered from any number of conditions. You select those conditions by activating the markers you want the alert to trigger on before creating the alert. If you have selected multiple conditions, then it can be a good idea to record a reminder in the alert’s message field. When the alert triggers, you will need the indicator on the chart to figure out which one of your conditions triggered the alert, as there is currently no way to dynamically change the alert’s message field from within the script.
Background settings will not trigger alerts; only marker configurations.
Notes
MAs are just… averages. Trader lure would have them act as support and resistance levels. I’m not sure about that, and not the only one thinking along these lines. Adam Grimes has studied moving averages in quite a bit of detail. His numbers point to no evidence indicating they act as support/resistance, and to specific MA lengths not being more meaningful than others. His point of view is debated by some—not by me. Mean reversion does not entail that price stops when it reaches its MA; rather, it makes sense to me that price would often more or less oscillate around its MA, which entails the MA does not act as support/resistance. Aren’t the best mean reversion opportunities when price is furthest away from its MA? If so, it should be more profitable to identify these areas, which some of this indicator’s markers try to do.
I think MAs can be much more powerful when thought of as instruments we can use to situate price events in contexts of various resolutions, from the instantaneous to the big picture. Accordingly, I use the relative positions and slopes of MAs in both discretionary and automated trading; but never their purported ability to support/resist.
Regardless of how you use MAs, I hope you will find this indicator useful.
Biased References
The Art and Science of Technical Analysis: Market Structure, Price Action, and Trading Strategies, Adam Grimes, 2012.
Does the 200 day moving average “work”?
Moving averages: digging deeper

Square Root Moving AverageAbstract
This script computes moving averages which the weighting of the recent quarter takes up about a half weight.
This script also provides their upper bands and lower bands.
You can apply moving average or band strategies with this script.
Introduction
Moving average is a popular indicator which can eliminate market noise and observe trend.
There are several moving average related strategies used by many traders.
The first one is trade when the price is far from moving average.
To measure if the price is far from moving average, traders may need a lower band and an upper band.
Bollinger bands use standard derivation and Keltner channels use average true range.
In up trend, moving average and lower band can be support.
In ranging market, lower band can be support and upper band can be resistance.
In down trend, moving average and upper band can be resistance.
An another group of moving average strategy is comparing short term moving average and long term moving average.
Moving average cross, Awesome oscillators and MACD belong to this group.
The period and weightings of moving averages are also topics.
Period, as known as length, means how many days are computed by moving averages.
Weighting means how much weight the price of a day takes up in moving averages.
For simple moving averages, the weightings of each day are equal.
For most of non-simple moving averages, the weightings of more recent days are higher than the weightings of less recent days.
Many trading courses say the concept of trading strategies is more important than the settings of moving averages.
However, we can observe some characteristics of price movement to design the weightings of moving averages and make them more meaningful.
In this research, we use the observation that when there are no significant events, when the time frame becomes 4 times, the average true range becomes about 2 times.
For example, the average true range in 4-hour chart is about 2 times of the average true range in 1-hour chart; the average true range in 1-hour chart is about 2 times of the average true range in 15-minute chart.
Therefore, the goal of design is making the weighting of the most recent quarter is close to the weighting of the rest recent three quarters.
For example, for the 24-day moving average, the weighting of the most recent 6 days is close to the weighting of the rest 18 days.
Computing the weighting
The formula of moving average is
sum ( price of day n * weighting of day n ) / sum ( weighting of day n )
Day 1 is the most recent day and day k+1 is the day before day k.
For more convenient explanation, we don't expect sum ( weighting of day n ) is equal to 1.
To make the weighting of the most recent quarter is close to the weighting of the rest recent three quarters, we have
sum ( weighting of day 4n ) = 2 * sum ( weighting of day n )
If when weighting of day 1 is 1, we have
sum ( weighting of day n ) = sqrt ( n )
weighting of day n = sqrt ( n ) - sqrt ( n-1 )
weighting of day 2 ≒ 1.414 - 1.000 = 0.414
weighting of day 3 ≒ 1.732 - 1.414 = 0.318
weighting of day 4 ≒ 2.000 - 1.732 = 0.268
If we follow this formula, the weighting of day 1 is too strong and the moving average may be not stable.
To reduce the weighting of day 1 and keep the spirit of the formula, we can add a parameter (we call it as x_1w2b).
The formula becomes
weighting of day n = sqrt ( n+x_1w2b ) - sqrt ( n-1+x_1w2b )
if x_1w2b is 0.25, then we have
weighting of day 1 = sqrt(1.25) - sqrt(0.25) ≒ 1.1 - 0.5 = 0.6
weighting of day 2 = sqrt(2.25) - sqrt(1.25) ≒ 1.5 - 1.1 = 0.4
weighting of day 3 = sqrt(3.25) - sqrt(2.25) ≒ 1.8 - 1.5 = 0.3
weighting of day 4 = sqrt(4.25) - sqrt(3.25) ≒ 2.06 - 1.8 = 0.26
weighting of day 5 = sqrt(5.25) - sqrt(4.25) ≒ 2.3 - 2.06 = 0.24
weighting of day 6 = sqrt(6.25) - sqrt(5.25) ≒ 2.5 - 2.3 = 0.2
weighting of day 7 = sqrt(7.25) - sqrt(6.25) ≒ 2.7 - 2.5 = 0.2
What you see and can adjust in this script
This script plots three moving averages described above.
The short term one is default magenta, 6 days and 1 atr.
The middle term one is default yellow, 24 days and 2 atr.
The long term one is default green, 96 days and 4 atr.
I arrange the short term 6 days to make it close to sma(5).
The other twos are arranged according to 4x length and 2x atr.
There are 9 curves plotted by this script. I made the lower bands and the upper bands less clear than moving averages so it is less possible misrecognizing lower or upper bands as moving averages.
x_src : how to compute the reference price of a day, using 1 to 4 of open, high, low and close.
len : how many days are computed by moving averages
atr : how many days are computed by average true range
multi : the distance from the moving average to the lower band and the distance from the moving average to the lower band are equal to multi * average true range.
x_1w2b : adjust this number to avoid the weighting of day 1 from being too strong.
Conclusion
There are moving averages which the weighting of the most recent quarter is close to the weighting of the rest recent three quarters.
We can apply strategies based on moving averages. Like most of indicators, oversold does not always means it is an opportunity to buy.
If the short term lower band is close to the middle term moving average or the middle term lower band is close to the long term moving average, it may be potential support value.
References
Computing FIR Filters Using Arrays
How to trade with moving averages : the eight trading signals concluded by Granville
How to trade with Bollinger bands
How to trade with double Bollinger bands
IBD Style Candles [tradeviZion]IBD Style Candles - Visualize Price Bars Like the Pros
Transform your chart with institutional-grade IBD-style bars and customizable moving averages for both daily and weekly timeframes. This indicator helps you visualize price action the way professionals at Investors Business Daily do.
What This Indicator Offers:
IBD-style bar visualization (clean, professional appearance)
Customizable coloring based on price movement or previous close
Automatic timeframe detection for appropriate moving averages
Four customizable moving averages for daily timeframes (10, 21, 50, 200)
Four customizable moving averages for weekly timeframes (10, 20, 30, 40)
Options to use SMAs or EMAs with adjustable colors and line widths
"The IBD-style bars provide a cleaner view of price action, allowing you to focus on market structure without the visual noise of traditional candles."
How to Apply the IBD-Style Bars:
On your TradingView chart, select "Bars" as the chart type from the main chart type selection menu (next to the time interval options).
Right-click on the chart and select "Settings".
Go to the "Symbol" tab.
Uncheck the "Thin Bars" option to display thicker bars.
Set the "Up Color" and "Down Color" opacity to 0 for a clean IBD-style appearance.
Enable "IBD-style Candles" from the script's settings.
To revert to the original chart style, repeat the above steps and restore the default settings.
Moving Average Configuration:
The indicator automatically detects your timeframe and displays the appropriate moving averages:
Daily Timeframe Moving Averages:
10-day moving average (SMA/EMA)
21-day moving average (SMA/EMA)
50-day moving average (SMA/EMA)
200-day moving average (SMA/EMA)
Weekly Timeframe Moving Averages:
10-week moving average (SMA/EMA)
20-week moving average (SMA/EMA)
30-week moving average (SMA/EMA)
40-week moving average (SMA/EMA)
Usage Tips:
Enable "Color bars based on previous close" to identify momentum shifts based on prior candle closes
Customize colors to match your chart theme or preference
Enable only the moving averages relevant to your trading strategy
For cleaner charts, reduce the number of visible moving averages
For stock trading, the 10/21/50/200 daily and 10/40 weekly MAs are most commonly used by institutions
// Example configuration for different timeframes
if timeframe.isweekly
// Weekly configuration
showSMA1_Weekly = true // 10-week MA
showSMA4_Weekly = true // 40-week MA
else
// Daily configuration
showMA2_Daily = true // 21-day MA
showMA3_Daily = true // 50-day MA
showMA4_Daily = true // 200-day MA
While the IBD style provides clarity, remember that no visualization method guarantees trading success. Always combine with proper analysis and risk management.
If you found this indicator helpful, please consider leaving a comment or suggestion for future improvements. Happy trading!

Average Open-to-X Analysis (OHA)Description:
The Average Open-to-X Analysis (OHA) indicator provides a comprehensive look at the average price differences between the opening price and the subsequent high, low, and closing prices over a specified lookback period. This allows traders to quickly assess average price movements relative to the open, offering insights into potential volatility and trading opportunities.
Key Features:
Average Differences: Calculates and plots the average differences between:
Open to Close
Open to Low
Open to High
Average of Averages: Calculates and plots the average of the above three averages, providing a consolidated view of overall price movement.
Percentage Changes: Displays both the absolute average differences and their corresponding percentage changes relative to the opening price.
Customizable Lookback Period: Users can adjust the number of bars to consider for the average calculations.
Visual Presentation: Presents the results in both line plots and a clear table for easy interpretation.
Color-Coded Insights: Uses color to highlight the direction of the average price movements (positive or negative).
How to Use:
Add the Indicator: Search for "Average Open-to-X Analysis (OHA)" in TradingView's indicator library.
Customize: Adjust the lookback period and color settings as desired.
Interpret:
Positive Averages: Indicate an upward bias from the open.
Negative Averages: Suggest a downward bias from the open.
Large Percentages: Signal potentially greater volatility.
Average of Averages: Provides an overall sense of price direction and strength.
Additional Notes:
The OHA indicator can be used on various timeframes to identify recurring patterns in price behavior relative to the open.
Combine OHA with other indicators and technical analysis tools for a more comprehensive trading strategy.

Laguerre-Kalman Adaptive Filter | AlphaNattLaguerre-Kalman Adaptive Filter |AlphaNatt
A sophisticated trend-following indicator that combines Laguerre polynomial filtering with Kalman optimal estimation to create an ultra-smooth, low-lag trend line with exceptional noise reduction capabilities.
"The perfect trend line adapts to market conditions while filtering out noise - this indicator achieves both through advanced mathematical techniques rarely seen in retail trading."
━━━━━━━━━━━━━━━━━━━━━━━━━━━━━━━━━━━━━━━━
🎯 KEY FEATURES
Dual-Filter Architecture: Combines two powerful filtering methods for superior performance
Adaptive Volatility Adjustment: Automatically adapts to market conditions
Minimal Lag: Laguerre polynomials provide faster response than traditional moving averages
Optimal Noise Reduction: Kalman filtering removes market noise while preserving trend
Clean Visual Design: Color-coded trend visualization (cyan/pink)
━━━━━━━━━━━━━━━━━━━━━━━━━━━━━━━━━━━━━━━━
📊 THE MATHEMATICS
1. Laguerre Filter Component
The Laguerre filter uses a cascade of four all-pass filters with a single gamma parameter:
4th order IIR (Infinite Impulse Response) filter
Single parameter (gamma) controls all filter characteristics
Provides smoother output than EMA with similar lag
Based on Laguerre polynomials from quantum mechanics
2. Kalman Filter Component
Implements a simplified Kalman filter for optimal estimation:
Prediction-correction algorithm from aerospace engineering
Dynamically adjusts based on estimation error
Provides mathematically optimal estimate of true price trend
Reduces noise while maintaining responsiveness
3. Adaptive Mechanism
Monitors market volatility in real-time
Adjusts filter parameters based on current conditions
More responsive in trending markets
More stable in ranging markets
━━━━━━━━━━━━━━━━━━━━━━━━━━━━━━━━━━━━━━━━
⚙️ INDICATOR SETTINGS
Laguerre Gamma (0.1-0.99): Controls filter smoothness. Higher = smoother but more lag
Adaptive Period (5-100): Lookback for volatility calculation
Kalman Noise Reduction (0.1-2.0): Higher = more noise filtering
Trend Threshold (0.0001-0.01): Minimum change to register trend shift
Recommended Settings:
Scalping: Gamma: 0.6, Period: 10, Noise: 0.3
Day Trading: Gamma: 0.8, Period: 20, Noise: 0.5 (default)
Swing Trading: Gamma: 0.9, Period: 30, Noise: 0.8
Position Trading: Gamma: 0.95, Period: 50, Noise: 1.2
━━━━━━━━━━━━━━━━━━━━━━━━━━━━━━━━━━━━━━━━
📈 TRADING SIGNALS
Primary Signals:
Cyan Line: Bullish trend - price above filter and filter ascending
Pink Line: Bearish trend - price below filter or filter descending
Color Change: Potential trend reversal point
Entry Strategies:
Trend Continuation: Enter on pullback to filter line in trending market
Trend Reversal: Enter on color change with volume confirmation
Breakout: Enter when price crosses filter with momentum
Exit Strategies:
Exit long when line turns from cyan to pink
Exit short when line turns from pink to cyan
Use filter as trailing stop in strong trends
━━━━━━━━━━━━━━━━━━━━━━━━━━━━━━━━━━━━━━━━
✨ ADVANTAGES OVER TRADITIONAL INDICATORS
Vs. Moving Averages:
Significantly less lag while maintaining smoothness
Adaptive to market conditions
Better noise filtering
Vs. Standard Filters:
Dual-filter approach provides optimal estimation
Mathematical foundation from signal processing
Self-adjusting parameters
Vs. Other Trend Indicators:
Cleaner signals with fewer whipsaws
Works across all timeframes
No repainting or lookahead bias
━━━━━━━━━━━━━━━━━━━━━━━━━━━━━━━━━━━━━━━━
🎓 MATHEMATICAL BACKGROUND
The Laguerre filter was developed by John Ehlers, applying Laguerre polynomials (used in quantum mechanics) to financial markets. These polynomials provide an elegant solution to the lag-smoothness tradeoff that plagues traditional moving averages.
The Kalman filter, developed by Rudolf Kalman in 1960, is used in everything from GPS systems to spacecraft navigation. It provides the mathematically optimal estimate of a system's state given noisy measurements.
By combining these two approaches, this indicator achieves what neither can alone: a smooth, responsive trend line that adapts to market conditions while filtering out noise.
━━━━━━━━━━━━━━━━━━━━━━━━━━━━━━━━━━━━━━━━
💡 TIPS FOR BEST RESULTS
Confirm with Volume: Strong trends should have increasing volume
Multiple Timeframes: Use higher timeframe for trend, lower for entry
Combine with Momentum: RSI or MACD can confirm filter signals
Market Conditions: Adjust noise parameter based on market volatility
Backtesting: Always test settings on your specific instrument
━━━━━━━━━━━━━━━━━━━━━━━━━━━━━━━━━━━━━━━━
⚠️ IMPORTANT NOTES
No indicator is perfect - always use proper risk management
Best suited for trending markets
May produce false signals in choppy/ranging conditions
Not financial advice - for educational purposes only
━━━━━━━━━━━━━━━━━━━━━━━━━━━━━━━━━━━━━━━━
🚀 CONCLUSION
The Laguerre-Kalman Adaptive Filter represents a significant advancement in technical analysis, bringing institutional-grade mathematical techniques to retail traders. Its unique combination of polynomial filtering and optimal estimation provides a clean, reliable trend-following tool that adapts to changing market conditions.
Whether you're scalping on the 1-minute chart or position trading on the daily, this indicator provides clear, actionable signals with minimal false positives.
"In the world of technical analysis, the edge comes from using better mathematics. This indicator delivers that edge."
━━━━━━━━━━━━━━━━━━━━━━━━━━━━━━━━━━━━━━━━
Developed by AlphaNatt | Professional Quantitative Trading Tools
Version: 1.0
Last Updated: 2025
Pine Script: v6
License: Open Source
Not financial advice. Always DYOR

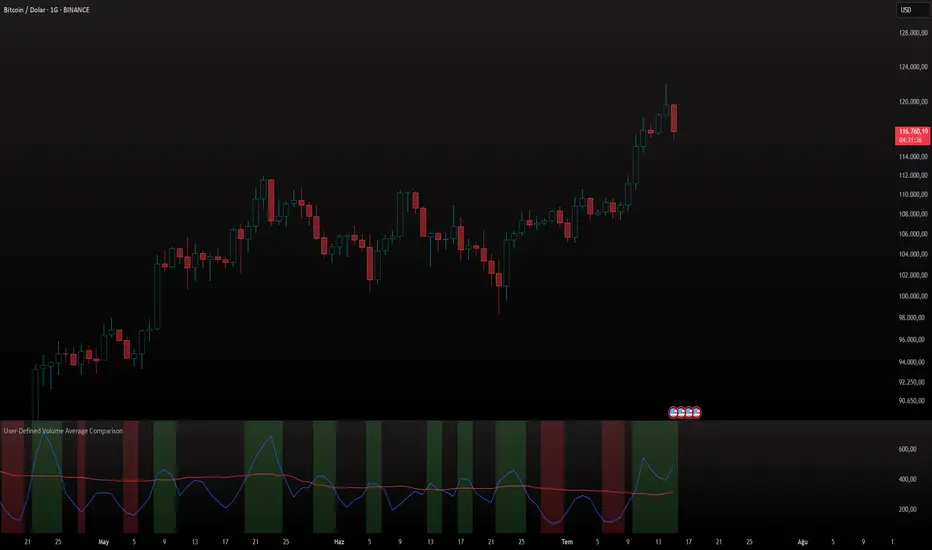
User-Defined Volume Average ComparisonThe User-Defined Volume Average Comparison indicator empowers traders to analyze volume trends by comparing short-term and long-term volume moving averages. With customizable periods, visual cues, and built-in alerts, it’s a versatile tool for identifying volume-driven market shifts across any timeframe, ideal for stocks, forex, crypto, and more.Key Features: Customizable Periods: Set short and long periods (in bars) to match your trading strategy.
Conditional Highlighting:
Green Background: Short-period volume average ≥ long-period volume average, signaling strong short-term volume.
Red Background: Short-period volume average < long-period volume average / 2, indicating low short-term volume.
Optional Labels: Toggle labels to display conditions on the chart (default: off).
Alerts: Receive notifications for key conditions: “Short ≥ Long Alert” for high volume periods.
“Short < Long/2 Alert” for low volume periods.
Visualized Averages: Plots short-period (blue) and long-period (red) volume moving averages for easy analysis.
How It Works:
The indicator calculates the simple moving average (SMA) of volume over user-defined short and long periods, then compares them: A green background and alert trigger when the short-period average meets or exceeds the long-period average, suggesting increased volume activity.
A red background and alert trigger when the short-period average falls below half of the long-period average, indicating reduced volume.
Labels (if enabled) display “Short ≥ Long” or “Short < Long/2” for clarity.
Settings: Short Period (Bars): Number of bars for the short-term volume average (default: 3).
Long Period (Bars): Number of bars for the long-term volume average (default: 50).
Show Labels: Enable or disable condition labels (default: off).
Use Cases: Trend Confirmation: Use green alerts to confirm high volume during breakouts or trend continuations.
Divergence Detection: Identify low volume periods with red alerts to spot potential reversals or weak trends.
Multi-Timeframe Analysis: Apply on any timeframe (e.g., 4H, 1D), with periods based on bars (e.g., 3 bars on 4H = 12 hours).
Notes: Periods are based on the chart’s timeframe (bars). For shorter timeframes, consider increasing period values for more significant results.
Set alerts to “Once Per Bar Close” for reliable notifications.
Combine with price-based indicators to enhance trading decisions.
Why Use This Indicator?
This indicator offers a flexible, alert-driven approach to volume analysis, helping traders of all levels make informed decisions. Its intuitive design and customizable settings make it a valuable addition to any trading setup.
KST Strategy [Skyrexio]Overview
KST Strategy leverages Know Sure Thing (KST) indicator in conjunction with the Williams Alligator and Moving average to obtain the high probability setups. KST is used for for having the high probability to enter in the direction of a current trend when momentum is rising, Alligator is used as a short term trend filter, while Moving average approximates the long term trend and allows trades only in its direction. Also strategy has the additional optional filter on Choppiness Index which does not allow trades if market is choppy, above the user-specified threshold. Strategy has the user specified take profit and stop-loss numbers, but multiplied by Average True Range (ATR) value on the moment when trade is open. The strategy opens only long trades.
Unique Features
ATR based stop-loss and take profit. Instead of fixed take profit and stop-loss percentage strategy utilizes user chosen numbers multiplied by ATR for its calculation.
Configurable Trading Periods. Users can tailor the strategy to specific market windows, adapting to different market conditions.
Optional Choppiness Index filter. Strategy allows to choose if it will use the filter trades with Choppiness Index and set up its threshold.
Methodology
The strategy opens long trade when the following price met the conditions:
Close price is above the Alligator's jaw line
Close price is above the filtering Moving average
KST line of Know Sure Thing indicator shall cross over its signal line (details in justification of methodology)
If the Choppiness Index filter is enabled its value shall be less than user defined threshold
When the long trade is executed algorithm defines the stop-loss level as the low minus user defined number, multiplied by ATR at the trade open candle. Also it defines take profit with close price plus user defined number, multiplied by ATR at the trade open candle. While trade is in progress, if high price on any candle above the calculated take profit level or low price is below the calculated stop loss level, trade is closed.
Strategy settings
In the inputs window user can setup the following strategy settings:
ATR Stop Loss (by default = 1.5, number of ATRs to calculate stop-loss level)
ATR Take Profit (by default = 3.5, number of ATRs to calculate take profit level)
Filter MA Type (by default = Least Squares MA, type of moving average which is used for filter MA)
Filter MA Length (by default = 200, length for filter MA calculation)
Enable Choppiness Index Filter (by default = true, setting to choose the optional filtering using Choppiness index)
Choppiness Index Threshold (by default = 50, Choppiness Index threshold, its value shall be below it to allow trades execution)
Choppiness Index Length (by default = 14, length used in Choppiness index calculation)
KST ROC Length #1 (by default = 10, value used in KST indicator calculation, more information in Justification of Methodology)
KST ROC Length #2 (by default = 15, value used in KST indicator calculation, more information in Justification of Methodology)
KST ROC Length #3 (by default = 20, value used in KST indicator calculation, more information in Justification of Methodology)
KST ROC Length #4 (by default = 30, value used in KST indicator calculation, more information in Justification of Methodology)
KST SMA Length #1 (by default = 10, value used in KST indicator calculation, more information in Justification of Methodology)
KST SMA Length #2 (by default = 10, value used in KST indicator calculation, more information in Justification of Methodology)
KST SMA Length #3 (by default = 10, value used in KST indicator calculation, more information in Justification of Methodology)
KST SMA Length #4 (by default = 15, value used in KST indicator calculation, more information in Justification of Methodology)
KST Signal Line Length (by default = 10, value used in KST indicator calculation, more information in Justification of Methodology)
User can choose the optimal parameters during backtesting on certain price chart.
Justification of Methodology
Before understanding why this particular combination of indicator has been chosen let's briefly explain what is KST, Williams Alligator, Moving Average, ATR and Choppiness Index.
The KST (Know Sure Thing) is a momentum oscillator developed by Martin Pring. It combines multiple Rate of Change (ROC) values, smoothed over different timeframes, to identify trend direction and momentum strength. First of all, what is ROC? ROC (Rate of Change) is a momentum indicator that measures the percentage change in price between the current price and the price a set number of periods ago.
ROC = 100 * (Current Price - Price N Periods Ago) / Price N Periods Ago
In our case N is the KST ROC Length inputs from settings, here we will calculate 4 different ROCs to obtain KST value:
KST = ROC1_smooth × 1 + ROC2_smooth × 2 + ROC3_smooth × 3 + ROC4_smooth × 4
ROC1 = ROC(close, KST ROC Length #1), smoothed by KST SMA Length #1,
ROC2 = ROC(close, KST ROC Length #2), smoothed by KST SMA Length #2,
ROC3 = ROC(close, KST ROC Length #3), smoothed by KST SMA Length #3,
ROC4 = ROC(close, KST ROC Length #4), smoothed by KST SMA Length #4
Also for this indicator the signal line is calculated:
Signal = SMA(KST, KST Signal Line Length)
When the KST line rises, it indicates increasing momentum and suggests that an upward trend may be developing. Conversely, when the KST line declines, it reflects weakening momentum and a potential downward trend. A crossover of the KST line above its signal line is considered a buy signal, while a crossover below the signal line is viewed as a sell signal. If the KST stays above zero, it indicates overall bullish momentum; if it remains below zero, it points to bearish momentum. The KST indicator smooths momentum across multiple timeframes, helping to reduce noise and provide clearer signals for medium- to long-term trends.
Next, let’s discuss the short-term trend filter, which combines the Williams Alligator and Williams Fractals. Williams Alligator
Developed by Bill Williams, the Alligator is a technical indicator that identifies trends and potential market reversals. It consists of three smoothed moving averages:
Jaw (Blue Line): The slowest of the three, based on a 13-period smoothed moving average shifted 8 bars ahead.
Teeth (Red Line): The medium-speed line, derived from an 8-period smoothed moving average shifted 5 bars forward.
Lips (Green Line): The fastest line, calculated using a 5-period smoothed moving average shifted 3 bars forward.
When the lines diverge and align in order, the "Alligator" is "awake," signaling a strong trend. When the lines overlap or intertwine, the "Alligator" is "asleep," indicating a range-bound or sideways market. This indicator helps traders determine when to enter or avoid trades.
The next indicator is Moving Average. It has a lot of different types which can be chosen to filter trades and the Least Squares MA is used by default settings. Let's briefly explain what is it.
The Least Squares Moving Average (LSMA) — also known as Linear Regression Moving Average — is a trend-following indicator that uses the least squares method to fit a straight line to the price data over a given period, then plots the value of that line at the most recent point. It draws the best-fitting straight line through the past N prices (using linear regression), and then takes the endpoint of that line as the value of the moving average for that bar. The LSMA aims to reduce lag and highlight the current trend more accurately than traditional moving averages like SMA or EMA.
Key Features:
It reacts faster to price changes than most moving averages.
It is smoother and less noisy than short-term EMAs.
It can be used to identify trend direction, momentum, and potential reversal points.
ATR (Average True Range) is a volatility indicator that measures how much an asset typically moves during a given period. It was introduced by J. Welles Wilder and is widely used to assess market volatility, not direction.
To calculate it first of all we need to get True Range (TR), this is the greatest value among:
High - Low
abs(High - Previous Close)
abs(Low - Previous Close)
ATR = MA(TR, n) , where n is number of periods for moving average, in our case equals 14.
ATR shows how much an asset moves on average per candle/bar. A higher ATR means more volatility; a lower ATR means a calmer market.
The Choppiness Index is a technical indicator that quantifies whether the market is trending or choppy (sideways). It doesn't indicate trend direction — only the strength or weakness of a trend. Higher Choppiness Index usually approximates the sideways market, while its low value tells us that there is a high probability of a trend.
Choppiness Index = 100 × log10(ΣATR(n) / (MaxHigh(n) - MinLow(n))) / log10(n)
where:
ΣATR(n) = sum of the Average True Range over n periods
MaxHigh(n) = highest high over n periods
MinLow(n) = lowest low over n periods
log10 = base-10 logarithm
Now let's understand how these indicators work in conjunction and why they were chosen for this strategy. KST indicator approximates current momentum, when it is rising and KST line crosses over the signal line there is high probability that short term trend is reversing to the upside and strategy allows to take part in this potential move. Alligator's jaw (blue) line is used as an approximation of a short term trend, taking trades only above it we want to avoid trading against trend to increase probability that long trade is going to be winning.
Almost the same for Moving Average, but it approximates the long term trend, this is just the additional filter. If we trade in the direction of the long term trend we increase probability that higher risk to reward trade will hit the take profit. Choppiness index is the optional filter, but if it turned on it is used for approximating if now market is in sideways or in trend. On the range bounded market the potential moves are restricted. We want to decrease probability opening trades in such condition avoiding trades if this index is above threshold value.
When trade is open script sets the stop loss and take profit targets. ATR approximates the current volatility, so we can make a decision when to exit a trade based on current market condition, it can increase the probability that strategy will avoid the excessive stop loss hits, but anyway user can setup how many ATRs to use as a stop loss and take profit target. As was said in the Methodology stop loss level is obtained by subtracting number of ATRs from trade opening candle low, while take profit by adding to this candle's close.
Backtest Results
Operating window: Date range of backtests is 2023.01.01 - 2025.05.01. It is chosen to let the strategy to close all opened positions.
Commission and Slippage: Includes a standard Binance commission of 0.1% and accounts for possible slippage over 5 ticks.
Initial capital: 10000 USDT
Percent of capital used in every trade: 60%
Maximum Single Position Loss: -5.53%
Maximum Single Profit: +8.35%
Net Profit: +5175.20 USDT (+51.75%)
Total Trades: 120 (56.67% win rate)
Profit Factor: 1.747
Maximum Accumulated Loss: 1039.89 USDT (-9.1%)
Average Profit per Trade: 43.13 USDT (+0.6%)
Average Trade Duration: 27 hours
These results are obtained with realistic parameters representing trading conditions observed at major exchanges such as Binance and with realistic trading portfolio usage parameters.
How to Use
Add the script to favorites for easy access.
Apply to the desired timeframe and chart (optimal performance observed on 1h BTC/USDT).
Configure settings using the dropdown choice list in the built-in menu.
Set up alerts to automate strategy positions through web hook with the text: {{strategy.order.alert_message}}
Disclaimer:
Educational and informational tool reflecting Skyrexio commitment to informed trading. Past performance does not guarantee future results. Test strategies in a simulated environment before live implementation.
