Donchian Screener█ OVERVIEW
This is a screener script for the Donchian Channel indicator . It's an excellent indicator for trend following, a trading strategy which tries to take advantage of long, medium or short-term moves that seem to play out in various markets.
█ DESCRIPTION
The screener works by scanning through up to 10 symbols and list down symbols that are currently breaking through the upper or lower band as definied by the Donchian Channels, at which point the market signals the start of a bullish or bearish trend.
█ HOW TO USE
After adding the indicator, open the script settings and type the symbol name and length to be used on the Donchian Channels for each stock.
█ PARAMETERS
- Use High/Low Price Breakouts: check this box if you want to use price high/low instead of price close to identify breakouts
- Panel Position: choose whether you want to position the panel on the top, middle or bottom right side of the graph (default is top)
- Default Timeframe: what timeframe to use on the screener (default is daily)
- Ticker: the ticker name you want to monitor
- Length: length parameter used on Donchian Channel indicator
█ FEATURES
The screener can scan up to 10 symbols each time.
█ LIMITATIONS
The screener will scan the symbols breaking out bands on the current bar, and as such, there maybe some delays depending on the stock/ etf /crypto you choose. Some exchanges require an additional subscription to get realtime data.
Search in scripts for "band"

Cora Combined Suite v1 [JopAlgo]Cora Combined Suite v1 (CCSV1)
This is an 2 in 1 indicator (Overlay & Oscillator) the Cora Combined Suite v1 .
CCSV1 combines a price-pane Overlay for structure/trend with a compact Oscillator for timing/pressure. It’s designed to be clear, beginner-friendly, and largely automatic: you pick a profile (Scalp / Intraday / Swing), choose whether to run as Overlay or Oscillator, and CCSV1 tunes itself in the background.
What’s inside — at a glance
1) Overlay (price pane)
CoRa Wave: a smooth trend line based on a compound-ratio WMA (CRWMA).
Green when the slope rises (bull bias), Red when it falls (bear bias).
Asymmetric ATR Cloud around the CoRa Wave
Width expands more up when buyer pressure dominates and more down when seller pressure dominates.
Fill is intentionally light, so candlesticks remain readable.
Chop Guard (Range-Lock Gate)
When the cloud stays very narrow versus ATR (classic “dead water”), pullback alerts are muted to avoid noise.
Visuals don’t change—only the alerting logic goes quiet.
Typical Overlay reads
Trend: Follow the CoRa color; green favors long setups, red favors shorts.
Value: Pullbacks into/through the cloud in trend direction are higher-quality than chasing breaks far outside it.
Dominance: A visibly asymmetric cloud hints which side is funding the move (buyers vs sellers).
2) Oscillator (subpane or inline preview)
Stretch-Z (columns): how far price is from the CoRa mean (mean-reversion context), clipped to ±clip.
Near 0 = equilibrium; > +2 / < −2 = stretched/extended.
Slope-Z (line): z-score of CoRa’s slope (momentum of the trend line).
Crossing 0 upward = potential bullish impulse; downward = potential bearish impulse.
VPO (stepline): a normalized Volume-Pressure read (positive = buyers funding, negative = sellers).
Rendered as a clean stepline to emphasize state changes.
Event Bands ±2 (subpane): thin reference lines to spot extension/exhaustion zones fast.
Floor/Ceiling lines (optional): quiet boundaries so the panel doesn’t feel “bottomless.”
Inline vs Subpane
Inline (overlay): the oscillator auto-anchors and scales beneath price, so it never crushes the price scale.
Subpane (raw): move to a new pane for the classic ±clip view (with ±2 bands). Recommended for systematic use.
Why traders like it
Two in one: Structure on the chart, timing in the panel—built to complement each other.
Retail-first automation: Choose Scalp / Intraday / Swing and let CCSV1 auto-tune lengths, clips, and pressure windows.
Robust statistics: On fast, spiky markets/timeframes, it prefers outlier-resistant math automatically for steadier signals.
Optional HTF gate: You can require higher-timeframe agreement for oscillator alerts without changing visuals.
Quick start (simple playbook)
Run As
Overlay for structure: assess trend direction, where value is (the cloud), and whether chop guard is active.
Oscillator for timing: move to a subpane to see Stretch-Z, Slope-Z, VPO, and ±2 bands clearly.
Profile
Scalp (1–5m), Intraday (15–60m), or Swing (4H–1D). CCSV1 adjusts length/clip/pressure windows accordingly.
Overlay entries
Trade with CoRa color.
Prefer pullbacks into/through the cloud (trend direction).
If chop guard is active, wait; let the market “breathe” before engaging.
Oscillator timing
Look for Funded Flips: Slope-Z crossing 0 in the direction of VPO (i.e., momentum + funded pressure).
Use ±2 bands to manage risk: stretched conditions can stall or revert—better to scale or wait for a clean reset.
Optional HTF gate
Enable to green-light only those oscillator alerts that align with your chosen higher timeframe.
What each signal means (plain language)
CoRa turns green/red (Overlay): trend bias shift on your chart.
Cloud width tilts asymmetrically: one side (buyers/sellers) is dominating; extensions on that side are more likely.
Stretch-Z near 0: fair value around CoRa; pullback timing zone.
Stretch-Z > +2 / < −2: extended; watch for slowing momentum or scale decisions.
Slope-Z cross up/down: new impulse starting; combine with VPO sign to avoid unfunded crosses.
VPO positive/negative: net buying/selling pressure funding the move.
Alerts included
Overlay
Pullback Long OK
Pullback Short OK
Oscillator
Funded Flip Up / Funded Flip Down (Slope-Z crosses 0 with VPO agreement)
Pullback Long Ready / Pullback Short Ready (near equilibrium with aligned momentum and pressure)
Exhaustion Risk (Long/Short) (Stretch-Z beyond ±2 with weakening momentum or pressure)
Tip: Keep chart alerts concise and use strategy rules (TP/SL/filters) in your trade plan.
Best practices
One glance workflow
Read Overlay for direction + value.
Use Oscillator for trigger + confirmation.
Pairing
Combine with S/R or your preferred execution framework (e.g., your JopAlgo setups).
The suite is neutral: it won’t force trades; it highlights context and quality.
Markets
Works on crypto, indices, FX, and commodities.
Where real volume is available, VPO is strongest; on synthetic volume, treat VPO as a soft filter.
Timeframes
Use the Profile preset closest to your style; feel free to fine-tune later.
For multi-TF trading, enable the HTF gate on the oscillator alerts only.
Inputs you’ll actually use (the rest can stay on Auto)
Run As: Overlay or Oscillator.
Profile: Scalp / Intraday / Swing.
Oscillator Render: “Subpane (raw)” for a classic panel; “Inline (overlay)” only for a quick preview.
HTF gate (optional): require higher-timeframe Slope-Z agreement for oscillator alerts.
Everything else ships with sensible defaults and auto-logic.
Limitations & tips
Not a strategy: CCSV1 is a decision support tool; you still need your entry/exit rules and risk management.
Non-repainting design: Signals finalize on bar close; intrabar graphics can adjust during the bar (Pine standard).
Very flat sessions: If price and volume are extremely quiet, expect fewer alerts; that restraint is intentional.
Who is this for?
Beginners who want one clean overlay for structure and one simple oscillator for timing—without wrestling settings.
Intermediates seeking a coherent trend/pressure framework with HTF confirmation.
Advanced users who appreciate robust stats and clean engineering behind the visuals.
Disclaimer: Educational purposes only. Not financial advice. Trading involves risk. Use at your own discretion.

Nadaraya-Watson Envelope [Dynamic Adaptive Working]LuxAlgo'a kernel channel-based, modified for dynamic stochastic bandwidth adaptation.
Nadaraya-Watson Envelope , "NWE Adaptive (Working)"

mean reversion Spread Z-Score Your main "actor" is the Blue Line 🔵 (the Z-Score). It tells you if your spread is "expensive" or "cheap" compared to its average.
The other lines are your action zones.
Here is how to read the signals:
Scenario 1: SELL the Spread (The spread is TOO EXPENSIVE)
• ENTRY Signal: The Blue Line 🔵 moves up and crosses the Red Line 🔴 (at +1.8).
• Meaning: MNQ has become far too expensive compared to MES. The rubber band is stretched too far upwards.
• Your Action (Sell):
• ✅ SELL MNQ
• ✅ BUY MES
• EXIT Signal: The Blue Line 🔵 comes back down and crosses the Dotted Red Line (at +0.5).
• Meaning: The rubber band is back to normal. It's time to take your profits.
• Your Action (Close):
• ✅ BUY BACK your MNQ
• ✅ SELL your MES
Scenario 2: BUY the Spread (The spread is TOO CHEAP)
• ENTRY Signal: The Blue Line 🔵 moves down and crosses the Green Line 🟢 (at -1.8).
• Meaning: MNQ has become far too cheap compared to MES. The rubber band is stretched too far downwards.
• Your Action (Buy):
• ✅ BUY MNQ
• ✅ SELL MES
• EXIT Signal: The Blue Line 🔵 moves back up and crosses the Dotted Green Line (at -0.5).
• Meaning: The rubber band is back to normal. It's time to take your profits.
• Your Action (Close):
• ✅ SELL your MNQ
• ✅ BUY BACK your MES
In summary:
• Blue Line 🔵 touches Red Line 🔴 = Sell the spread.
• Blue Line 🔵 touches Green Line 🟢 = Buy the spread.

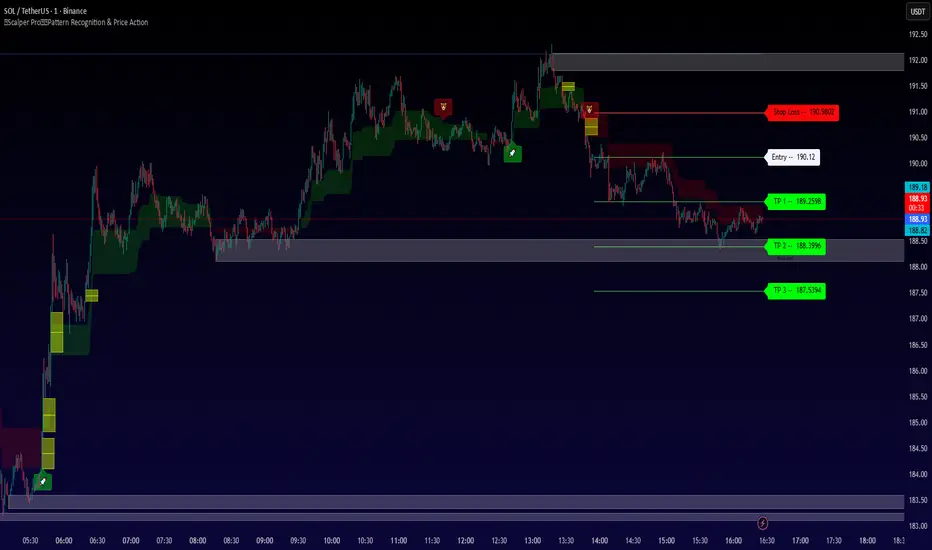
Scalper Pro Pattern Recognition & Price ActionOVERVIEW
Scalper Pro is a comprehensive multi-timeframe trading indicator that combines Smart Money Concepts (SMC) with traditional technical analysis to provide scalpers and day traders with high-probability entry and exit signals. This indicator integrates multiple analytical frameworks into a unified visual system designed specifically for short-term trading strategies.
ORIGINALITY & PURPOSE
What Makes This Script Original
This script is not a simple mashup of existing indicators. Instead, it represents a carefully orchestrated integration of complementary analytical methods that work together to solve a specific problem: identifying high-probability scalping opportunities in volatile markets.
The unique value proposition:
Adaptive Trend Filtering System - Combines a customized SuperTrend algorithm with dual-period range filters (Cirrus Cloud) and Hull Moving Average trend cloud to create a three-layer trend confirmation system
Smart Money Concepts Integration - Incorporates institutional trading concepts (Order Blocks, Fair Value Gaps, Break of Structure) with retail technical indicators for a complete market structure view
Dynamic Risk Management - Automatically calculates stop-loss and take-profit levels based on ATR volatility, providing objective position sizing
ADX-Based Market Regime Detection - Identifies ranging vs. trending markets through ADX analysis with visual bar coloring to prevent whipsaws during consolidation
Why Combine These Specific Components
Each component addresses a specific weakness in scalping:
SuperTrend provides the primary directional bias but can generate false signals in ranging markets
Range Filters smooth out noise and confirm trend direction, reducing SuperTrend false positives
ADX Analysis prevents trading during low-volatility consolidation when most indicators fail
SMC Elements identify institutional activity zones where price is likely to react strongly
ATR-Based Risk Management adapts position sizing to current volatility conditions
The synergy creates a system where signals are only generated when multiple confirmation layers align, significantly reducing false signals common in single-indicator approaches.
HOW IT WORKS
Core Calculation Methodology
1. SuperTrend Signal Generation
The script uses a modified SuperTrend algorithm with the following calculation:
ATR = Average True Range (default: 10 periods)
Factor = 7 (default sensitivity multiplier)
Upper Band = Source + (Factor × ATR)
Lower Band = Source - (Factor × ATR)
Directional Logic:
When price crosses above SuperTrend → Bullish signal
When price crosses below SuperTrend → Bearish signal
SuperTrend value is plotted as dynamic support/resistance
Key Modification: The sensitivity parameter (nsensitivity * 7) allows users to adjust the aggressiveness of trend detection without changing the core ATR calculation.
2. Range Filter System (Cirrus Cloud)
The Range Filter uses a smoothed range calculation to filter out market noise:
Smooth Range Calculation:
WPER = (Period × 2) - 1
AVRNG = EMA(|Price - Price |, Period)
Smooth Range = EMA(AVRNG, WPER) × Multiplier
Two-Layer System:
Layer 1: 22-period with 6x multiplier (broader trend)
Layer 2: 15-period with 5x multiplier (tighter price action)
Visual Output: The space between these two filters is colored:
Green fill = Bullish trend (Layer 1 > Layer 2)
Red fill = Bearish trend (Layer 1 < Layer 2)
This creates a "cloud" that expands during strong trends and contracts during consolidation.
3. ADX Market Regime Detection
Calculation:
+DM = Positive Directional Movement
-DM = Negative Directional Movement
True Range = RMA of True Range (15 periods)
+DI = 100 × RMA(+DM, 15) / True Range
-DI = 100 × RMA(-DM, 15) / True Range
ADX = 100 × RMA(|+DI - -DI| / (+DI + -DI), 15)
Threshold System:
ADX < Threshold (default 15) = Ranging market → Bar color changes to purple
ADX > Threshold = Trending market → Normal bar coloring applies
Purpose: This prevents taking trend-following signals during sideways markets where most indicators produce whipsaws.
4. Smart Money Concepts (SMC) Integration
Order Blocks (OB):
Identified using swing high/low detection with customizable pivot length
Bullish OB: Last down-close candle before bullish Break of Structure (BOS)
Bearish OB: Last up-close candle before bearish BOS
Extended forward until price breaks through them
Fair Value Gaps (FVG):
Detected when a three-candle gap exists:
Bullish FVG: Low > High
Bearish FVG: High < Low
Filtered by price delta percentage to ensure significant gaps
Displayed as boxes that delete when price fills the gap
Break of Structure (BOS) vs. Change of Character (CHoCH):
BOS = Price breaks the previous structural high/low in the current trend direction
CHoCH = Price breaks structure in the opposite direction (potential trend reversal)
Both internal (minor) and swing (major) structures are tracked
Equal Highs/Lows (EQH/EQL):
Detected when consecutive swing highs/lows are within ATR threshold
Often indicates liquidity pools that price may sweep before reversing
5. ATR-Based Risk Management
Calculation:
ATR Band = ATR(14) × Risk Multiplier (default 3%)
Stop Loss = Entry - ATR Band (for longs) or Entry + ATR Band (for shorts)
Take Profit Levels:
TP1 = Entry + (Entry - Stop Loss) × 1
TP2 = Entry + (Entry - Stop Loss) × 2
TP3 = Entry + (Entry - Stop Loss) × 3
Dynamic Labels: Stop loss and take profit levels are automatically calculated and displayed as labels on the chart when new signals trigger.
6. Hull Moving Average Trend Cloud
HMA = WMA(2 × WMA(Close, Period/2) - WMA(Close, Period), sqrt(Period))
Period = 600 bars (long-term trend)
The HMA provides a smoothed long-term trend reference that's more responsive than traditional moving averages while filtering out short-term noise.
HOW TO USE THE INDICATOR
Entry Signals
Primary Buy Signal:
SuperTrend changes to green (price crosses above)
ADX shows market is NOT ranging (bars are NOT purple)
Price is within or near a bullish Order Block OR bullish FVG
Cirrus Cloud shows green fill (Layer 1 > Layer 2)
Primary Sell Signal:
SuperTrend changes to red (price crosses below)
ADX shows market is NOT ranging
Price is within or near a bearish Order Block OR bearish FVG
Cirrus Cloud shows red fill (Layer 1 < Layer 2)
Confirmation Layers
Higher Probability Trades Include:
Bullish/Bearish BOS in the same direction as signal
Equal highs/lows being swept before entry
Price respecting premium/discount zones (above/below equilibrium)
Multiple timeframe alignment (use MTF settings)
Exit Strategy
The indicator provides three take-profit levels:
TP1: Conservative target (1:1 risk-reward)
TP2: Moderate target (2:1 risk-reward)
TP3: Aggressive target (3:1 risk-reward)
Suggested Exit Approach:
Close 1/3 position at TP1
Move stop to breakeven
Close 1/3 position at TP2
Trail remaining position or exit at TP3
Risk Management
Stop Loss:
Use the ATR-based stop loss level displayed on chart
Alternatively, use percentage-based stop (adjustable in settings)
Never risk more than 1-2% of account per trade
Position Sizing:
Position Size = (Account Risk $) / (Entry Price - Stop Loss Price)
CUSTOMIZABLE SETTINGS
Core Parameters
Buy/Sell Signals:
Toggle signals on/off
Adjust SuperTrend sensitivity (0.5 - 2.0)
Risk Management:
Show/hide TP/SL levels
ATR period (default: 14)
Risk percentage (default: 3%)
Number of decimal places for price labels
Trend Features:
Cirrus Cloud display toggle
Range filter periods (x1, x2, x3, x4)
Hull MA length for trend cloud
Smart Money Concepts:
Order Block settings (swing length, display count)
Fair Value Gap parameters (auto-threshold, extend length)
Structure detection (internal vs swing)
EQH/EQL threshold
ADX Settings:
ADX length (default: 15)
Sideways threshold (10-30, default: 15)
Bar color toggle
Display Options:
Previous day/week/month high/low levels
Premium/Discount/Equilibrium zones
Trend candle coloring (colored or monochrome)
BEST PRACTICES & TRADING TIPS
Optimal Use Cases
Scalping on lower timeframes (1m, 5m, 15m)
Rapid entry/exit with clear TP levels
ADX filter prevents choppy market entries
Day trading on medium timeframes (30m, 1H)
Stronger trend confirmation
Better risk-reward ratios
Swing trading entries on higher timeframes (4H, Daily)
Higher-probability structural setups
Larger ATR-based stops accommodate volatility
Market Conditions
Best Performance:
Trending markets with clear directional bias
Post-news volatility with defined structure
Markets respecting support/resistance levels
Avoid Trading When:
ADX indicator shows purple bars (ranging market)
Multiple conflicting signals across timeframes
Major news events without clear price structure
Low volume periods (market open/close)
Common Mistakes to Avoid
Ignoring the ADX filter - Taking signals during ranging markets leads to whipsaws
Not waiting for confirmation - Enter only when multiple layers align
Overtrading - Fewer high-quality setups outperform many mediocre ones
Ignoring risk management - Always use the calculated stop losses
Fighting the trend - Trade WITH the SuperTrend and Cirrus Cloud direction
TECHNICAL SPECIFICATIONS
Indicator Type: Overlay (plots on price chart)
Calculation Resources:
Max labels: 500
Max lines: 500
Max boxes: 500
Max bars back: 500
Pine Script Version: 5
Compatible Timeframes: All timeframes (optimized for 1m to 1D)
Compatible Instruments:
Forex pairs
Crypto assets
Stock indices
Individual stocks
Commodities
THEORETICAL FOUNDATION
Trend-Following Concepts
This indicator is based on the principle that markets trend more often than they range, and that trends tend to persist. The SuperTrend component captures this momentum while the range filters prevent premature entries during pullbacks.
Smart Money Theory
The SMC elements are based on the concept that institutional traders (banks, hedge funds) leave footprints in the form of:
Order Blocks: Areas where large orders were placed
Fair Value Gaps: Inefficient price movements that may be revisited
Liquidity Sweeps: Stop hunts before continuation (EQH/EQL)
Volatility-Based Position Sizing
Using ATR for stop-loss placement ensures that stop distances adapt to current market conditions:
Tight stops in low volatility (avoids excessive risk)
Wider stops in high volatility (avoids premature stop-outs)
PERFORMANCE EXPECTATIONS
Realistic Expectations
Win Rate:
Expected: 45-55% (trend-following systems rarely exceed 60%)
Higher win rates on trending days
Lower win rates during consolidation (even with ADX filter)
Risk-Reward Ratio:
Target: 1.5:1 minimum (TP2)
Achievable: 2:1 to 3:1 on strong trends
Drawdowns:
Normal: 10-15% of account during choppy periods
Maximum: Should not exceed 20% with proper risk management
Optimization Tips
Backtesting Recommendations:
Test on at least 1 year of historical data
Include different market conditions (trending, ranging, volatile)
Adjust SuperTrend sensitivity per instrument
Optimize ADX threshold for your specific market
Record trades to identify personal execution errors
FREQUENTLY ASKED QUESTIONS
Q: Can I use this for automated trading?
A: The indicator provides signals, but you'll need to code a strategy script separately for automation. The signals can trigger alerts that connect to trading bots.
Q: Why do I see conflicting signals?
A: This is normal during transition periods. Wait for all confirmation layers to align before entering.
Q: How often should I expect signals?
A: Depends on timeframe and market conditions. On 5m charts during trending markets: 3-7 quality setups per session.
Q: Can I use only some features?
A: Yes, all components can be toggled on/off. However, the system works best with all confirmations active.
Q: What's the difference between internal and swing structures?
A: Internal = minor price structures (smaller pivots). Swing = major price structures (larger pivots). Both provide different levels of confirmation.
DISCLAIMER
This indicator is a tool for technical analysis and should not be the sole basis for trading decisions. Past performance does not guarantee future results. Always:
Use proper risk management
Test on demo accounts first
Never risk more than you can afford to lose
Combine with fundamental analysis when applicable
Understand that no indicator is 100% accurate
License: Mozilla Public License 2.0
Author: DrFXGOD
VERSION HISTORY & UPDATES
Initial Release - Version 1.0
Integrated SuperTrend, Range Filters, ADX, SMC concepts
ATR-based risk management
Multi-timeframe support
Customizable visual elements
SUPPORT & DOCUMENTATION
For questions, suggestions, or bug reports, please comment on the script page or contact the author through TradingView.
Additional Resources:
Smart Money Concepts: Research ICT (Inner Circle Trader) materials
ATR and Volatility: Refer to Wilder's original ATR documentation
SuperTrend Indicator: Study original SuperTrend strategy papers
2 Bandas de Bollinguer (10-20) + 4 EMA + 2 SMA 2 BB (10-20) + 4 EMA (35-50-100-200) + 2 SMA (75-100) configurable

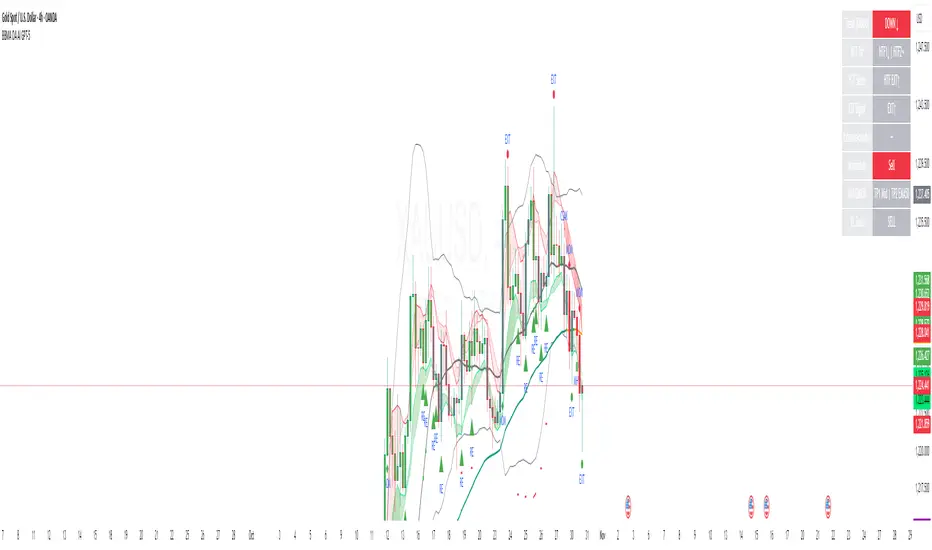
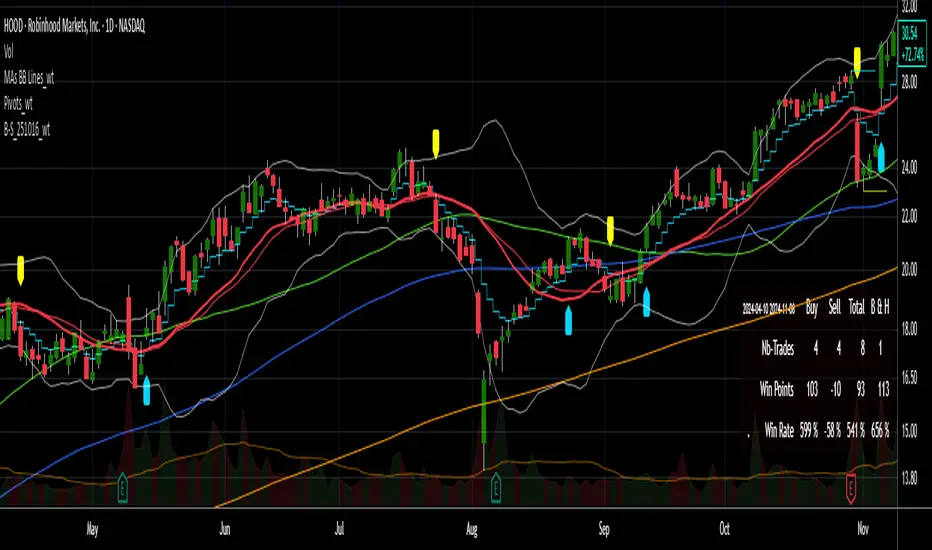
Buy/Sell Signals [WynTrader]My name is WynTrader. I cumulate 24 years of experience.
This Indicator produces Buy/Sell Signals using these features:
- Fast and Slow Moving averages (modifiable) optimized at EMA-8 and SMA-35
- Bollinger Bands (modifiable) optimized at Basis-18 and Multiplier-1
Also, the Buy/Sell Signals are conditioned by three Filters (optionable, modifiable) :
. Bollinger-Bands Lookback
. High-Low vs Candle Range %
. Distance from Fast and Slow Moving averages %
The Results Calculation presented in a Table are based :
- on the Current Chart Visible Range (optionable)
or
- on the specified TIme Frame Start and End Dates (modifiable)
The Table shows Calculation Results of the Buy and Sell Signals that are activated on the chart, with the Number of Trades (Signals), the Winning Points and the Win Rate %. The Buy&Hold starts calculation at the first Buy encountered.
So be surprised by my Buy/Sell Indicator. But always remember that the world is not perfect. The Graal Indicator, even with AI, doesn't already exist, maybe one day (all of us richier...), but not now. , depending on the chart product (stocks...), volatility, probabilities, unpredictable behaviour. , the moves, etc.
Enjoy
WynTrader
P. s. :
My name is WynTrader. I cumulate 24 years of experience. In 2001, I took an intensive technical analysis course taught by an exceptional friend, Cyril, who taught me everything I know. The foundation I gained through his teaching remains solid and relevant to this day, never failing me.
Before i made this Indicator, I have used many Trading View Buy/Sell Indicators using alone or combined RSI, SMI, OBV, MACD ATR, ADX, Neural, Fractal, Geometry, etc., that are already available for the Trading View community. A great thanks to those who give their time that help me build this tool.
Note that I'm not a programmer, so... ;-)
Multi-Timeframe Trend Indicator with Signals═══════════════════════════════════════════════════════════════
Multi-Timeframe Trend Indicator with Signals
by Zakaria Safri
═══════════════════════════════════════════════════════════════
⚠️ IMPORTANT DISCLAIMERS:
━━━━━━━━━━━━━━━━━━━━━━━━━━━━━━━━━━━━━━━━━━━━━━━━━━━━━━━━━━━━━━
• This indicator may REPAINT on unconfirmed bars
• Signals appear in real-time but may change or disappear
• FOR EDUCATIONAL PURPOSES ONLY - NOT FINANCIAL ADVICE
• Past performance does not guarantee future results
• Always do your own research and use proper risk management
• The Risk Management feature is VISUAL ONLY - does not execute trades
━━━━━━━━━━━━━━━━━━━━━━━━━━━━━━━━━━━━━━━━━━━━━━━━━━━━━━━━━━━━━━
📊 OVERVIEW:
━━━━━━━━━━━━━━━━━━━━━━━━━━━━━━━━━━━━━━━━━━━━━━━━━━━━━━━━━━━━━━
This indicator combines multiple technical analysis tools to help identify
potential trend directions and entry/exit points across different timeframes.
It uses SuperTrend, EMAs, ADX, RSI, and Keltner Channels to generate signals.
🎯 KEY FEATURES:
━━━━━━━━━━━━━━━━━━━━━━━━━━━━━━━━━━━━━━━━━━━━━━━━━━━━━━━━━━━━━━
📍 SIGNAL TYPES:
• All Signals: Shows all SuperTrend crossovers
• Filtered Signals: Additional EMA filter for potentially higher quality signals
• Signals use barstate.isconfirmed to reduce (but not eliminate) repainting
📈 TREND ANALYSIS:
• Trend Ribbon: 8 EMAs creating a visual trend direction indicator
• Trend Cloud: EMA 150/250 cloud for long-term trend context
• Chaos Trend Line: Dynamic support/resistance trend line
• Multi-timeframe dashboard showing trend across 8 timeframes (3m to Daily)
📊 TECHNICAL INDICATORS:
• Keltner Channels: Dynamic price channels
• RSI Background: Visual overbought/oversold zones
• Candlestick Coloring: Three modes (CleanScalper/Trend Ribbon/Moving Average)
• ADX-based trend strength analysis for MTF dashboard
🎯 VISUAL TOOLS:
• Order Blocks: Supply/demand zones (optional)
• Channel Breakouts: Pivot-based support/resistance levels
• Reversal Signals: RSI-based potential reversal indicators
• Visual TP/SL Lines: For reference only - does NOT execute trades
📊 DASHBOARD:
• Real-time multi-timeframe trend analysis
• Volatility indicator (Very Low to Very High)
• Current RSI value with color coding
• Customizable position and size
⚙️ SETTINGS:
━━━━━━━━━━━━━━━━━━━━━━━━━━━━━━━━━━━━━━━━━━━━━━━━━━━━━━━━━━━━━━
MAIN SETTINGS:
• Sensitivity: Controls signal frequency (lower = more signals)
• Signal Type: Choose between All Signals or Filtered Signals
• Factor: ATR multiplier for SuperTrend calculation
TREND SETTINGS:
• Toggle Trend Ribbon, Trend Cloud, Chaos Trend, Order Blocks
• Moving Average: Customizable EMA (default 200)
ADVANCED SETTINGS:
• Candlestick coloring with 3 different modes
• Overbought/Oversold background coloring
• Channel breakout levels
• Show/hide signals
RISK MANAGEMENT (VISUAL ONLY):
• ⚠️ Does NOT execute trades automatically
• Shows potential Take Profit levels (TP1, TP2, TP3)
• Shows potential Stop Loss level
• Adjustable TP strength multiplier
• For educational reference only
📖 HOW TO USE:
━━━━━━━━━━━━━━━━━━━━━━━━━━━━━━━━━━━━━━━━━━━━━━━━━━━━━━━━━━━━━━
1. SIGNAL INTERPRETATION:
• "Buy" signals appear below candles when conditions are met
• "Sell" signals appear above candles when conditions are met
• Wait for bar close confirmation to avoid repainting
• Use multiple timeframes for confluence
2. TREND CONFIRMATION:
• Check the multi-timeframe dashboard for trend alignment
• Use Trend Ribbon for visual trend direction
• Trend Cloud shows longer-term market bias
• Green candles = potential uptrend, Red = potential downtrend
3. ENTRY/EXIT STRATEGY:
• Combine signals with other analysis tools
• Check volatility status before entering trades
• Use support/resistance levels for confirmation
• The visual TP/SL lines are for planning only
4. RISK MANAGEMENT:
• Always use stop losses (indicator shows suggested levels only)
• Position size according to your risk tolerance
• Never risk more than you can afford to lose
• The indicator does NOT manage trades automatically
⚠️ LIMITATIONS & RISKS:
━━━━━━━━━━━━━━━━━━━━━━━━━━━━━━━━━━━━━━━━━━━━━━━━━━━━━━━━━━━━━━
REPAINTING:
• Signals may appear and disappear on unconfirmed bars
• Always wait for bar close before taking action
• Historical performance may look better than real-time results
FALSE SIGNALS:
• No indicator is 100% accurate
• Signals can fail in ranging/choppy markets
• Use additional confirmation methods
• Consider market context and fundamentals
VISUAL TP/SL:
• Lines are for reference/planning only
• Does NOT place or manage actual trades
• You must manually set your own stop losses
• TP levels are calculated estimates, not guarantees
🔧 TECHNICAL DETAILS:
━━━━━━━━━━━━━━━━━━━━━━━━━━━━━━━━━━━━━━━━━━━━━━━━━━━━━━━━━━━━━━
• Version: Pine Script v5
• Overlay: Yes (displays on main chart)
• Anti-repaint measures: Uses barstate.isconfirmed on signals
• Security function: Uses lookahead protection for higher timeframes
• Dynamic requests: Enabled for MTF analysis
• Max labels: 500
📚 COMPONENTS EXPLAINED:
━━━━━━━━━━━━━━━━━━━━━━━━━━━━━━━━━━━━━━━━━━━━━━━━━━━━━━━━━━━━━━
SUPERTREND:
• Core signal generator using ATR-based bands
• Crossovers indicate potential trend changes
• Adjustable via Sensitivity and Factor inputs
EMA FILTER:
• Uses 200 EMA as trend filter (customizable)
• Filtered signals require price above/below EMA
• Helps reduce false signals in ranging markets
ADX TREND QUALITY:
• Measures trend strength across timeframes
• Used in multi-timeframe dashboard
• Shows Bullish/Bearish/Neutral states
KELTNER CHANNELS:
• Multiple bands showing volatility zones
• Color-coded based on RSI levels
• Helps identify overbought/oversold conditions
ORDER BLOCKS:
• Identifies supply/demand zones
• Based on price structure and pivots
• Can extend to the right for projection
💡 BEST PRACTICES:
━━━━━━━━━━━━━━━━━━━━━━━━━━━━━━━━━━━━━━━━━━━━━━━━━━━━━━━━━━━━━━
✓ Use multiple timeframe confirmation
✓ Wait for bar close before acting on signals
✓ Combine with support/resistance analysis
✓ Check overall market conditions
✓ Use proper risk management (1-2% per trade)
✓ Backtest on your specific market/timeframe
✓ Paper trade before using real money
✓ Keep a trading journal
✓ Adjust settings to your trading style
✗ Don't rely solely on this indicator
✗ Don't ignore risk management
✗ Don't trade on unconfirmed signals
✗ Don't overtrade every signal
✗ Don't use without understanding how it works
✗ Don't expect the TP/SL feature to trade for you
📞 SUPPORT & UPDATES:
━━━━━━━━━━━━━━━━━━━━━━━━━━━━━━━━━━━━━━━━━━━━━━━━━━━━━━━━━━━━━━
Creator: Zakaria Safri
Version: 4.3 (Compliance Update)
For questions or feedback, please use TradingView's comment section.
⚖️ FINAL DISCLAIMER:
━━━━━━━━━━━━━━━━━━━━━━━━━━━━━━━━━━━━━━━━━━━━━━━━━━━━━━━━━━━━━━
This indicator is provided for EDUCATIONAL and INFORMATIONAL purposes only.
It is NOT financial advice, investment advice, or a recommendation to buy/sell.
Trading involves substantial risk of loss. Past performance, whether actual or
indicated by historical tests of strategies, is not indicative of future results.
The creator assumes NO responsibility for your trading results. You are solely
responsible for your own investment decisions and due diligence.
Always consult with a qualified financial advisor before making investment decisions.
By using this indicator, you acknowledge and accept these risks and limitations.

BMSB Watchlist Alert - Daily w/ 1% Proximity# Bull Market Support Band - Daily Updates with Proximity Alerts
## Overview
This indicator tracks the Bull Market Support Band (20-week SMA and 21-week EMA) with daily resolution updates and proximity warnings. The weekly moving averages update every day on your chart, giving you more frequent signals than traditional weekly-only scripts.
## What It Does
The script monitors price action relative to the BMSB and generates alerts for:
- Price crossing above or below either the 20W SMA or 21W EMA
- Price coming within 1% of either moving average (early warning system)
This proximity feature is useful for catching potential support/resistance tests before they actually happen, giving you advance notice to prepare for entries or exits.
## Key Features
- Weekly MAs that update daily for more responsive monitoring
- Configurable proximity threshold (default 1%, adjustable from 0.1% to 5%)
- Visual proximity zones shown as dotted lines around each MA
- Color-coded background highlighting (green when above both MAs, red when below both, orange when in proximity zone)
- On-chart labels for crosses and proximity warnings
- Status table showing current position relative to the band
## Setup for Watchlist Alerts
1. Add the indicator to any chart
2. Create alerts using these conditions:
- "BMSB Cross Alert" - fires on actual crosses
- "BMSB Proximity Alert" - fires when entering the 1% zone
3. Set interval to 1 day (recommended) or 4 hour for more frequent checks
4. Use "Once Per Bar Close" for the trigger option
5. Apply the same alert to your entire watchlist
## Settings
You can toggle on/off:
- Cross above alerts
- Cross below alerts
- Proximity alerts
- Proximity percentage adjustment
- Visual elements (labels, MA lines, proximity zones)
## Notes
The BMSB is commonly used in crypto markets to identify bull market pullback support levels. This implementation adds the proximity warning system to help you anticipate potential tests of these key levels rather than waiting for confirmed crosses.
Works on any timeframe but designed for daily monitoring of weekly moving averages.

BBKC Combined Channels OverlayBBKC Combined Channels Overlay (Volatility & Mean Reversion)This indicator provides a clean, single-view envelope combining the Bollinger Bands (BB) and Keltner Channels (KC) directly onto your price chart. It is an essential tool for traders operating with Volatility Compression (The Squeeze) and Mean Reversion strategies in fast-moving markets like Futures, High BTC Beta Equities, and Crypto. The goal of this tool is twofold: to visually frame the market's current volatility state and to identify high-probability entry points based on expansion or extreme contraction. How to Use the BBKC Overlay: Spotting the Squeeze (Accumulation Phase):The Squeeze is identified when the Bollinger Bands (BB) contract and fit inside the Keltner Channels (KC).The area is clearly marked with a subtle Orange Background Highlight on the main chart. This is the Accumulation phase, signaling low volatility before a potential large directional move. Trading Mean Reversion: When price pushes aggressively outside the outermost bands (the BB Upper/Lower), it signals an extreme volatility expansion and over-extension. This is a strong setup for mean reversion—a high-probability trade targeting a snap-back towards the central Basis Line (SMA).Customizing for Extreme Compression: For traders looking only for the tightest, highest-probability Squeezes, adjust the following setting: KC Multiplier (ATR): Lower this value from the default of 1.5 down to 1.25 or 1.0. This narrows the KC, forcing the Bollinger Bands to contract even further to trigger the Squeeze signal, thus filtering for only the most minimal volatility. Recommended Synergy: For a complete volatility system, pair this BBKC Combined Channels Overlay (your visualization tool) with the BBKC Squeeze Indicator (the sub-pane momentum histogram).Overlay (Main Chart): Shows where the Squeeze is occurring and identifies mean reversion targets. Squeeze Indicator (Lower Pane): Shows if the Squeeze is active and the directional momentum building up, helping you time the breakout entry for the Manipulation/Distribution phase.

Pro AI Trading - Month Week OpenThis is a indicator that primarily marks monthly 1 hour initial balances, while highlighting every yearly half/quarter. Additionally has 9 different types of MA bands + D/W/M vertical separators. Marks custom % pivot points for easier zone marking. Possibility of generating signals based on mid line candle crosses.
Multi-Exchange VWAP Aggregator (Crypto)Description:
This advanced VWAP indicator aggregates volume data from up to 9 cryptocurrency exchanges simultaneously, providing a more accurate volume-weighted average price than single-exchange VWAP calculations.
Key Features:
Multi-Exchange Aggregation - Combines volume from Binance, Coinbase, Bybit, Bitfinex, Bitstamp, Deribit, OKEx, Phemex, and FTX
Flexible Currency Pairs - Supports both spot (USD, USDT, EUR, USDC, BUSD, DAI) and perpetual futures contracts
Standard Deviation Bands - Includes customizable 1σ, 2σ, and 3σ bands for identifying overbought/oversold levels
Multiple Reset Periods - Daily, Weekly, Monthly, or Session-based VWAP calculations
Volume Calculation Options - Choose between SUM, AVG, MEDIAN, or VARIANCE for volume aggregation
Why Use This?
Traditional VWAP indicators only use volume from a single exchange, which can be misleading in fragmented crypto markets. This indicator provides a comprehensive market-wide VWAP by aggregating volume across major exchanges, giving you a more reliable benchmark for entries, exits, and institutional price levels.
Perfect for traders who want to see where the real volume-weighted price sits across the entire crypto market, not just one exchange.

Commodity Channel Index DualThe CCI Dual is a custom TradingView indicator built in Pine Script v5, designed to help traders identify potential buy and sell signals using two Commodity Channel Index (CCI) oscillators. It combines a shorter-period CCI (default: 14) for quick momentum detection with a longer-period CCI (default: 50) for confirmation, focusing on mean-reversion opportunities in overbought or oversold conditions.
This setup is particularly suited for volatile markets like cryptocurrencies on higher timeframes (e.g., 3-day charts), where it highlights reversals by requiring both CCIs to cross out of extreme zones within a short window (default: 3 bars).
The indicator plots the CCIs, customizable bands (inner: 100, OB/OS: 175, outer: 200), dynamic fills for visual emphasis, background highlights for signals, and alert conditions for notifications.
How It Works
The indicator calculates two CCIs based on user-defined lengths and source (default: close price):
CCI Calculation: CCI measures price deviation from its average, using the formula: CCI = (Typical Price - Simple Moving Average) / (0.015 * Mean Deviation). The short CCI reacts faster to price changes, while the long CCI provides smoother, trend-aware confirmation.
Overbought/Oversold Levels: Customizable thresholds define extremes (Overbought at +175, Oversold at -175 by default). Bands are plotted at inner (±100), mid (±175 dashed), and outer (±200) levels, with gray fills for the outer zones.
Dynamic Fills: The longer CCI is used to shade areas beyond OB/OS levels in red (overbought) or green (oversold) for quick visual cues.
Signals:
Buy Signal: Triggers when both CCIs cross above the Oversold level (-175) within the signal window (3 bars). This suggests a potential upward reversal from an oversold state.
Sell Signal: Triggers when both cross below the Overbought level (+175) within the window, indicating a possible downward reversal.
Visuals and Alerts: Buy signals highlight the background green, sells red. Separate alertconditions allow setting TradingView alerts for buys or sells independently.
Customization: Adjust lengths, levels, and window via inputs to fit your timeframe or asset—e.g., higher OB/OS for crypto volatility.
This logic reduces noise by requiring dual confirmation, but like all oscillators, it can produce false signals in strong trends where prices stay extended.
To mitigate false signals (e.g., in trending markets), layer the CCI Dual with MACD (default: 12,26,9) and RSI (default: 14) for multi-indicator confirmation:
With MACD: Only take CCI buys if the MACD line is above the signal line (or histogram positive), confirming bullish momentum. For sells, require MACD bearish crossover. This filters counter-trend signals by aligning with trend strength—e.g., ignore CCI sells if MACD shows upward momentum.
With RSI: Confirm CCI oversold buys only if RSI is below 30 and rising (or shows bullish divergence). For overbought sells, RSI above 70 and falling. This adds overextension validation, reducing whipsaws in crypto trends.
I made this customizable for you to find what works best for your asset you are trading. I trade the 6 hour and 3 day timeframe mainly on major cryptocurrency pairs. I hope you enjoy this script and it serves you well.

Reversal Radars — Berk v2.0 (Bottom & Top)1) Combined script (Dip+Tepe)
Title:
Reversal Radars — Berk v2.0 (Bottom & Top)
Description (EN):
What it does
Two high-probability reversal detectors in one indicator: a Bottom Reversal Radar (long bias) and a Top Reversal Radar (short/hedge bias). Each radar aggregates multiple conditions into a single score and triggers when Score ≥ Threshold.
How it works
RSI regime shift: Bottom = recovery after oversold (touched 30, crosses up 35). Top = roll-over from overbought (touched 70, crosses down 65).
MACD cross: Bull (up) for bottoms, Bear (down) for tops.
EMA8 filter: Close above (bottom) / below (top) EMA(8).
Structure break (BOS): Close above recent swing high / below recent swing low (lookbackBars, using precomputed highest/lowest to avoid inconsistencies).
EMA200 proximity: Price within a configurable band (default −5% … +2%).
Volume expansion: Volume ≥ SMA(20) × multiplier (default 1.5×).
Divergence: Pivot-confirmed (3/3) bullish (bottom) or bearish (top) RSI divergence.
Scoring: RSI shift +2, divergence +2, MACD +1, EMA8 +1, BOS +1, Volume +1, EMA200 band +1.
Signals & Alerts
Bottom: label “DÖNÜŞ↑” and alert “Dipten Dönüş — Ana Sinyal” when scoreLong ≥ thrLong.
Top: label “DÖNÜŞ↓” and alert “Tepeden Dönüş — Ana Sinyal” when scoreShort ≥ thrShort.
Use Once per bar close for stable alerts.
Inputs
lenRSI, rsiOS=30, rsiRecover=35, rsiOB=70, rsiFall=65, volLen=20, volMult=1.5, lookbackBars=5, ema200 band (−5…+2%), thrLong/thrShort, toggles for Bottom/Top.
Timeframes & tips
Best on Daily/4H. Tighten thresholds (e.g., 4) and raise volume multiplier (1.8–2.0×) on lower TFs or thin liquidity.
No-repaint note
Evaluated on bar close; pivot divergences confirm with a natural ~3-bar delay.
Disclaimer
Educational use only. Not financial advice.
Tags: reversal, divergence, rsi, macd, ema, volume, trend, screener, stocks, crypto, bist
2) Bottom-only (Dip)
Title:
Bottom Reversal Radar — Berk v1.4
Description (EN):
Purpose
Scores bottoming conditions and triggers when Score ≥ Threshold (default 3).
Components
RSI recovery after oversold (30→35), MACD bull cross, close above EMA8, BOS above recent swing high, near-EMA200 band (−5…+2%), volume ≥ SMA(20)×1.5, and pivot-confirmed (3/3) bullish RSI divergence. Weights: RSI +2, Divergence +2, others +1.
Usage
Add to chart, set alert “Dipten Dönüş — Ana Sinyal”, Once per bar close. Works on any timeframe (need ≥200 bars for EMA200). Daily/4H recommended.
No-repaint
Bar-close evaluation; divergence confirms with ~3 bars.
Tags: bottom, reversal, rsi, macd, ema, volume, divergence
3) Top-only (Tepe)
Title:
Top Reversal Radar — Berk v1.0
Description (EN):
Purpose
Detects topping risk and triggers when Score ≥ Threshold (default 3) for exits/hedges.
Components
RSI roll-over from overbought (70→65), MACD bear cross, close below EMA8, BOS below recent swing low, near-EMA200 band, volume ≥ SMA(20)×1.5, and pivot-confirmed (3/3) bearish RSI divergence. Weights: RSI +2, Divergence +2, others +1.
Usage
Add to chart, set alert “Tepeden Dönüş — Ana Sinyal”, Once per bar close. Daily/4H preferred; tighten thresholds on lower TFs.
No-repaint
Bar-close evaluation; divergence confirms with ~3 bars.
Tags: top, reversal, rsi, macd, ema, volume, divergence

BB next+2This indicator extends the standard Bollinger Bands by allowing you to project future Bollinger Bands based on assumed closing prices for the next trading day (+1) and the day after (+2).
Key Features:
Plots standard Bollinger Bands (supports SMA, EMA, etc.)
Allows manual input of assumed closing prices for the next trading day (+1) and the day after (+2)
Displays projected Bollinger Bands (basis, upper, and lower) based on the input values
Option to restrict display to the latest bar or confirmed bars only
BBMA OA - AI GPT-5This indicator is an AI-assisted implementation of the BBMA OA (Bollinger Bands + Moving Average) trading strategy, originally introduced by Malaysian trader Oma Ally. The code was generated and optimized using the GPT-5 AI model to ensure clean Pine Script v6 structure and compatibility.
The system combines Bollinger Bands (20, 2) with EMA50, EMA200, and MA5/10 High-Low to identify the four main BBMA OA patterns:
Extreme
Market Hilang Volume (MHV)
Candle Arah Kukuh (CSAK)
Re-entry (RRE, REE, REM)
Features:
Multi Time Frame confirmation for higher accuracy
Automatic signal detection with visual markers
Trend ribbon and candle coloring
Optimized Pine Script v6, free from errors/warnings
⚠ This is an adaptation of Oma Ally’s concept for educational purposes, not an official version. Past performance does not guarantee future results.