Bayesian Bias OscillatorWhat is a Bayes Estimator?
Bayesian estimation, or Bayesian inference, is a statistical method for estimating unknown parameters of a probability distribution based on observed data and prior knowledge about those parameters. At first , you will need a prior probability distribution, which is a prior belief about the distribution of the parameter that you are interested in estimating. This distribution represents your initial beliefs or knowledge about the parameter value before observing any data. Second , you need a likelihood function, which represents the probability of observing the data given different values of the parameter. This function quantifies how well different parameter values explain the observed data. Then , you will need a posterior probability distribution by combining the prior distribution and the likelihood function to obtain the posterior distribution of the parameter. The posterior distribution represents the updated belief about the parameter value after observing the data.
Bayesian Bias Oscillator
This tool calculates the Bayes bias of returns, which are directional probabilities that provide insight on the "trend" of the market or the directional bias of returns. It comes with two outputs: the default one, which is the Z-Score of the Bayes Bias, and the regular raw probability, which can be switched on in the settings of the indicator.
The Z-Score output value doesn't tell you the probability, but it does tell you how much of a standard deviation the value is from the mean. It uses both probabilities, the probability of a positive return and the probability of a negative return, which is just (1 - probability of a positive return).
The probability output value shows you the raw probability of a positive return vs. the probability of a negative return. The probability is the value of each line plotted (blue is the probability of a positive return, and purple is the probability of a negative return).
Search in scripts for "bias"
Scripting Tutorial 7 - Triple Many Moving Averages ResolutionsThis script is for a triple moving average indicator where the user can select from different types of moving averages, price sources, lookback periods and resolutions.
Features:
- 3 Moving Averages with variable MA types, periods, price sources, resolutions and the ability to disable each individually
- Crossovers are plotted on the chart with detailed information regarding the crossover (Ex: 50 SMA crossed over 200 SMA )
- Forecasting available for all three MAs. MA values are forecasted 5 values out and plotted as if a continuation to the MA.
- Forecast bias also applies to all forecasting. Bias means we can forecast based on an anticipated bullish, bearish or neutral direction in the market.
- To understand bias, please read the source code, or if you can't read the code just send me a message on here or Twitter. Twitter should be linked to my profile.
This script is meant as an educational script with well-formatted styling, and references for specific functions.
Scripting Tutorial 6 - Triple Many Moving Averages ForecastingThis script is for a triple moving average indicator where the user can select from different types of moving averages, price sources and lookback periods.
Features:
- 3 Moving Averages with variable MA types, periods, price sources and ability to disable each individually
- Crossovers are plotted on the chart with detailed information regarding the crossover (Ex: 50 SMA crossed over 200 SMA )
- Forecasting available for all three MAs. MA values are forecasted 5 values out and plotted as if a continuation to the MA.
- Forecast bias also applies to all forecasting. Bias means we can forecast based on an anticipated bullish, bearish or neutral direction in the market.
- To understand bias, please read the source code, or if you can't read the code just send me a message on here or Twitter. Twitter should be linked on my profile.
This script is meant as an educational script with well-formatted styling, and references for specific functions.

MTF Bias Alert SystemMulti-Time-Frame Bias Alert System
include HTF BIAS and any Time Frame Confluence

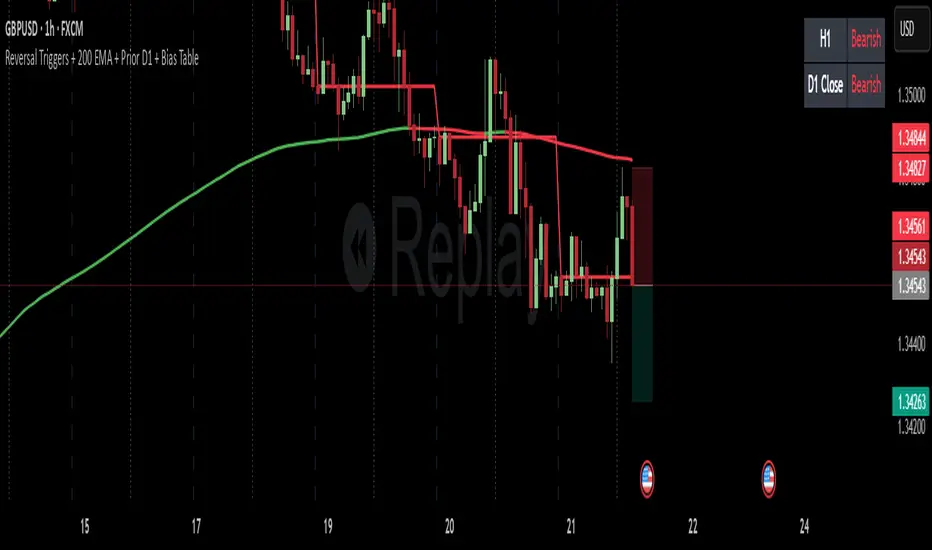
Reversal Triggers + 200 EMA + Prior D1 + Bias TableKeep it simple stupid.
D1 bias
H1 bias
H1 ORB (momentum)
OBVX Conviction Bias🧮 The OBVX Conviction Bias overlay tracks the flow of directional volume using the classic On-Balance Volume calculation, then filters it through a layered moving average system to expose crowd commitment , pressure transitions , and momentum fatigue . The tool applies two smoothed averages to the OBV line—a fast curve and a longer-term baseline scaled using Euler’s constant (2.718)—and visualizes their relationship using a color-coded crossover ribbon and pressure fills. When used correctly, it reveals whether a move is being supported by meaningful volume, or whether the crowd is starting to disengage.
🚦 The core signal compares OBV to its fast moving average. When OBV climbs above the short average, it fills green—suggesting real directional effort. When OBV sinks below, the fill turns maroon—flagging fading conviction or pullback potential. A second fill between the short and long OBV moving averages captures the broader trend of volume intention. If the short is above the long, this space fills greenish, showing constructive pressure. If it flips, the fill fades red, signaling crowd hesitation, rotation, or early exhaustion.
⚖️ All smoothing is user-selectable, defaulting to VWMA for effort-sensitive structure. The long-term average is auto-scaled using the natural exponential multiplier (2.718), offering rhythm that reflects the curve of participation. OBVX Conviction Bias isn’t trying to predict—it’s trying to show you where the crowd is leaning , and whether that lean is gaining traction or losing strength.
🧐 Ideal Use-Cases:
• Detect divergence between volume flow and price action
• Confirm breakout validity with volume alignment
• Fade breakouts where OBV fails to follow through
• Time pullback entries when OBV pressure resumes in trend direction
🍷 Recommended Pairings:
• ZVOL to measure whether volume is statistically significant or just noise (as shown)
• RVOL Effort Matrix to validate crowd effort by tier and structure zone
• SUPeR TReND 2.718 and/or MA Ribbons for directional confluence
• ATR Turbulence to track volatility-phase alignment with volume intention

Candle Analysis BiasDescription:
The "Candle Analysis Bias" indicator is designed to provide visual cues on the direction of price movements by labeling candles as either "Bullish" or "Bearish" based on specific criteria. This indicator helps traders quickly identify shifts in momentum and potential trend reversals.
Features:
Directional Labels: Candles are labeled "Bullish" if the closing price exceeds the previous candle's high, indicating potential upward momentum. Conversely, candles are labeled "Bearish" if the closing price falls below the previous candle's low, suggesting potential downward pressure.
Customizable Appearance: Users can customize the color of the labels through the indicator settings. The default colors are green for bullish labels and red for bearish labels, with a 50% opacity to ensure they are visually distinct yet not overly intrusive.
Label Offset: An offset can be applied to the labels to position them slightly away from the candles, enhancing readability. The default offset is set to 10 times the minimum price tick of the symbol.
Exclusion of Current Candle: The indicator does not label the current, open candle until it is confirmed. This ensures that labels are only applied to completed candles, avoiding premature signals.
Usage:
Trend Identification: Use the "Bullish" and "Bearish" labels to identify potential trend changes or continuations.
Confirmation Tool: Combine the labels with other indicators or analysis techniques to confirm trading signals.
Visual Analysis: Quickly scan the chart for clusters of "Bullish" or "Bearish" labels to gauge overall market sentiment.
Settings:
Bullish Color: Customize the color of the "Bullish" labels.
Bearish Color: Customize the color of the "Bearish" labels.
Label Offset: Adjust the distance between the labels and the candles.
Installation:
To install this indicator, copy the Pine Script code provided and paste it into the Pine Editor in TradingView. Click "Add to Chart" to apply the indicator to your selected chart.
This detailed description should help users understand the purpose and functionality of the "Candle Analysis Bias" indicator, making it easier for them to incorporate it into their trading strategies.

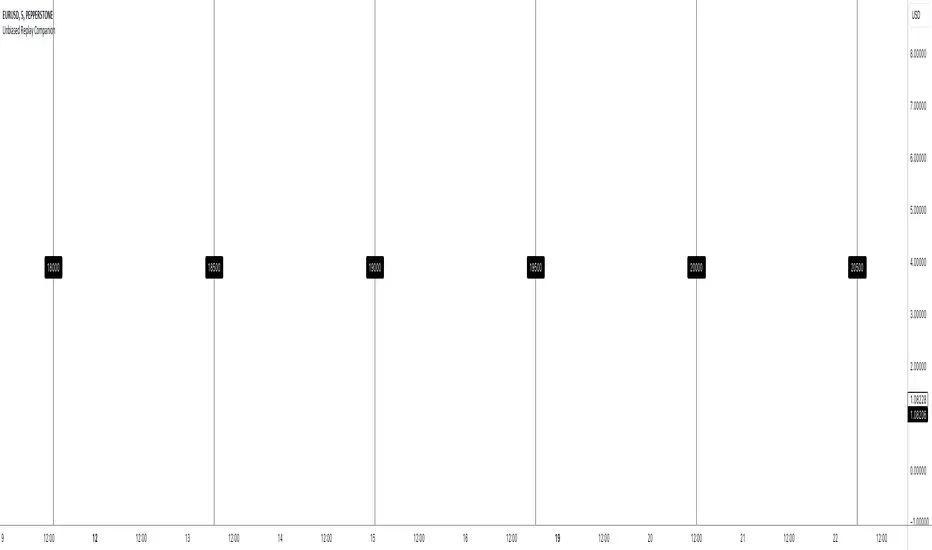
Unbiased Replay CompanionWhen using bar replay mode on TradingView, you have to scroll your way back through clearly visible price history, which always leaves you with unwanted lookahead bias because you unfortunately see all future price movements before they are hidden by the use of the scissors tool.
This indicator provides a simple way to hide all the price action and displays a configurable bar counter instead, allowing you to scroll back to every moment in history without seeing any of the prices' movements. The bar counter hereby serves as a visual aid to guide you back to the very first available bar on the chart.
You can configure the color of the overlay to match your charts' background as well as the style of the bar counter and the distance at which the counter is being displayed.
The indicator crops the vertical price scale by a random amount (only when it is being displayed) to also prevent you from having any unwanted bias based on the current price range.
Whenever you're done scrolling and have used the replay scissors tool to start your session just hide the indicator and bring it up again when you need to scroll. That's all there is to it.
Important: After you apply the indicator to your charts, make sure it is displayed in front of everything else. You can configure this by clicking on the three dots that are displayed on the right side of the indicator name on hover and choose "Visual order > Bring to front" from the popup menu that appears.
Enjoy your unbiased backtesting sessions!
Directional BiasA Directional Bias to stop me trading against the trend
Utilising EMA'S - I personally view on the 15M TF but it can be set on any
40/50/60 15Minute STF
and 13/35/50 - 30M 1H and 4H HTF
Mixing them together in direction and location to each other Gives a 6 colour system for keeping away from trading against trend
Dark Red Both Align - Sells Only do not take Buy Trades
Medium Red HTF and Dark Red Mix - Sells Only do not take Buy Trades
Light Red STF - if in a mix with Blanks and greens - Trade Both Directions - if 8 hours of solid Light Red ? Darker Red - do not take Buy Trades - Sells Only
Orange - Trading Both ways - No Directional Bias
Dark Green Both Align - Buys Only do not take Sell Trades
Medium Green HTF and Dark Green Mix - Buys Only do not take Sell Trades
Light Red STF - if in a mix with Blanks and greens - Trade Both Directions - if 8 hours of solid Light Green ? Darker Green - do not take Sell Trades - Buys Only
Alert Setting for Change of Direction included
I find this useful - to at least give me a pause for thought when I am about to trade against the trend - I hope you do to

Fair Value Gap / FVG - HTF Orderflow bias / trendCalculates Fair Value Gap (FVG) as a counter and plots it below price.
FVG Counter value resets to +ve or -ve once the FVG counter reverses direction.
Use this script to find a bias to trade with.
Best used on HTF (like 1W, 1D), so the bias can be transferred to LTF (like 4H, 1H).
If you end up using this script, please leave a comment below on how you used it. I can try to incorporate those ideas in an update.
Cheers!

Zahorchak MeasureCreator: Michael G. Zahorchak.
References:
The Art of Low Risk Investing by Michael G. Zahorchak, 1977. Unfortunately, it's all but impossible to find a copy these days.
The Complete Guide to Market Breadth Indicators by Gregory L. Morris, 2006. A fantastic resource for those interested in Technical Analysis or creating their own trend based system.
Two articles by Greg Morris on the Zahorchak Measure. I can't link to them under the House Rules, but they are easily searchable.
The Zahorchak Measure (ZM) is designed to give you a market bias (either uptrend or downtrend) which you can use to determine a trade bias for ETF's or stocks.
ZM works by taking multiple moving averages of the NYSE Composite, a moving average of the NYSE advance decline line, and examining the relationship between those elements. Broadly, the market is considered to be in a uptrend when ZM is above zero, and a downtrend when below. However, there are many ways to interpret the indicator.
The version created by Greg Morris is more akin to a binary indicator in that ZM jumps from number to number. This version is smoothed to create an oscillator as it reduces whipsaws (at the expense of lag). You can set the EMA Length to 1 to go back to the original.
Some notes:
Michael Zahorchak called it the "Zahorchak Method", whereas Greg Morris uses the term "Measure". I'm not totally clear on the change, but Mr. Morris made some changes (covered below), so that may explain the altered name.
The original indicator used moving averages of 5, 15, and 40 weeks. I have converted these to daily numbers as that's the time frame I most commonly trade. You can convert the numbers back by dividing by 5.
The original indicator used the Dow Industrials for the moving averages, however Greg Morris switched to the NYSE Composite due to the advance decline line being based on the NYSE.
Greg Morris removed the 5 period moving average of the NYSE Composite, as it created increased volatility at market tops and bottoms. I tested ZM with the 5 period MA added back in, and I believe removing it creates a superior indicator.
I've added both Multi Time Frame functionality, and the ability to alter moving average lengths. Play around and see what you can come up with.
ZM oscillates between -10 and +10. There are some interesting levels creating between these two numbers (apart from the obvious zero level) - see what you can come up with.
All credit goes to Michael Zahorchak and Greg Morris for the indicator creation. I have simply reproduced their work for the TradingView community as this great indicator wasn't available.
Any queries let me know in the comments or PM me.
DD.

NQ 300+ Point Day Checklist (Bias + Alerts + Markers)This indicator helps identify high-range (≥300-point) days on Nasdaq-100 futures (NQ / MNQ) using a clear, rule-based checklist.
It evaluates volatility, compression, price displacement, prior-day structure, and overnight activity to generate a daily expansion score (0–6). Higher scores signal an increased likelihood of a strong trending or expansion day.
The script also provides:
Expansion probability levels (Normal / Watch / High-Prob)
Bullish, bearish, or neutral bias
On-chart markers and background highlights
Optional alerts for early awareness
Best used on the Daily timeframe to help traders focus on high-opportunity days and avoid overtrading during consolidation.
This is a context and probability tool — not a trade signal.

Volume Anomaly AVWAP BiasThis indicator detects volume anomaly candles and tracks their anchored VWAPs. It measures the percentage of following candles that close on the favored side of each anomaly's VWAP and only continues to track anomalies with strong directional bias until broken.

BTC LL->HH Liquidity Sweep / BOS / Retest / 4H Bias v6_8BTC LL->HH Liquidity Sweep / BOS / Retest / 4H Bias v6_8

Higher Timeframe Bias and DOLAn indicator which looks at the most recent FVG and, assuming it's been respected, provides a bias flag on the 1H, 4H and Daily levels.

Zero Lag + Momentum Bias StrategyZero Lag + Momentum Bias Strategy (MTF + Strong MBI + R:R + Partial TP + Alerts)

MACROFLOW 200 — Bias & Triggersstephtradez model
MACROFLOW 200 — at a glance (the elevator pitch)
Trade direction = Macro Bias + 1H 200 EMA filter + DXY confirm.
Locations = 1H supply/demand zones.
Triggers (15m): (T1) Retest rejection, (T2) Liquidity sweep + BOS/CHOCH, (T3) Momentum break + shallow pullback.
Stops: structure‑based beyond zone with ATR buffer.
Targets: 2R base, scale at 1.5R, trail to next HTF zone.
Sessions: 7–10 pm ET and 9:30–10:30 am ET.
Risk: tight, prop‑friendly max 1% per session

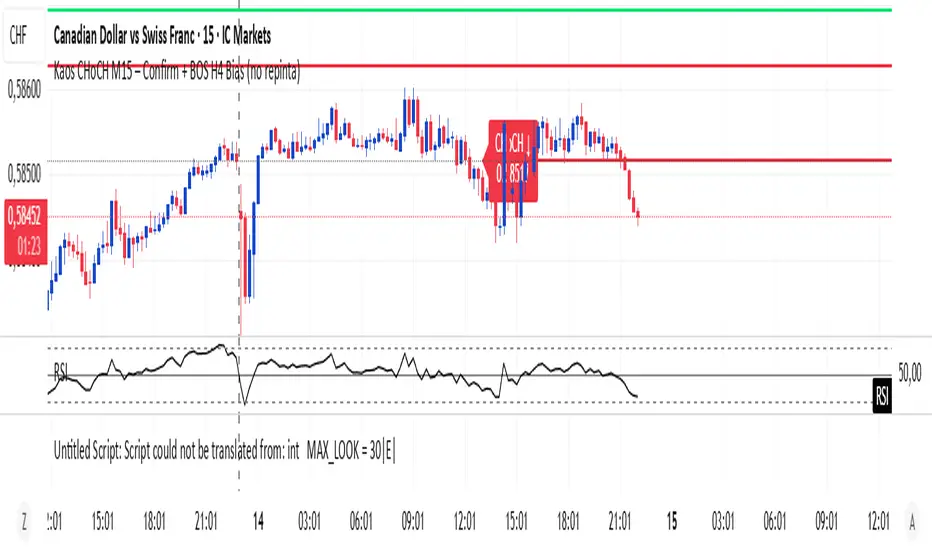
Kaos CHoCH M15 – Confirm + BOS H4 Bias (no repinta)Marca choch en dirección del Bias de H4 para seguir con la tendencia.
Engulfing Sweeps - Milana TradesEngulfing Sweeps
The Engulfing Sweeps Candle is a candlestick pattern that:
1)Takes liquidity from the previous candle’s high or low.
2)Fully engulfs previous candles upon closing.
3)Indicates strong buying or selling pressure.
4)Helps determine the bias of the next candle.
Logic Behind Engulfing Sweeps
If you analyze this candle on a lower timeframe, you’ll often see popular models like PO3 (Power of Three) or AMD (Accumulation – Manipulation – Distribution).
Once the candle closes, the goal is to enter a position on the retracement of the distribution phase.
How to Use Engulfing Sweeps?
Recommended Timeframes:
4H, Daily, Weekly – these levels hold significant liquidity.
Personally, I prefer 4H, as it provides a solid view of mid-term market moves.
Step1 - Identify Engulfing Sweep Candle
Step 2-Switch to a lower timeframe (15m or 5m).And you task identify optimal trade entry
Look for an entry pattern based on:
FVG (Fair Value Gap)
OB (Order Block)
FIB levels (0/0.25/0.5/ 0.75/ 1)
Wait for confirmation and take the trade.
Automating with TradingView Alerts
To avoid missing the pattern, you can set up alerts using a custom script. Once the pattern forms, TradingView will notify you so you can analyze the chart and take action. This approch helps me be more freedom

Daily Directional Bias Indicator (S&P 500)This indicator is designed to help you be on the right side of the trade.
Most traders who struggle to know which way price may move are only looking at part of the picture. This Directional Bias Indicator uses both the Accumulation/Distribution Line and VIX for directional confirmation.
The Accumulation/Distribution Line
The Accumulation/Distribution (ACC) line helps us gauge market momentum by showing the cumulative flow of money into or out of an asset. When the ACC line is rising, it suggests that buying pressure is dominating, indicating a bullish market. Conversely, when the ACC line is falling, it suggests that selling pressure is stronger, indicating a bearish market. By comparing the ACC line with the VWAP, traders can see if the price is moving in line with the overall market sentiment. If the ACC line is above the VWAP, it suggests the market is in a bullish phase; if it's below, it indicates a bearish phase.
The VIX
The VIX (Volatility Index) is often referred to as the "fear gauge" of the market. When the VIX is rising, it typically signals increased market fear and higher volatility, which can be a sign of bearish market conditions. Conversely, when the VIX is falling, it suggests lower volatility and a more stable, bullish market. Using the VIX with the VWAP helps us confirm market direction, particularly in relation to the S&P 500.
VWAP
For both the ACC Line and VIX, we use a VWAP line to gauge whether the ACC line or the VIX is above or below the average. When the ACC line is above the VWAP, we view it as a sign that price will go up. However, because the VIX has an inverse relationship, when the VIX falls below the VWAP, we take that as a sign to go long.
How to use
The yellow line represents the ACC Line.
The red line represents the VWAP based on the ACC line.
The triangles at the bottom simply show when the ACC line is above or below the VWAP.
The triangles at the top show whether the VIX is bullish or bearish.
If both triangles (top or bottom) are bullish, this confirms that the price of an asset like the S&P 500 will likely go up. If both triangles are pointing down, it suggests that price will fall.
As always, test for yourself.
Happy trading!

DB369 - Directional Bias 369
DB369 - Directional Bias 369 Indicator
The **DB369** indicator helps traders identify key market levels and trends by combining multiple timeframes' price action analysis. It highlights important **pivot points** on the chart and provides visual cues to help you make more informed buy and sell decisions based on the overall market direction.
Key Features
1. Pivot Points Across Multiple Timeframes**:
- The indicator calculates and displays pivot points for the **Monthly**, **Weekly**, **Daily**, **4-Hour**, and **1-Hour** timeframes (or 30-minute equivalent if desired). These pivots represent significant price levels where the market may retest.
2. **Trend Detection**:
- The indicator evaluates the relationship between the current price and the pivot point for each timeframe. Based on this comparison, it classifies the market as **Bullish**, **Bearish**, or **Neutral** on each timeframe.
3. **Pivot Lines**:
- Horizontal lines are drawn to mark the key pivot points for each selected timeframe. These lines extend into the future and adjust dynamically as the market moves in real time.
- **Customizable**: You can choose which timeframes to display pivot points by enabling/disabling them in the settings.
4. **Trend Table**:
- A **table** is displayed at the top-right of the chart to show the trend for the **Daily**, **4-Hour**, and **30-Minute** timeframes. It provides an easy-to-read view of the trend direction across these timeframes.
5. **Buy/Sell Arrows**:
- **Buy Arrow**: A green arrow will appear when the **Daily**, **4-Hour**, and **30-Minute** trends are all **Bullish** (aligned in the same direction).
- **Sell Arrow**: A red arrow will appear when all three timeframes show a **Bearish** trend.
- These arrows appear only once per alignment change and can be enabled or disabled for alerts. This helps avoid clutter on the chart and ensures that you only see a signal when the alignment occurs or changes.
### **How to Use the DB369 Indicator**:
1. **Pivot Points**:
- The pivot points represent significant price levels where the market might retest in the future. For instance:
- **Bullish Market**: If the price is above the pivot point, the market is considered bullish.
- **Bearish Market**: If the price is below the pivot point, the market is considered bearish.
- **Neutral Market**: When the price is near the pivot point, the market is neither strongly bullish nor bearish.
2. **Trend Alignment**:
- When the **Daily**, **4-Hour**, and **30-Minute** timeframes all show the same trend direction (either **Bullish** or **Bearish**), this alignment signifies a stronger trend.
- You will receive a **Buy Arrow** when all three timeframes are aligned bullish, and a **Sell Arrow** when they are aligned bearish.
- These arrows are displayed at the point when the alignment is first detected and can also trigger **alerts**.
3. **Alerts**:
- You can choose to enable alerts for when a **Buy** or **Sell** arrow appears on the chart. This allows you to be notified in real-time when the alignment conditions are met.
4. **Using the Pivot Points for Entry**:
- **Buy Trade**: Look for a buy trade when the price is near the **pivot line** of the higher timeframes, particularly when the trend across all three timeframes is **Bullish**.
- **Sell Trade**: Similarly, look for a sell trade when the price is near a **pivot line** and the trend is **Bearish**.
5. **Customization**:
- You can customize which timeframes' pivots are shown on the chart by toggling the visibility of the **Monthly**, **Weekly**, **Daily**, **4-Hour**, and **1-Hour** pivots in the settings.
- The indicator automatically adjusts the pivot levels in real-time as the market progresses.
**Important Notes**:
- This indicator does not guarantee successful trades; it is intended to assist in identifying potential trade opportunities based on the alignment of higher timeframe trends.
- Always combine the information from the DB369 indicator with other technical analysis tools and risk management strategies to ensure more accurate trade decisions.

Weekly BiasWeekly Bias
For H1 time frame and below.
Horizontal Line Plots every week.
Condition for line is 12am EST on Monday.
Price above, line is green~ potential bullishness.
Price below, line is red~ potential bearishness.
This line gives us potential sentiment for any given week on any given forex market.
If you have any questions, or want access to other indicators, please message me.

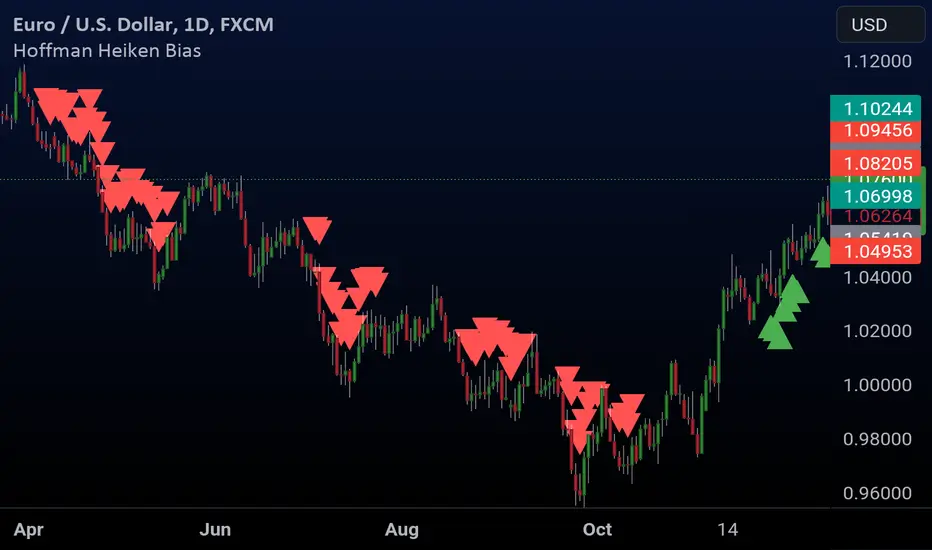
Hoffman Heiken BiasThis indicator uses a couple of different things including the Hoffman moving averages applied with heiken ashi bar data and some volatility to help determine when the bias of the market has shifted for the timeframe you are looking at.