Om Boy CandlesUsed by me to play binary option. A little project to help my nephew decide which candle to refer to make SNR linesPine Script® indicatorby DeniesKresnaUpdated 2285
pandas_taLibrary "pandas_ta" Level: 3 Background Today is the first day of 2022 and happy new year every tradingviewers! May health and wealth go along with you all the time. I use this chance to publish my 1st PINE v5 lib : pandas_ta This is not a piece of cake like thing, which cost me a lot of time and efforts to build this lib. Beyond 300 versions of this script was iterated in draft. Function Library "pandas_ta" PINE v5 Counterpart of Pandas TA - A Technical Analysis Library in Python 3 at github.com The Original Pandas Technical Analysis (Pandas TA) is an easy to use library that leverages the Pandas package with more than 130 Indicators and Utility functions and more than 60 TA Lib Candlestick Patterns. I realized most of indicators except Candlestick Patterns because tradingview built-in Candlestick Patterns are even more powerful! I use this to verify pandas_ta python version indicators for myself, but I realize that maybe many may need similar lib for pine v5 as well. Function Brief Descriptions (Pls find details in script comments) bton --> Binary to number wcp --> Weighted Closing Price (WCP) counter --> Condition counter xbt --> Between ebsw --> Even Better SineWave (EBSW) ao --> Awesome Oscillator (AO) apo --> Absolute Price Oscillator (APO) xrf --> Dynamic shifted values bias --> Bias (BIAS) bop --> Balance of Power (BOP) brar --> BRAR (BRAR) cci --> Commodity Channel Index (CCI) cfo --> Chande Forcast Oscillator (CFO) cg --> Center of Gravity (CG) cmo --> Chande Momentum Oscillator (CMO) coppock --> Coppock Curve (COPC) cti --> Correlation Trend Indicator (CTI) dmi --> Directional Movement Index(DMI) er --> Efficiency Ratio (ER) eri --> Elder Ray Index (ERI) fisher --> Fisher Transform (FISHT) inertia --> Inertia (INERTIA) kdj --> KDJ (KDJ) kst --> 'Know Sure Thing' (KST) macd --> Moving Average Convergence Divergence (MACD) mom --> Momentum (MOM) pgo --> Pretty Good Oscillator (PGO) ppo --> Percentage Price Oscillator (PPO) psl --> Psychological Line (PSL) pvo --> Percentage Volume Oscillator (PVO) qqe --> Quantitative Qualitative Estimation (QQE) roc --> Rate of Change (ROC) rsi --> Relative Strength Index (RSI) rsx --> Relative Strength Xtra (rsx) rvgi --> Relative Vigor Index (RVGI) slope --> Slope smi --> SMI Ergodic Indicator (SMI) sqz* --> Squeeze (SQZ) * NOTE: code sufferred from very strange error, code was commented. sqz_pro --> Squeeze PRO(SQZPRO) xfl --> Condition filter stc --> Schaff Trend Cycle (STC) stoch --> Stochastic (STOCH) stochrsi --> Stochastic RSI (STOCH RSI) trix --> Trix (TRIX) tsi --> True Strength Index (TSI) uo --> Ultimate Oscillator (UO) willr --> William's Percent R (WILLR) alma --> Arnaud Legoux Moving Average (ALMA) xll --> Dynamic rolling lowest values dema --> Double Exponential Moving Average (DEMA) ema --> Exponential Moving Average (EMA) fwma --> Fibonacci's Weighted Moving Average (FWMA) hilo --> Gann HiLo Activator(HiLo) hma --> Hull Moving Average (HMA) hwma --> HWMA (Holt-Winter Moving Average) ichimoku --> Ichimoku Kinkō Hyō (ichimoku) jma --> Jurik Moving Average Average (JMA) kama --> Kaufman's Adaptive Moving Average (KAMA) linreg --> Linear Regression Moving Average (linreg) mgcd --> McGinley Dynamic Indicator rma --> wildeR's Moving Average (RMA) sinwma --> Sine Weighted Moving Average (SWMA) ssf --> Ehler's Super Smoother Filter (SSF) © 2013 supertrend --> Supertrend (supertrend) xsa --> X simple moving average swma --> Symmetric Weighted Moving Average (SWMA) t3 --> Tim Tillson's T3 Moving Average (T3) tema --> Triple Exponential Moving Average (TEMA) trima --> Triangular Moving Average (TRIMA) vidya --> Variable Index Dynamic Average (VIDYA) vwap --> Volume Weighted Average Price (VWAP) vwma --> Volume Weighted Moving Average (VWMA) wma --> Weighted Moving Average (WMA) zlma --> Zero Lag Moving Average (ZLMA) entropy --> Entropy (ENTP) kurtosis --> Rolling Kurtosis skew --> Rolling Skew xev --> Condition all zscore --> Rolling Z Score adx --> Average Directional Movement (ADX) aroon --> Aroon & Aroon Oscillator (AROON) chop --> Choppiness Index (CHOP) xex --> Condition any cksp --> Chande Kroll Stop (CKSP) dpo --> Detrend Price Oscillator (DPO) long_run --> Long Run psar --> Parabolic Stop and Reverse (psar) short_run --> Short Run vhf --> Vertical Horizontal Filter (VHF) vortex --> Vortex accbands --> Acceleration Bands (ACCBANDS) atr --> Average True Range (ATR) bbands --> Bollinger Bands (BBANDS) donchian --> Donchian Channels (DC) kc --> Keltner Channels (KC) massi --> Mass Index (MASSI) natr --> Normalized Average True Range (NATR) pdist --> Price Distance (PDIST) rvi --> Relative Volatility Index (RVI) thermo --> Elders Thermometer (THERMO) ui --> Ulcer Index (UI) ad --> Accumulation/Distribution (AD) cmf --> Chaikin Money Flow (CMF) efi --> Elder's Force Index (EFI) ecm --> Ease of Movement (EOM) kvo --> Klinger Volume Oscillator (KVO) mfi --> Money Flow Index (MFI) nvi --> Negative Volume Index (NVI) obv --> On Balance Volume (OBV) pvi --> Positive Volume Index (PVI) dvdi --> Dual Volume Divergence Index (DVDI) xhh --> Dynamic rolling highest values pvt --> Price-Volume Trend (PVT) Remarks I also incorporated func descriptions and func test script in commented mode, you can test the functino with the embedded test script and modify them as you wish. This is a Level 3 free and open source indicator library. Feedbacks are appreciated. This is not the end of pandas_ta lib publication, but it is start point with pine v5 lib function and I will add more and more funcs into this lib for my own indicators. Function Name List: bton() wcp() count() xbt() ebsw() ao() apo() xrf() bias() bop() brar() cci() cfo() cg() cmo() coppock() cti() dmi() er() eri() fisher() inertia() kdj() kst() macd() mom() pgo() ppo() psl() pvo() qqe() roc() rsi() rsx() rvgi() slope() smi() sqz_pro() xfl() stc() stoch() stochrsi() trix() tsi() uo() willr() alma() wcx() xll() dema() ema() fwma() hilo() hma() hwma() ichimoku() jma() kama() linreg() mgcd() rma() sinwma() ssf() supertrend() xsa() swma() t3() tema() trima() vidya() vwap() vwma() wma() zlma() entropy() kurtosis() skew() xev() zscore() adx() aroon() chop() xex() cksp() dpo() long_run() psar() short_run() vhf() vortex() accbands() atr() bbands() donchian() kc() massi() natr() pdist() rvi() thermo() ui() ad() cmf() efi() ecm() kvo() mfi() nvi() obv() pvi() dvdi() xhh() pvt() Pine Script® libraryby blackcat1402Updated 2020175
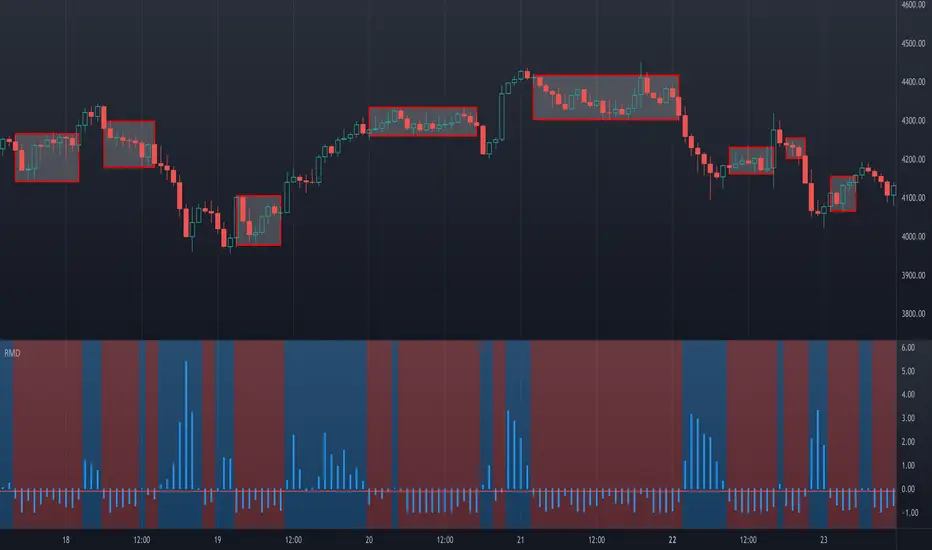
Ranging Market Detector [AstrideUnicorn]Determining if the market is in a trend or a range regime is a very complex problem. And knowing the answer can be, in some situations, the real holy grail. If the trader knows when the market is in a range regime, they can avoid overtrading and make moving average crossover strategies more profitable. A regime switch from a trend to a range can be a signal to close open positions. It can also be helpful when trading such instruments as short-term binary options. When the market is ranging directional moves are not expected, and the trader should be careful as opening a position in such conditions is, by some degree, a random outcome game. Range breakouts trading is one more example when knowing the market regime is critical. We have created an indicator that predicts the current market regime. It smooths the price using the Kalman filter and analyzes the curve's slope. If the absolute value of the slope is low, then the market is in range mode and vice versa. To distinguish between the two regimes, the algorithm compares the absolute value of the slope with its long-term average. HOW TO USE The indicator shows the difference between the absolute slope value and its long-term average as a histogram. When a bar of the histogram is higher than the threshold level presented by the red line, the market is in a trending regime. In this regime, the background of the indicator is blue. When the market is in a range regime, the indicator background turns red. The threshold level helps to control the lag. The greater it is, the more lagging the indicator will be. By default, this value is set to a negative value. It means that the indicator switches from range to trend a little bit earlier than the slope gets higher than the average slope. You can use the value of zero or low negative values to find the optimal tradeoff between the strength of the signals and their lag. SETTINGS The indicator has one input parameter called Threshold. It sets the threshold level described above. Its value should be close to zero. The less the value is, the less is the indicator's lag, but at the same time, the less confirmed the regime-switching signals are. The use cases can be very different. And as the code is open, you can also use the indicator as a building block for your custom trading strategies. Let us know your thoughts and suggestions! Pine Script® indicatorby AstrideUnicorn1414 1.2 K
Multi-TimeFrame SignalsI trade binary options on reversals. I use this as a confluence to prove that my analysis is correct. I use this on smaller time frames given the type of trading I do. I do not use this as an entry trigger, so you should not blindly enter trades based on this solely . You were warned This indicator (on default settings) will let you know when the 1 minute, 3 minute, and 5 minute timeframes RSI & Stochastics are all in an overbought or oversold state. It shows this by changing the background color on your chart to red (overbought) or green (oversold). All of these settings are changeable. #winning I left this as open-source as I figured out how to code this by using other open-source scripts as reference. I am a programmer that uses other languages. I only published this script as a request from a close friend.Pine Script® indicatorby ClammyB2243
Financial Astrology Indexes ML Daily TrendDaily trend indicator based on financial astrology cycles detected with advanced machine learning techniques for some of the most important market indexes: DJI, UK100, SPX, IBC, IXIC, NI225, BANKNIFTY, NIFTY and GLD fund (not index) for Gold predictions. The daily price trend is forecasted through planets cycles (angular aspects, speed phases, declination zone), fast cycles are based on Moon, Mercury, Venus and Sun and Mid term cycles are based on Mars, Vesta and Ceres . The combination of all this cycles produce a daily price trend prediction that is encoded into a PineScript array using binary format "0 or 1" that represent sell and buy signals respectively. The indicator provides signals since 2021-01-01 to 2022-12-31, the past months signals purpose is to support backtesting of the indicator combined with other technical indicator entries like MAs, RSI or Stochastic . For future predictions besides 2022 a machine learning models re-train phase will be required. When the signal moving average is increasing from 0 to 1 indicates an increase of buy force, when is decreasing from 1 to 0 indicates an increase in sell force, finally, when is sideways around the 0.4-0.6 area predicts a period of buy/sell forces equilibrium, traders indecision which result in a price congestion within a narrow price range. We also have published same indicator for Crypto-Currencies research portfolio: DISCLAIMER: This indicator is experimental and don’t provide financial or investment advice, the main purpose is to demonstrate the predictive power of financial astrology. Any allocation of funds following the documented machine learning model prediction is a high-risk endeavour and it’s the users responsibility to practice healthy risk management according to your situation.Pine Script® indicatorby citlacom55266
Financial Astrology Crypto ML Daily TrendThis daily trend indicator is based on financial astrology cycles detected with advanced machine learning techniques for the crypto-currencies research portfolio: ADA, BAT, BNB, BTC, DASH, EOS, ETC, ETH, LINK, LTC, XLM, XMR, XRP, ZEC and ZRX. The daily price trend is forecasted through this planets cycles (angular aspects, speed, declination), fast ones are based on Moon, Mercury, Venus and Sun and Mid term cycles are based on Mars, Vesta and Ceres. The combination of all this cycles produce a daily price trend prediction that is encoded into a PineScript array using binary format "0 or 1" that represent sell and buy signals respectively. The indicator provides signals since 2021-01-01 to 2022-12-31, the past months signals purpose is to support backtesting of the indicator combined with other technical indicator entries like MAs, RSI or Stochastic. For future predictions besides 2022 a machine learning models re-train phase will be required. The resolution of this indicator is 1D, you can tune a parameter where you can determine how many future bars of daily trend are plotted and adjust an hours shift to anticipate future signals into current bar in order to produce a leading indicator effect to anticipate the trend changes with some hours of anticipation. Combined with technical analysis indicators this daily trend is very powerful because can help to produce approximately 60% of profitable signals based on the backtesting results. You can look at our open source Github repositories to validate accuracy using the backtesting strategies we have implemented in Jesse Crypto Trading Framework as proof of concept of the predictive potential of this indicator. Alternatively, we have implemented a PineScript strategy that use this indicator, just consider that we are pending to do signals update to the period July 2021 to December 2022: This strategy have accumulated more than 110 likes and many traders have validated the predictive power of Financial Astrology. DISCLAIMER: This indicator is experimental and don’t provide financial or investment advice, the main purpose is to demonstrate the predictive power of financial astrology. Any allocation of funds following the documented machine learning model prediction is a high-risk endeavour and it’s the users responsibility to practice healthy risk management according to your situation.Pine Script® indicatorby citlacomUpdated 1313462
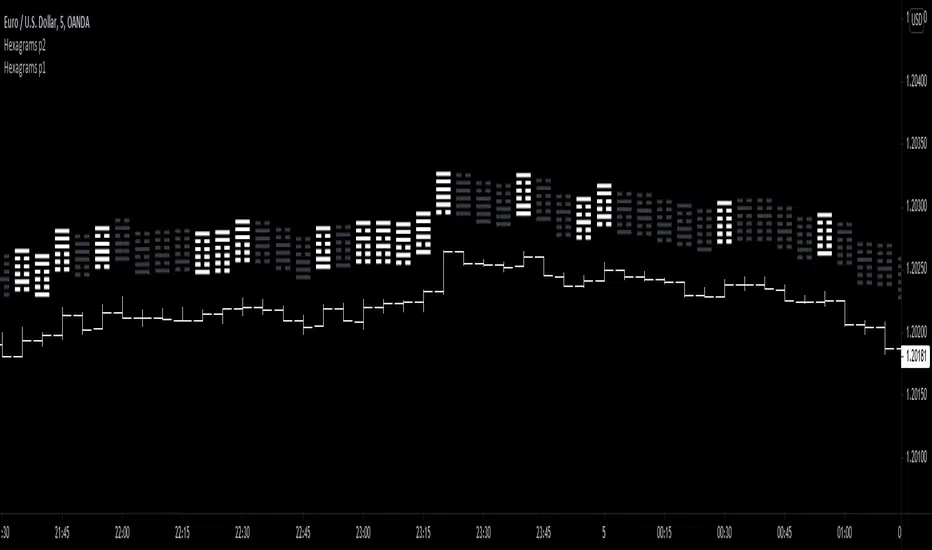
I Ching Hexagrams Part 2IMPORTANT! Get the other indicator I Ching Hexagrams Part 1 for the full set! Here is the first half of the I Ching's hexagrams. Each candle generates a hexagram at close, based on that candle and the previous 5. A green candle is yang and a red candle is yin. In this way, price action generates a hexagram. Use this to generate a hexagram for the day or even to find interesting patterns to trade. Have fun!Pine Script® indicatorby Has-no-Name1169
I Ching Hexagrams Part 1IMPORTANT! Get the other indicator I Ching Hexagrams Part 2 for the full set! Here is the first half of the I Ching's hexagrams. Each candle generates a hexagram at close, based on that candle and the previous 5. A green candle is yang and a red candle is yin. In this way, price action generates a hexagram. Use this to generate a hexagram for the day or even to find interesting patterns to trade. Have fun! Pine Script® indicatorby Has-no-Name4446
Technical Ratings Pro - Pump WaveThis script uses the built in Technical Ratings indicator but interprets the data visually. It plots the results for "total", "MA" and "other" as pump waves. It uses MA to plot a trend line (can be turned off in settings) . Candles are colored to the rating strength and a percentage number was added to the results. For more informations on the Technical Ratings indicator please refer to official documentation.Pine Script® indicatorby veryfidUpdated 1818 1.1 K
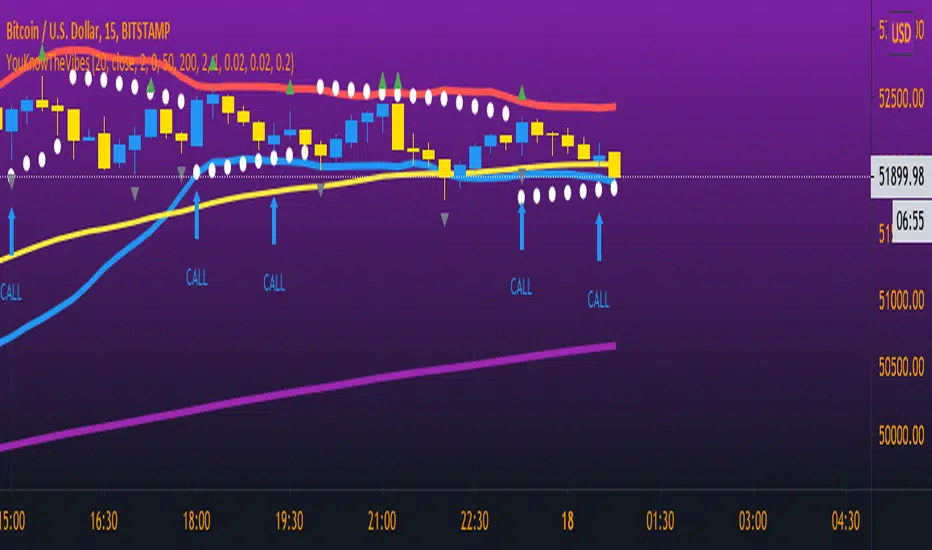
YouKnowTheVibesThis is mainly used for trading binary options but can be used for regular forex trading as well. If price is above BOTH EMAs and PSAR then you're looking for BUY opportunities. If price is below then you're looking for sell opportunities. Wait for price to break the most recent fractal high/low and retest; wait for a confirmation candle then enter a call/put and the expiry time is THREE candles.Pine Script® indicatorby bluetaco11235
Technical checklistNo one indicator is perfect. People always have their favorite indicators and maintain a bias on weighing them purely on psychological reasons other than mathematical. This technical checklist indicator collected 20 common indicators and custom ones to address the issue of a bias weighted decision. Here, I apply machine learning using a simple sigmoid neuron network with one hidden layer and a single node to avoid artifacts. For the ease of data collection, the indicator matrix is first shown as a heatmap. Once an uptrend signal window is selected manually, an indicator matrix can be recorded in a binary format (i.e., 1 0 0 1 1 0, etc.). For example, the following indicator matrix was retrieved from the MRNA chart (deciscion: first 5 rows, buying; last 5 rows, no buying): 1 1 0 0 0 1 1 1 1 1 0 1 0 0 1 1 0 1 1 1 1 1 0 0 1 1 1 0 0 0 1 0 1 1 0 1 0 1 1 1 0 0 1 1 0 1 0 0 0 1 1 1 0 0 1 0 0 1 0 0 1 1 0 0 0 1 1 1 1 1 1 0 1 0 0 1 0 1 0 0 0 0 1 1 0 1 1 1 0 1 1 1 0 1 1 1 0 1 0 0 1 1 0 0 1 0 1 0 0 0 0 1 0 0 0 1 0 0 1 1 1 1 0 0 0 0 1 0 0 0 0 1 0 0 1 1 0 1 1 1 0 0 0 0 1 0 1 0 0 1 1 0 0 0 0 0 0 1 0 0 0 0 0 0 0 0 1 0 0 0 1 0 0 1 0 0 0 1 1 1 0 0 0 0 1 0 1 0 0 0 1 0 1 0 0 0 0 1 1 1 This matrix is then used as an input to train the machine learning network. With a correlated buying decision matrix as an output: 1 1 1 1 1 0 0 0 0 0 After training, the corrected weight matrix can be applied back to the indicator. And the display mode can be changed from a heatmap into a histogram to reveal buying signals visually. Usage: python stock_ml.py mrna_input.txt output.txt Weight matrix output: 1.37639407 1.67969656 1.0162141 1.3184323 -1.88888442 8.32928588 -5.35777295 3.08739916 3.06464844 0.82986227 -0.53092333 -1.95045383 4.14441698 2.99179435 -0.08379438 1.70379704 0.4173048 -1.51870972 -2.14284707 -2.08513252 Corresponding indicators to the weight matrix: 1. Breakout 2. Reversal 3. Crossover of ema20 and ema60 4. Crossover of ema20 and ema120 5. MACD golden cross 6. Long cycle (MACD crossover 0) 7. RSI not overbought 8. KD not overbought and crossover 9. OBV uptrend 10. Bullish gap 11. High volume 12. Breakout up fractal 13. Rebounce of down fractal 14. Convergence 15. Turbulence reversal 16. Low resistance 17. Bullish trend (blue zone) 18. Bearish trend (red zone) 19. VIX close above ema20 20. SPY close below ema20 PS. It is recommended not to use default settings but to train your weight matrix based on underlying and timeframe.Pine Script® indicatorby lockeyjUpdated 1111533
Machine Learning: Logistic RegressionMulti-timeframe Strategy based on Logistic Regression algorithm Description: This strategy uses a classic machine learning algorithm that came from statistics - Logistic Regression (LR). The first and most important thing about logistic regression is that it is not a 'Regression' but a 'Classification' algorithm. The name itself is somewhat misleading. Regression gives a continuous numeric output but most of the time we need the output in classes (i.e. categorical, discrete). For example, we want to classify emails into “spam” or 'not spam', classify treatment into “success” or 'failure', classify statement into “right” or 'wrong', classify election data into 'fraudulent vote' or 'non-fraudulent vote', classify market move into 'long' or 'short' and so on. These are the examples of logistic regression having a binary output (also called dichotomous). You can also think of logistic regression as a special case of linear regression when the outcome variable is categorical, where we are using log of odds as dependent variable. In simple words, it predicts the probability of occurrence of an event by fitting data to a logit function. Basically, the theory behind Logistic Regression is very similar to the one from Linear Regression, where we seek to draw a best-fitting line over data points, but in Logistic Regression, we don’t directly fit a straight line to our data like in linear regression. Instead, we fit a S shaped curve, called Sigmoid, to our observations, that best SEPARATES data points. Technically speaking, the main goal of building the model is to find the parameters (weights) using gradient descent. In this script the LR algorithm is retrained on each new bar trying to classify it into one of the two categories. This is done via the logistic_regression function by updating the weights w in the loop that continues for iterations number of times. In the end the weights are passed through the sigmoid function, yielding a prediction. Mind that some assets require to modify the script's input parameters. For instance, when used with BTCUSD and USDJPY, the 'Normalization Lookback' parameter should be set down to 4 (2,...,5..), and optionally the 'Use Price Data for Signal Generation?' parameter should be checked. The defaults were tested with EURUSD. Note: TradingViews's playback feature helps to see this strategy in action. Warning: Signals ARE repainting. Style tags: Trend Following, Trend Analysis Asset class: Equities, Futures, ETFs, Currencies and Commodities Dataset: FX Minutes/Hours/DaysPine Script® indicatorby capissimoUpdated 113113 5.3 K
TrendLine ChannelsAbstract This script provides a set of Trendline Channels which can be tighter than Donchian Channels. This script computes the most suitable active upper and lower trendlines and updates them as soon as possible. We can use it for breakout signals earlier than Donchian Channels. Introduction Channels are tools which can mark area of values of ranging markets. Once the price leaves the original region, range traders may start admitting they are wrong and trigger trend. Donchian Channels (misheard as Dungeon Channels) use the highest and the lowest price to define area of values. When the price breakouts, it just like it got released from a dungeon. However, waiting for the price making even higher or lower may be too late and risk reward ratio may be lower. Trendlines can make the channels tighter and we can find earlier breakout signals. Computing Trendline Channels (1) Find the most active trendlines In this script, a valid trendline connects two high values or two low values. A high value means the highest value in a trading day. A low value means the lowest value in a trading day. In this script, every trendline does not crossover any bar but can exactly touch them. The most flat trendline is taken. (one for upper and one for lower) (2) Continue to use or Change a trendline If there is a tighter trendline available, this script changes to use it. If the previous active trendline is broken, this script re-computes the trendline available. When this case happens, this script display with an another color. Otherwise, this script continues using the previous trendline. (3) Middle line The middle line indicates the middle value between the upper and the lower. Parameters Length : how many days are used for computation. The default value is 16 just because 16=4*4, using binary characteristic. x_go_on : If the previous trendline is not breakout and there are no tighter trendlines available, we continue use it. Color Options (1) Upper trendline (no update or tighter) (2) Upper trendline (changed due to breakout) (3) Middle line (4) Lower trendline (no update or tighter) (5) Lower trendline (changed due to breakout) Conclusion Trendline Channels can be tighter than Donchian Channels and evaluate earlier breakout signals. Comparing to known auto trendline scripts, Trendline Channels is continuous. Once a trendline is broken, Trendline Channels can instantly point out the next available one. If you think the price movement is boring or you cannot have good risk reward ratio, you can go to an another timeframe. Reference How to trade with Donchian Channels How to trade with TrendlinesPine Script® indicatorby clocks156t174335
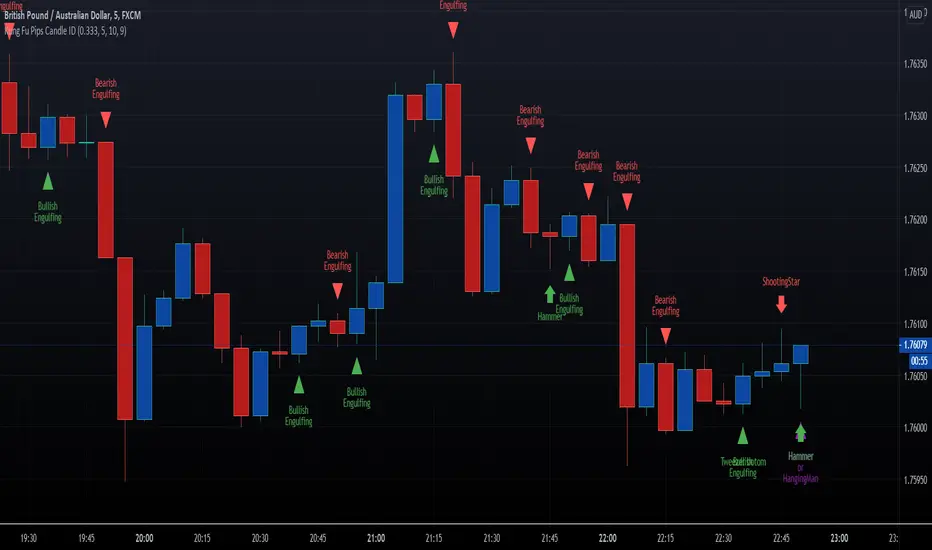
HFX Kung Fu Pips Candlestick Identifier by Trader ZThis indicator identifies the following candle stick patterns: Bullish and Bearish Engulfing Hammer/Hanging Man, Shooting Star Tweezer Tops and Bottoms Doji Star Doji Gravestone Made for trading Forex Binary Options but can be used in any market. When the candlestick pattern emerges the script will label the pattern. A helpful visual tool for your analysis. Enjoy!!!! Pine Script® indicatorby DarthZane11280
Price MovementPrice indicator that shows the trend based on price movement. The indicator determinants when an asset price is getting higher or lower by comparing the previous price highs and lows to the current price. ==Explanation== In case current HL2 exceeds the previous HL2 HIGH then the columns will turn green. In case current HL2 fails the previous HL2 LOW then the columns will turn red. The trick here is that the trend CONTINUES to show the greens and reds, until a reversal happens to the opposite side. This can be used to determinate trends and reversals. Note: Bar colors are disabled by default. You can set the lookback period at the indicator settings as well as the asset source (HL2,CLOSE, etc..). default is HL2 Quote that i like: “It is impossible to produce superior performance unless you do something different from the majority.” – John Templeton Enjoy and like if you like :)Pine Script® indicatorby dman103Updated 55584
quantized pin bar indicator with ATRAbstract This script computes the strength of pin bars. This script uses the corrent and the previous two bars to compute the strength of pin bars. The strength of pin bars can be also comared with average true range, so we can evaluate those pin bars are strong or weak. Introduction Pin bar is a popular price action trading strategy. It is based on quick price rejection. Most of existing pin bar scripts only determine if a bar is a pin bar or not. However, evaluating the strength of pin bars is important. If price rejection is too weak, it is difficult to trigger trend reversal. If a pin bar is too strong, we may enter the trade too late and cannot have good profit. In this script, it provides a method to compute to strength of pin bars. After the strength of pin bars are quantized, they can compare with average true range, price range and trend strength, which can help us to determine where are worthy for us to open trades. Computation Bullish hammer : current low is lower than ( previous high or current open ) and current close. Bearish gravestone : current high is higher than ( previous low or current open ) and current close. Bullish engulfing and harami : ( current low or previous low ) is lower than ( previous 2nd high or previous open ) and current close. Bearish engulfing and harami : ( current high or previous high ) is higher than ( previous 2nd low or previous open ) and current close. Parameters Smoothing : the type of computing average. Length of ATR : determines the number of true ranges for computing average true range. ATR multiplier line : the threshould that a pin bar is strong enough. For example, if this value is 0.5, it means a pin bar with 0.5*atr or more is considered a strong pin bar. one direction pinbar : set to 1 if you want the strength of bullish pin bars and bearish pin bars are cancelled. Set to 0 if you want to keep both strength of bullish pin bars and bearish pin bars; in this case, you may need to change the plot style to make both strength visible. Trading Suggestions Evaluate the strength of trend against pin bars. After all, a single reverse pin bar may be too weak to reverse the trend. Timeframe : if atr is higher than 4*spread, the timeframe is high enough. However, if strong pin bars appear too frequent or price range is too small, going to higher fimeframe may be more safe. Entry and exit : according to personal flavors. Conclusion The strength of pin bars can be quantized. With this indicator, we can find more potential pin bars which human eyes and binary pattern detectors were leaked. In my opinion, 0.5*atr is the most suitable streng of a pin bar for my trade entry but I still need to consider the direction of the trend. You are welcome to share your settings and related trading strategy. References Most of related knowledge can be searched from the internet. I cannot say the exact references because they may violate the rules of Tradingview.Pine Script® indicatorby clocks156t17422138
Dynamic Dots Dashboard (a Cloud/ZLEMA Composite)The purpose of this indicator is to provide an easy-to-read binary dashboard of where the current price is relative to key dynamic supports and resistances. The concept is simple, if a dynamic s/r is currently acting as a resistance, the indicator plots a dot above the histogram in the red box. If a dynamic s/r is acting as support, a dot is plotted in the green box below. There are some additional features, but the dot graphs are king. _______________________________________________________________________________________________________________ KEY: _______________________________________________________________________________________________________________ Currently the dynamic s/r's being used in the dot plots are: Ichimoku Cloud: Tenkan (blue) Kijun (pink) Senkou A (red) Senkou B (green) ZLEMA (Zero Lag Exponential Moving Average) 99 ZLEMA (lavender) 200 ZLEMA (salmon) You'll see a dashed line through the middle of the resistances section (red) and supports section (green). Cloud indicators are plotted above the dashed line, and ZLEMA's are below. _______________________________________________________________________________________________________________ How it Works - Visual _______________________________________________________________________________________________________________ As stated in the intro - if a dynamic s/r is currently above the current price and acting as a resistance, the indicator plots a dot above the histogram in the red box. If a dynamic s/r is acting as support, a dot is plotted in the green box below. Additionally, there is an optional histogram (default is on) that will further visualize this relationship. The histogram is a simple summation of the resistances above and the supports below. Here's a visual to assist with what that means. This chart includes all of those dynamic s/r's in the dynamic dot dashboard (the on-chart parts are individually added, not part of this tool). You can see that as a dynamic support is lost, the corresponding dot is moved from the supports section at the bottom (green), to the resistances section at the top (red). The opposite being true as resistances are being overtaken (broken resistances are moved to the support section (red)). You can see that the raw chart is just... a mess. Which kinda of accentuates one of the key goals of this indicator: to get all that dynamic support info without a mess of a chart like that. _______________________________________________________________________________________________________________ How To Use It _______________________________________________________________________________________________________________ There are a lot of ways to use this information, but the most notable of which is to detect shifts in the market cycle. For this example, take a look at the dynamic s/r dots in the resistances category (red background). You can see clearly that there are distinctive blocks of high density dots that have clear beginnings and ends. When we transition from a high density of dots to none in resistances, that means we are flipping them as support and entering a bull cycle. On the other hand, when we go from low density of dots as resistances to high density, we're pivoting to a bear cycle. Easy as that, you can quickly detect when market cycles are beginning or ending. Alternatively, you can add your preferred linear SR's, fibs, etc. to the chart and quickly glance at the dashboard to gauge how dynamic SR's may be contributing to the risk of your trade. _______________________________________________________________________________________________________________ Who It's For _______________________________________________________________________________________________________________ New traders: by looking at dot density alone, you can use Dot Dynamics to spot transitionary phases in market cycles. Experienced traders: keep your charts clean and the information easy to digest. Developers: I created this originally as a starting point for more complex algos I'm working on. One algo is reading this dot dashboard and taking a position size relative to the s/r's above and below. Another cloud algo is using the results as inputs to spot good setups. Colored Bars There is an option (off by default, shown in the headline image above) to fill the bar colors based on how many dynamic s/r's are above or below the current price. This can make things easier for some users, confusing for others. I defaulted them to off as I don't want colors to confuse the primary value proposition of the indicators, which is the dot heat map. You can turn on colored bars in the settings. One thing to note with the colored bars: they plot the color purely by the dot densities. Random spikes in the gradient colors (i.e. red to lime or green) can be a useful thing to notice, as they commonly occur at places where the price is bouncing between dynamic s/r's and can indicate a paradigm shift in the market cycle. _______________________________________________________________________________________________________________ Timeframes and Assets _______________________________________________________________________________________________________________ This can be used effectively on all assets (stocks, crypto, forex, etc) and all time frames. As always with any indicator, the higher TF's are generally respected more than lower TF's. Thanks for checking it out! I've been trading crypto for years and am just now beginning to publish my ideas, secret-sauce scripts and handy tools (like this one). If you enjoyed this indicator and would like to see more, a like and a follow is greatly appreciated 😁. Pine Script® indicatorby StanleyBostichUpdated 1414725
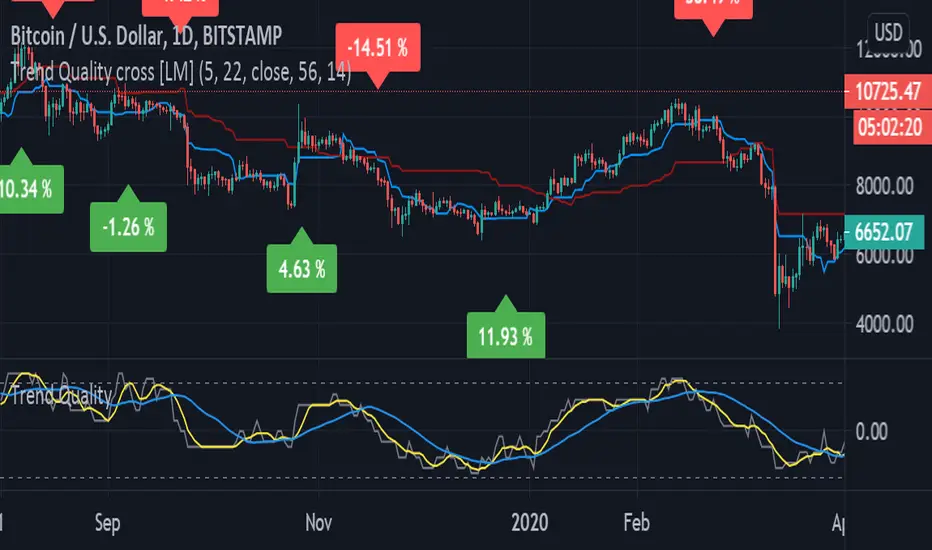
Trend Quality cross [LM]Hi Guys, I would like to introduce you Trend quality cross indicator. The idea orginallybcomes from @kruskakli and his indicator "Trend Quality" so shout-out to him I have modified the indicator to display just binary option buy/sell and display diff percentage from previous cross. Also there is a difference that I have double smoothed tq indicator results to give less false signals. and also added for the same reason like in my other indicator vpci ma cross base line and conversion line from ichimoku. Any suggestions are welcomedPine Script® indicatorby lmatl22277
Hybrid Overbought/Oversold Detector + Put/Call SignalsThere are many indicators of overbought/oversold conditions out there. Some of more common ones are: - Bollinger Bands %B - Money Flow Index (MFI) - Relative Strength Index (RSI) - Stochastic This script uses a combination of these 4 oscillators to confirm overbought/oversold and filter the signals of market reverse which could be used for trading binary options. You may select which oscillators you want to apply and of course change the source, the length of the calculations and the overbought/oversold levels. Also the script will draw a combined graph which is the average of the selected oscillators in the options. Send me your ideas!Pine Script® indicatorby informanerdUpdated 3939 1.1 K
Viejito MMR2 UpperThis set will help you get better opportunities to trade binary options. When price is close to any line, use the fibonacci to get confirmation and you can take 5 minutes trades. Always analyze in 5 min timeframePine Script® indicatorby andresplazas11100
Bayesian BBSMA OscillatorSometime ago (very long ago), one of my tinkering project was to do a spam or ham classification type app to filter news I'd wanna read. So I built myself a Naive Bayes Classifier to feed me my relevant articles. It worked great, I can cut through the noise. The hassle was I needed to manually train it to understand what I wanna read. I trained it using 50 articles and to my surprise, it's enough. Complexity Theory I've been reading a book called The Road to Ruin by Jim Rickards. He described how he got to his conclusion of how the stock market works by using Complexity Theory. Bill Williams would agree. Jim tells us that by using just enough data, we calculate the probability of an event to occur. We can't say for sure when but we know it's coming. This was my light bulb moment. While Jim talks much about Bayesian Inference in which a probability of an event can always be updated as more evidence comes to light, I had my eyes set on binary probabilities of when prices are going up and down. Assumptions These are my assumptions: Prices breaking up a Bollinger basis line will have fuel to go up even higher Prices will go down when prices have broken up a Bollinger upper band Scalping is the main method so we should use a lower period Moving Average (MA) When prices are above MA, it's likelier a correction to the downside is imminent When prices are below MA, it's likelier a correction to the upside is imminent Optimize parameters for 1 hour timeframe which will give us time to react while still having more opportunities to trade Building Blocks Jim Rickards started with limited data (events) while in technical trading, data are plentiful. I decided to classify 2 events which are: Next candles would be breaking up Next candles would be breaking down Key facts: We won't know for sure when prices are going to break We won't know for sure how much the prices movements are going to be Formulas Breaking up: Pr(Up|Indicator) = Pr(Indicator|Up) * Pr(Up) / Pr(Indicator|Up) * Pr(Up) + Pr(Indicator|Down) * Pr(Down) Breaking down: Pr(Down|Indicator) = Pr(Indicator|Down) * Pr(Down) / Pr(Indicator|Down) * Pr(Down) + Pr(Indicator|Up) * Pr(Up) Reading The Oscillator Green is the probability of prices breaking up Red is the probability of prices breaking down When either green or red is flatlining ceiling, immediately on the next candle when the probability decreases go short or long based on which direction you're observing - Strong Signal When either green or red is flatlining ceiling, take no action while it's ceiled Usually when either green or red is flatlining bottom, the next candle when the probability increases, immediately take a short long position based on the direction you're observing - Weak Signal When either green or red is flatlining bottom, take no action while it's bottomed Alerts Use Once per Bar option when generating alerts.Pine Script® indicatorby tistaUpdated 3737 1.4 K
Super EMA PrismThis script implements the Binary Trade Logic (BTL) algorithm to calculate two distinct scores that range from 0 to 7. One score is calculated assigning a power of 2 weight to the positive sign of 3 Phi^3 distant Moving Average (MA) slopes. The other score is calculated assigning a power of 2 weight to the sign of the difference between the price and the value of 3 Phi^3 distant Moving Average (MA). For the first score, hereafter called as the angle score (AS), the largest MA slope positive sign receives weight 4, the middle length MA slope positive sign receives weight 2 and the shortest MA slope positive sign receives weight 1. The positive sign of an MA is defined as 1 if the slope of the MA is positive and 0, otherwise. Therefore, for MAs 305, 72 and 17, if slope(MA305) > 0, slope(MA72) < 0 and slope(MA17) > 0, then score will be 4*1 + 2*0 + 1*1 = 5. Up to my knowledge, this score was first proposed by Bo Williams and named by him as Prisma. For the second score, hereafter called as the value score (VS), if the price > largest MA, it receives weight 4. If the price > the middle length MA, it receives weight 2 and if the price > the the shortest MA, it receives weight 1. Therefore, for MAs 305, 72 and 17, if price < MA305, price > MA72 and price > MA17, then score will be 4*0 + 2*1 + 1*1 = 3. Up to my knowledge, this score was first proposed by Bo Williams and named by him as Prisma. Both AS and VS are calculated for Phi^3 lengths (610, 144, 34) and for Phi^3/2 lengths (305, 72, 17). The scores of the same kind calculated for each set of length are combined multiplying the Phi^3 length score by 10 and adding with with the Phi^3/2 score, therefore providing a 2 digit score ranging from 0 to 77. For instance, if we have AS(610, 144, 34) = 7 and AS(305, 72, 17) = 5, we have AS=75. At the same time, if we have VS(610, 144, 34) = 6 and VS(305, 72, 17) = 4, we have VS=64. VS score is plotted by default in black, but it can be on white for dark themes. AS is plotted with the color of the longest MA used. Chart background is colored according to the range of values for AS and VS, checked in the following order: if AS >= 13 and VS <= 13 then back color = red if AS >= 13 or VS <= 13 then back color = orange if AS >= 64 and VS >= 64 then back color = green if AS >= 64 or VS >= 64 then back color = blue otherwise back color = none (white o black) Pine Script® indicatorby luyikaibrUpdated 44
Custom EMA PrismThis script implements the Binary Logic Trading (BLT) algorithm to calculate a score from 0 to 7. This score is calculated assigning a power of 2 weight to the positive sign of 3 Phi^3 distant EMAs' slopes. The largest EMA slope positive sign receives weight 4, the middle length EMA slope positive sign receives weight 2 and the shortest EMA slope positive sign receives weight 1. The positive sign of an EMA is defined as 1 if the slope of the EMA is positive and 0, otherwise. Therefore, for EMAs 305, 72 and 17, if slope(EMA305) > 0, slope(EMA72) < 0 and slope(EMA17) > 0, then score will be 4*1 + 2*0 + 1*1 = 5. Up to my knowledge, this score was first proposed by Bo Williams and named by him as Prisma. Due too sampling issues, this script ONLY WORKS with graphic time of 1d. I would like to thanks to MrBitmanBob for showing me how to get quotations from a graphic time distinct from the current one. This script also gets sampling data from graphic times 2h and 30m to calculate their score. As, even for smaller graphic times, price data is sampled at the current time frequency, the EMA lengths for those smaller graphic times needed to be proportionally decreased, meaning that when calculating the score for 1d with lengths 305, 72 and 17, the score for 2h must be calculated with lengths 72, 17 and 4, and the score for 30m must be calculated with lengths 17, 4 an 1. I understand that some precision may be lost but it is the best that is possible. There is an optional setting for Crypto Currencies that instead of calculating the score for 1d, 2h and 30m, it calculates the score for 1d, 4h and 60m. This is due to the fact that Crypto Currencies are traded 24x7. Despite of this setting, the labels at the Style tab of the settings window remains 2h and 30m, because they must be constants. This script with the corresponding EMAs chart and the EMAs Angle chart provides a broader view of the trading scenario. Pine Script® indicatorby luyikaibrUpdated 57