Ichimoku A/D Breakoutthis is basically a clone of the super a/d indicator but we're using a standard ichimoku as the source for the trend instead of the supertrend indicator
Search in scripts for "breakout"

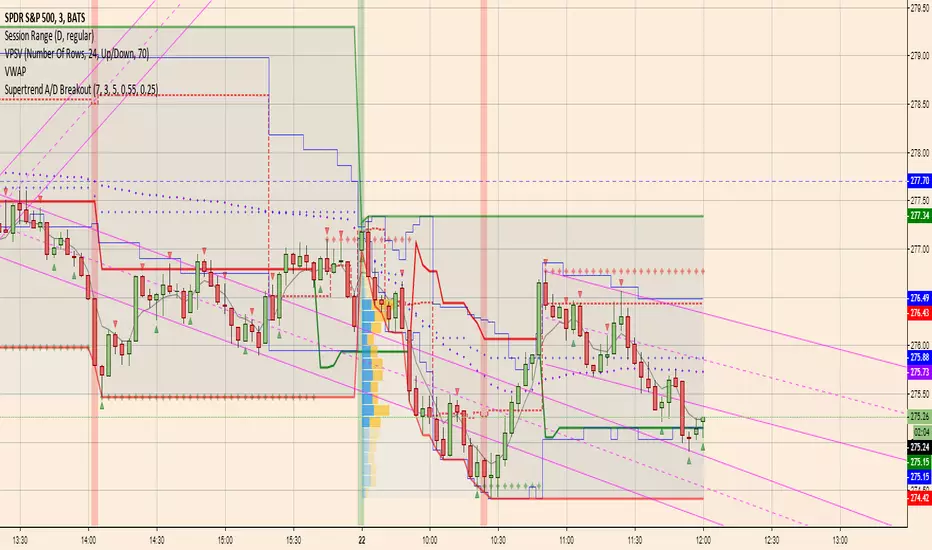
Supertrend A/D BreakoutModified Hoffman A/D:
1. uses standard supertrend to determine up/down direction (previous version used ema crossover)
2. uses improved A/D candlestick patterns
I'm optimistic about this one
High Low ChannelBasic high and low channels, allows for two high and two low channels of specified lengths.
Use for channel breakout trades, basic idea is to go long when the longer high channel is broken and close when shorter low channel is broken, vice versa for shorts
Feel free to leave me a tip if you like this script: 1MprT7YEEWaM6bUcpD7eeHM3Ht8n3R5jP1


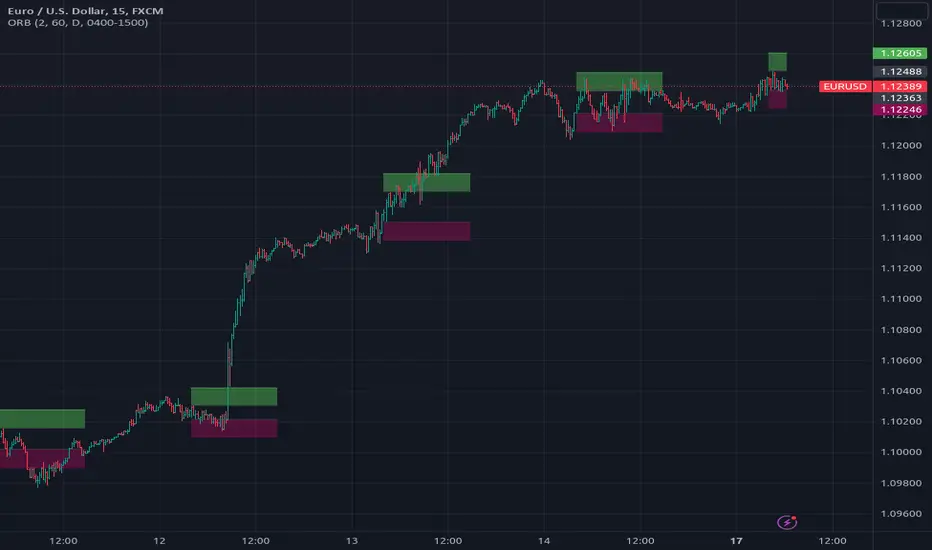
[RS]Open Range Breakout V3Request for DCC/coondawg71
added support for using session.
theres a issue with the session it needs to have the format inverted:
(start-end) to (end-start)
'0000-1500' to '1500-0000'
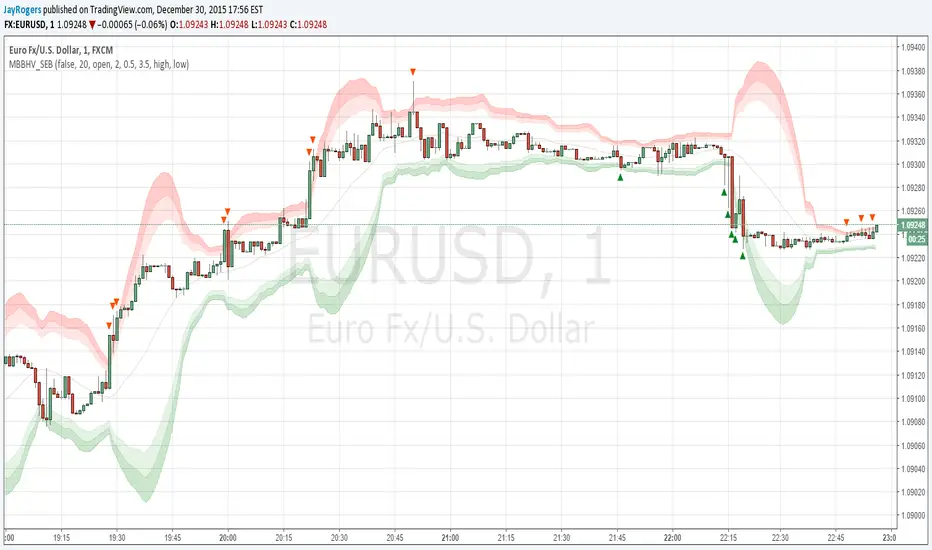
Multi BB Heat Vis - SMA/EMA/Breakout - r2I don't expect to iterate any further on this script, unless any weird issue crops up.
Description and usage detailed in the comments at the top of the script. Cheers!
To repaint or not to repaint, all the relevant sources are exposed as inputs for customisation - so the choice is yours.
Cheers!

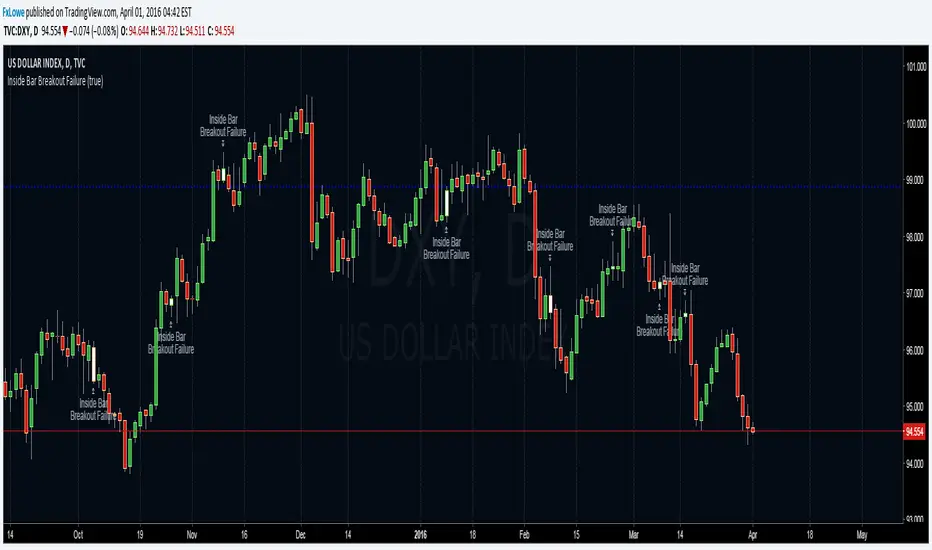
Fakey pattern (Inside Bar False Breakout)Inside Bar + False-Breakout = Fakey pattern
A Fakey pattern can have a pin bar as the false-break bar or not. Fakey’s are a very important and potent price action trading strategy because they can help us identify stop-hunting and provide us with a very good clue as to what price might do next.

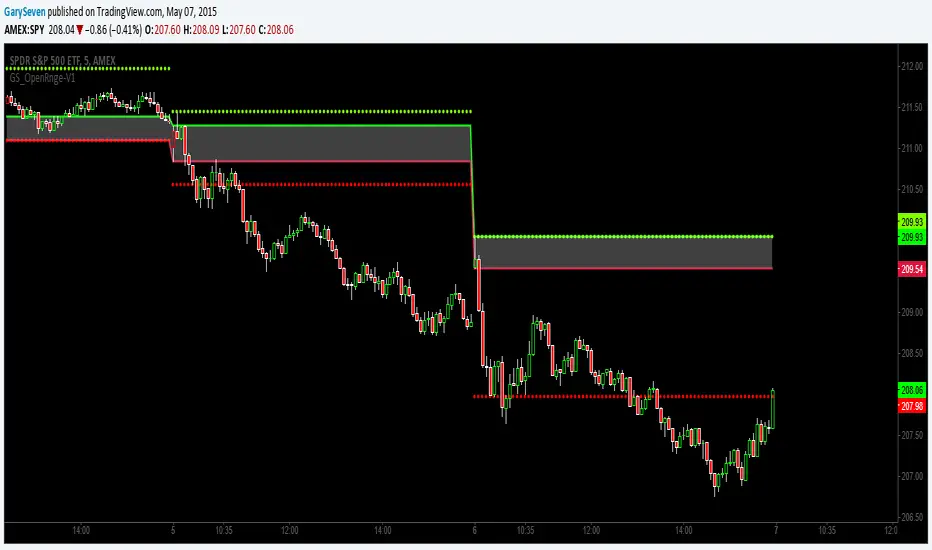
GS_Opening-Range-V1ORB Opening Range Breakout 5 and 3O Minute Indicator
Kudos to Chris Moody for the inspiration to create my first indicator.
The 5 and 30 run together at times but the scalp would be when the equity breaks the 5 go long or short for the scalp and when it breaks the 30 go for the swing trade.
Volatility Resonance CandlesVolatility Resonance Candles visualize the dynamic interaction between price acceleration, volatility, and volume energy.
They’re designed to reveal moments when volatility expansion and directional momentum resonate — often preceding strong directional moves or reversals.
🔬 Concept
Traditional candles display direction and range, but they miss the energetic structure of volatility itself.
This indicator introduces a resonance model, where ATR ratio, price acceleration, and volume intensity combine to form a composite signal.
* ATR Resonance: compares short-term vs. long-term volatility
* Acceleration: captures the rate of price change
* Volume Energy: reinforces the move’s significance
When these components align, the candle color “resonates” — brighter, more intense candles signal stronger volatility–momentum coupling.
⚙️ Features
* Adaptive Scaling
Normalizes energy intensity dynamically across a user-defined lookback period, ensuring consistency in changing market conditions.
* Power-Law Transformation
Optional non-linear scaling (gamma) emphasizes higher-energy events while keeping low-intensity noise visually subdued.
* Divergence Mode
When enabled, colors can invert to highlight energy divergence from candle direction (e.g., bearish pressure during bullish closes).
* Customizable Styling
Full control over bullish/bearish base colors, transparency scaling, and threshold sensitivity.
🧠 Interpretation
* Bright / High-Intensity Candles → Strong alignment of volatility and directional energy.
Often signals the resonant phase of a move — acceleration backed by volatility expansion and volume participation.
* Dim / Low-Intensity Candles → Energy dispersion or consolidation.
These typically mark quiet zones, pauses, or inefficient volatility.
* Opposite-Colored Candles (if divergence mode on) → Potential inflection zones or hidden stress in the trend structure.
⚠️ Disclaimer
This script is for educational purposes only.
It does not constitute financial advice, and past performance is not indicative of future results. Always do your own research and test strategies before making trading decisions.

ORB 5 Minute w/FVG and Retracement Breakout strategy creates five minute breakout lines on the 1 minute chart. Highlights any fair value gaps created within ORB and creates an arrow showing when a candle retraces into the fvg.

Breakout Condition Indicator - Long - V2 - Mega 86Script used for swing trading - contains certain adjustable metrics that I use for scanning and day or entry

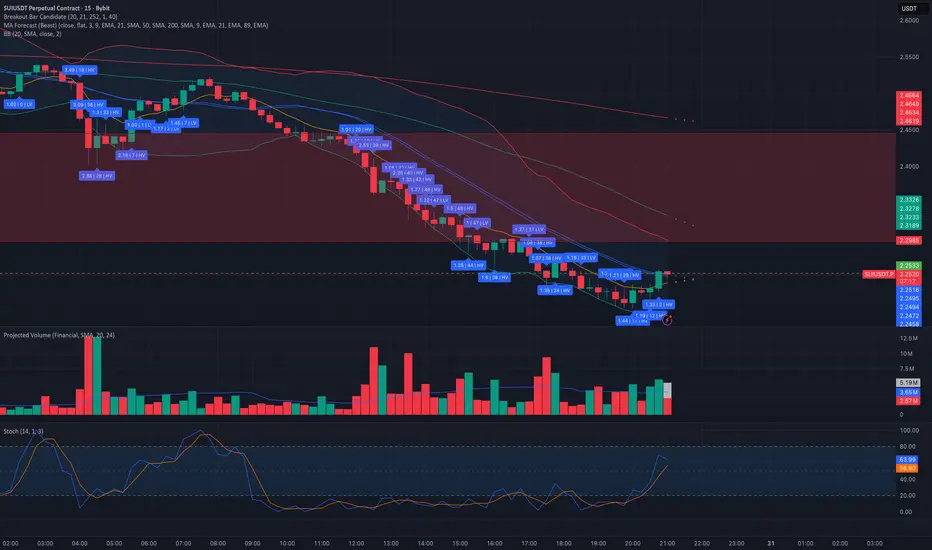
Breakout Bar CandidateShows the values of True Range, LS volatility and whether the volume is above or below average
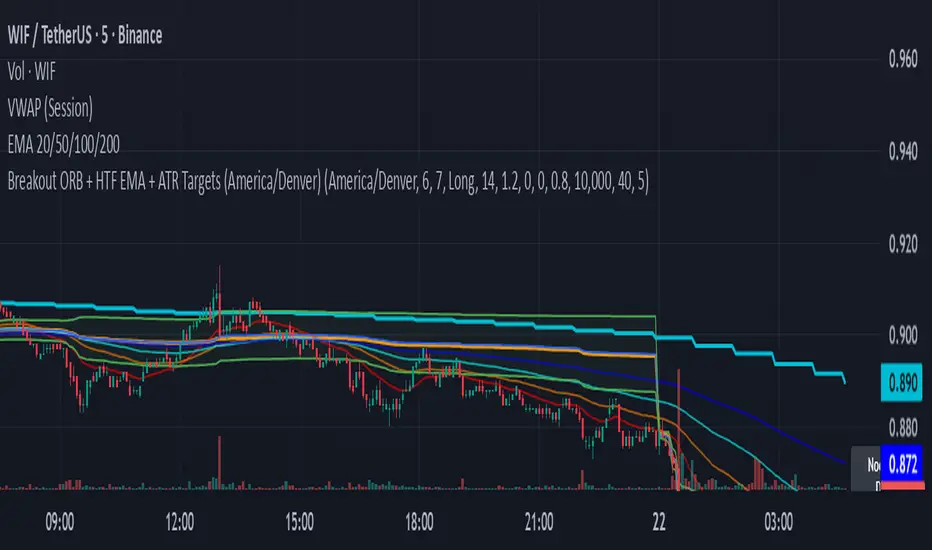
Breakout ORB + HTF EMA + ATR Targets (America/Denver)This is a perfect simple chart for those trading Crypto pairs between the London and US market overlays.
Breakout Retest ScannerStill working on it, but break the previous day high or low, retest and get an alert of some sort.

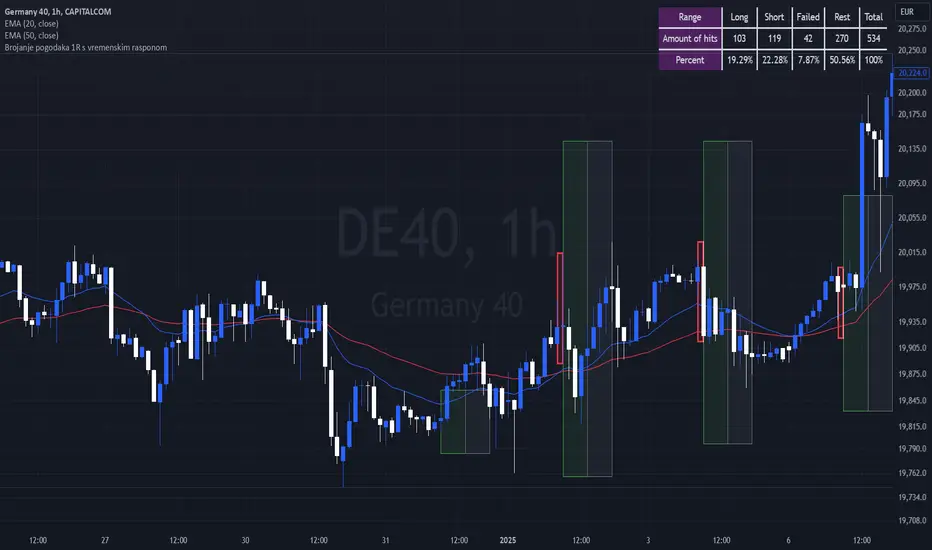
Breakout Josip strategy is focused on analyzing price movements during specific time intervals (from 9:00 AM to 12:00 PM) each day. It tracks the highest and lowest prices in that period and uses them to set targets for potential trades, placing horizontal lines based on these levels. Additionally, you're interested in tracking the success and failure of trades based on whether price breaks certain levels during this time range. The strategy also calculates various metrics like the percentage of successful trades, failed trades, and total trades during a selected time range.
Breakout Candles + RSIHello!
This is my firt script :)
This indicator looks for candles that are significantly larger than the previous X candle.
It is possible to set the following:
Multiplier: deviation from the size of the previous X candle (if set to 3 the size of the actual candle's body /abs(open - close)/ must be larger than the size of the bigger candle from the prevous X candles)
Previous candles: the number of previous candles to size check
Upper RSI limit: if the RSI14 close higher than the specified number, the candle will ignore
Lower RSI limit: if the RSI14 close lower than the specified number, the candle will ignore
Without dojis: if checked, watches candles only that do not have a bottom spike (bullish) or top spike (bearish). Useful for Heikin-Ashi candles
Feel free to left any suggestion!
Thank You!

Breakout Peak Detection - cryptofnqDetect peaks (and valleys) after the indicator has broken out of horizontal bands.
The peaks (and valleys) are connected by lines and the final line is extended to the right.
This can be used with built-in indicator functions or with other chart indicators.
I'm a coder, not a trader. If you find a useful strategy based on my scripts, please drop me a line.
