Inside Bar Setup [as]Inside Bar Setup Indicator Description
The **Inside Bar Setup ** indicator is a powerful tool for traders to identify and visualize inside bar patterns on their charts. An inside bar pattern occurs when the current candle's high is lower than the previous candle's high, and the current candle's low is higher than the previous candle's low. This pattern can indicate a potential breakout or a continuation of the existing trend.
Key Features:
1. **Highlight Inside Bar Patterns:**
- The indicator highlights inside bar patterns with distinct colors for bullish and bearish bars. Bullish inside bars are colored with the user-defined bull bar color (default lime), and bearish inside bars are colored with the user-defined bear bar color (default maroon).
2. **Marking Mother Candle High and Low:**
- The high and low of the mother candle (the candle preceding the inside bar) are marked with horizontal lines. The high is marked with a green line, and the low is marked with a red line.
- These levels are labeled as "Range High" and "Range Low" respectively, with the labels displayed a few bars to the right for clarity. The labels have a semi-transparent background for better visibility.
3. **Target Levels:**
- The indicator calculates and plots potential target levels (T1 and T2) for both long and short positions based on user-defined multipliers of the mother candle's range.
- For long positions, T1 and T2 are plotted above the mother candle's high.
- For short positions, T1 and T2 are plotted below the mother candle's low.
- These target levels are optional and can be toggled on or off via the input settings.
4. **Customizable Inputs:**
- **Colors:**
- Bull Bar Color: Customize the color for bullish inside bars.
- Bear Bar Color: Customize the color for bearish inside bars.
- **Long Targets:**
- Show Long T1: Toggle the display of the first long target.
- Show Long T2: Toggle the display of the second long target.
- Long T1: Multiplier for the first long target above the mother candle's high.
- Long T2: Multiplier for the second long target above the mother candle's high.
- **Short Targets:**
- Show Short T1: Toggle the display of the first short target.
- Show Short T2: Toggle the display of the second short target.
- Short T1: Multiplier for the first short target below the mother candle's low.
- Short T2: Multiplier for the second short target below the mother candle's low.
5. **New Day Detection:**
- The indicator detects the start of a new day and clears the inside bar arrays, ensuring that the pattern detection is always current.
#### Usage:
- Add the indicator to your TradingView chart.
- Customize the inputs to match your trading strategy.
- Watch for highlighted inside bars to identify potential breakout opportunities.
- Use the marked range highs and lows, along with the calculated target levels, to plan your trades.
This indicator is ideal for traders looking to capitalize on inside bar patterns and their potential breakouts. It provides clear visual cues and customizable settings to enhance your trading decisions.
Note:
This indicator is based on famous 15 min inside bar strategy shared by Subashish Pani on his youtube channel Power of stocks. Please watch his videos to use this indicator for best results.
Search in scripts for "breakout"

Pivot Extremes BreakoutI created the "Pivot Extremes Breakout" (PEB) indicator to easily spot breakout zones using pivot points. This tool comes from my need to anticipate market direction and capitalize on breakouts. PEB uses the last two pivot points to predict price paths and highlights potential breakout areas, adjusting for any timeframe. It simplifies seeing where the market might move next with color-coded lines and zones, aiming to improve your trading decisions.

NY Open Breakout Strategy - High Liquidity & Favorable RRR Pine Description:
The NY Open Breakout Strategy is an advanced Pine Script indicator tailored for the TradingView platform. This strategy is specifically designed to exploit the high liquidity found during the New York session opening in the Forex market. Its primary goal is to provide traders with an opportunity to engage in positions with lower risk and higher potential profits, thereby ensuring an advantageous risk-to-reward ratio (RRR).
Core Objectives:
Leveraging High Liquidity: Capitalizes on the significant market movements at the New York session opening, known for its high liquidity, to identify strong breakout signals.
Achieving Favorable RRR: By setting strategic stop-loss and take-profit levels, the strategy aims for a higher RRR. This approach can lead to overall profitability, even if the win rate is lower than the loss rate.
Functionality:
Dynamic Breakout Identification: Uses the first 15-minute candle’s high and low after NY open as benchmarks for detecting potential breakouts.
Customizable Stop-Loss & Take-Profit: Provides options to configure stop-loss at the last swing or the previous candle’s close. The take-profit levels are determined based on a favorable risk-reward ratio.
Visual Session Indicators: Includes distinct background coloring and vertical lines to mark the New York session for easy visibility.
Methodology:
This strategy hinges on the premise that the opening of the New York session often triggers key price movements due to an influx of trading activity. By focusing on these moments, our indicator aims to capture strong trends and breakout patterns. The carefully calibrated stop-loss and take-profit settings ensure that each trade aims for a higher potential reward compared to the risk undertaken.
Unique Features:
Enhanced Risk Management: With adaptable risk-reward settings, traders can tailor their trading strategies to align with individual risk appetites.
Personalized User Experience: Offers a range of customizable settings for visual elements, allowing traders to adjust the look and feel of the indicator to their preferences.
Usage Guidelines:
Customize the indicator settings, including the stop-loss reference and risk-reward ratio, to match your trading style.
Watch for 'Buy Enter' and 'Sell Enter' signals during the New York session opening.
Utilize the displayed stop-loss and take-profit levels to effectively manage each trade.
This NY Open Breakout Strategy is ideal for traders who prioritize efficient risk management while aiming to capitalize on the high liquidity periods of the Forex market. The strategy is designed to be robust, providing a pathway to profitability even in scenarios where the number of losing trades surpasses winning ones, thanks to its emphasis on a high risk-to-reward ratio.

Flag FinderFlag Finder Indicator is a technical analysis tool to identify bull and bear flags.
What are flags
Flags are continuation patterns that occur within the general trend of the security. A bull flag represents a temporary pause or consolidation before price resumes it's upward movement, while a bear flag occurs before price continues its downward movement.
Both flag patterns consist of two components:
The Pole
The Flag
The pole is the initial strong upward surge or decline that precedes the flag. The pole is usually a fast move accompanied by heavy volume signaling significant buying or selling pressure.
The flag is then formed as price consolidates after the initial surge or decline from the pole. For a bull flag price will drift slightly downward to sideways, a bear flag will drift upward to sideways. The best flags often see volume dry up during this phase of the pattern.
Indicator Settings
Both components are fully customizable in the indicator so the user can adjust for any time frame or volatility. Select the minimum and maximum accepted limits from the % gain loss required for the pole, the maximum acceptable flag depth or rally and the minimum and maximum number of bars for each component.
Colors and what components are visible at any time are also user controlled.
Trading flags
Traders typically use flags to enter on breakouts. A breakout occurs when price moves above the left side high of a bull flag or below the left side low of a bear flag.
Alerts
The Flag Finder allows for four different types of alerts
New Bull Flag
New Bear Flag
Bull Flag Breakout
Bear Flag Breakout
Pine Script
On top of the indicator identifying bull and bear flags, throughout the source code I left notes on nearly every line to help anyone who is interested in pine script see my thought process and explain which each line of code does. This code isn't too complex, but it offers a look into many different concepts one might use when writing pinescript such as:
input groups
declaring and reassigning variables
for loops
plotshapes & lines
alerts

Range H/L Buy and Sell SignalThe "Range H/L Buy and Sell Signal" indicator is designed to identify potential buy and sell signals based on a specified price range and market volatility. This indicator can be used in the TradingView platform to assist traders in making informed decisions.
The indicator allows customization of several parameters to adapt to different trading strategies. These parameters include the start and end times for the price range, the volatility threshold, and the desired breakout conditions.
To begin, the indicator calculates the range start and end timestamps based on the provided hours and minutes. This defines the time period within which the indicator will analyze price movements.
Next, the indicator determines the highest high (High) and lowest low (Low) within the specified price range. These levels represent the upper and lower boundaries of the range and act as potential breakout points.
Volatility is also taken into account to filter out false signals. The indicator calculates the true range and the average true range over a period of 14 bars. The true range measures the price range from the current high to low, while the average true range provides an indication of market volatility.
Based on the breakout conditions and the volatility threshold, buy and sell signals are generated. A buy signal occurs when the closing price crosses above the High and the true range is greater than the volatility threshold multiplied by the average true range. Conversely, a sell signal is triggered when the closing price crosses below the Low and the true range exceeds the volatility threshold multiplied by the average true range.
The indicator visually displays the High and Low levels as plotted lines on the chart. Additionally, it marks the buy signals with green labels labeled "BUY" below the corresponding bars and the sell signals with red labels labeled "SELL" above the bars.
It is important to note that this indicator should be used in conjunction with other technical analysis tools and indicators for comprehensive market analysis. Trading always carries risks, and it is crucial to exercise caution and conduct thorough analysis before making any trading decisions.
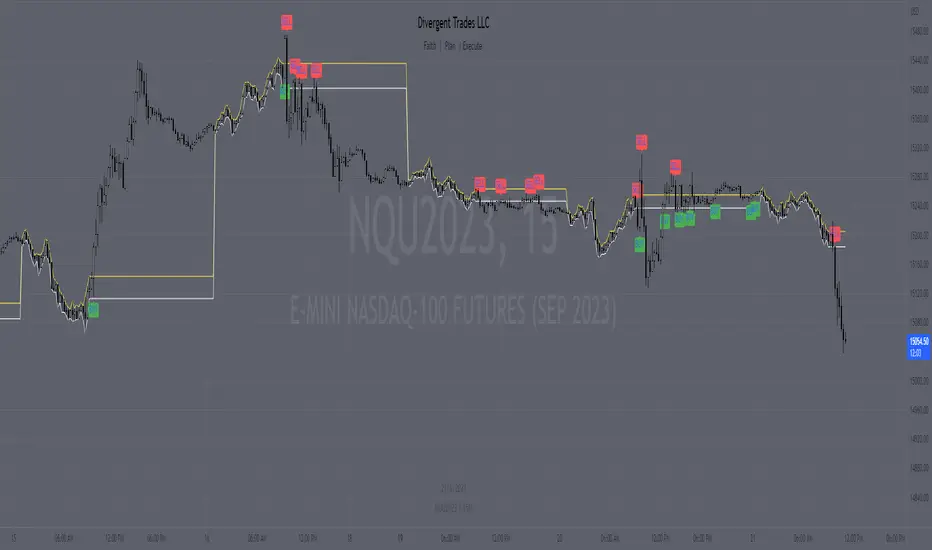
Divergent Trades LLC:
Disclaimer: The information provided by the Divergent Trades LLC indicator is for educational and informational purposes only. It should not be considered financial advice or a recommendation to buy, sell, or trade any financial instrument. Divergent Trades LLC is not responsible for any losses incurred as a result of using this indicator. Trading in the financial markets carries a high level of risk and may not be suitable for all investors. Before making any investment decisions, please consult with a financial advisor and do your own due diligence. Past performance is not indicative of future results. By using the Divergent Trades LLC indicator, you acknowledge that you have read and understand this disclaimer and agree to its terms and conditions.
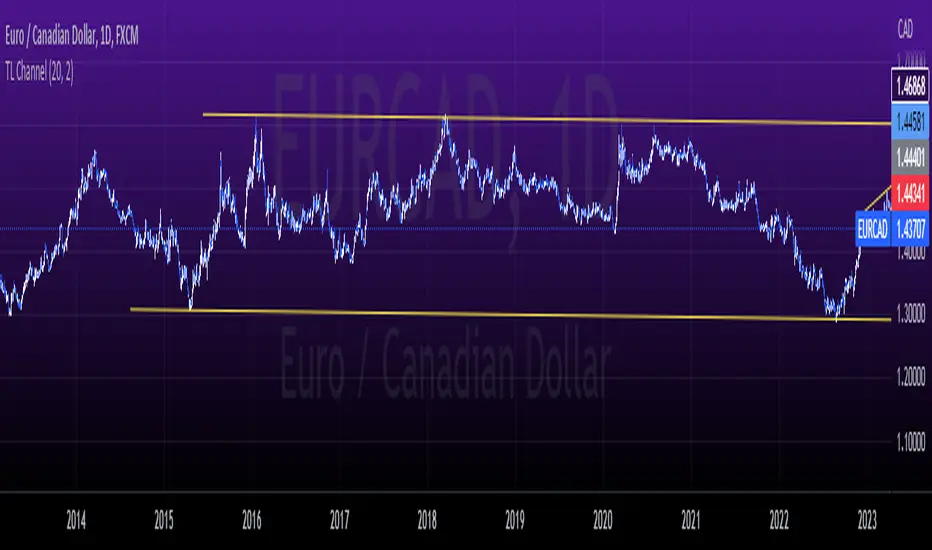
tlc with False BreakoutThe strategy aims to identify a trend line channel with the potential for a false breakout. Here's an explanation of the strategy:
The script starts by defining the input parameters. The lookback parameter determines the number of previous bars to consider for detecting the trend lines, and the threshold parameter controls the sensitivity of the trend line detection.
The script then initializes variables to store the trend lines, tap count, and the false breakout signal.
Inside the loop, the script iterates over the specified number of bars (lookback) to identify the trend lines. It checks if the current high is greater than the previous and next highs to identify an upper trend line and sets it using the line.new function. Similarly, it checks if the current low is smaller than the previous and next lows to identify a lower trend line and sets it.
The script also keeps track of the price levels of the upper and lower trend lines using the variables upperTrendLinePrice and lowerTrendLinePrice. These price levels are obtained using the line.get_y1 function.
After the fourth tap (when tapCount is equal to 4), the script checks if the current close price is above the upper trend line or below the lower trend line. If this condition is met, it sets the falseBreakout variable to true, indicating a potential false breakout.
Finally, the script plots a shape marker (plotshape) when a false breakout occurs. This is represented by an orange label displayed below the bar.
At the end of the script, the line.delete function is used to remove the old trend lines when the script reaches the last bar (barstate.islast).
By using this strategy, you can visually identify trend line channels where the upper and lower lines touch higher highs or lower highs and higher lows or lower lows. Additionally, it provides a false breakout signal when the price breaks above the upper trend line or below the lower trend line on the fifth tap.
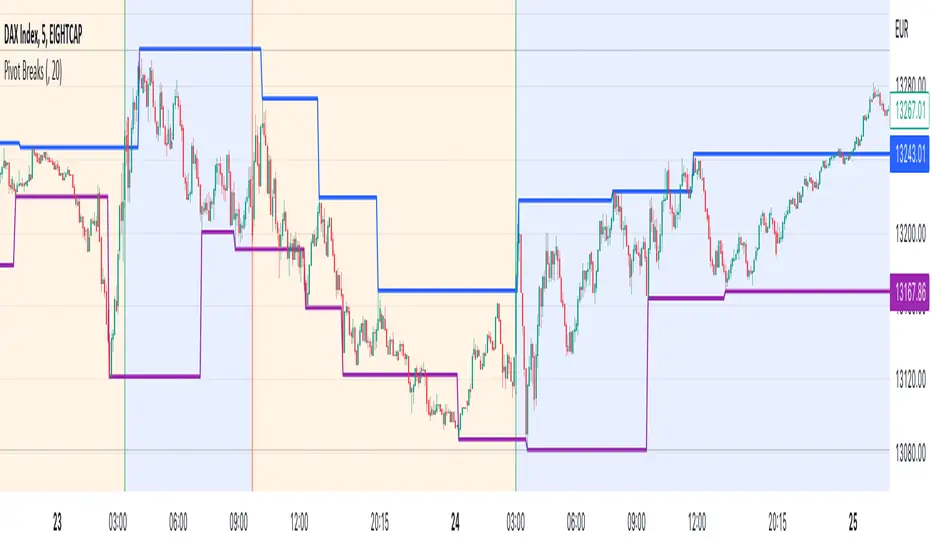
Pivot BreaksThere are built-in and published Pivot Point High Low indicators in Public Library. As far as I see none of them show the breaking candles or the trend.
with the closing price crossing over the previous / current pivot high A bearish breakOut can either indicate the progression of a lower high pattern or a trend reversal
with the closing price crossing under the previous / current pivot low A bullish breakOut can either indicate the progression of a higher low pattern or a trend reversal
This indicator can show the first breaking candle or all breaking candles . It Can also show The Breaking state (Trend) based on the last break.
Alert Mode is included, colour can be customised, Higher TimeFrame can be requested (it Can also cause repainting)
Inputs are optional as possible so have fun with it
Disclaimer: Scripts that I post publicly are experimental. They are not financial advices. Always backtest your ideas using your own methodologies.
Linear Regression & RSI Multi-Function Screener with Table-LabelHi fellow traders..
Happy to share a Linear Regression & RSI Multi-Function Custom Screener with Table-Labels...
The Screener scans for Linear Regression 2-SD Breakouts and RSI OB/OS levels for the coded tickers and gives Summary alerts
Uses Tables (dynamica resizing) for the scanner output instead of standard labels!
This Screener cum indicator collection has two distinct objectives..
1. Attempt re-entry into trending trades.
2. Attempt Counter trend trades using linear regression , RSI and Zigzag.
Briefly about the Screener functions..
a. It uses TABLES as Labels a FIRST for any Screener on TV.
b. Tables dynamically resize based on criteria..
c. Alerts for breakouts of the UPPER and the LOWER regression channels.(2 SD)
d. In addition to LinReg it also Screens RSI for OB/OS levels so a multifunction Screener.
e. Of course has the standard summary Alerts and programmable format for Custom functions.
f. Uses only the inbuilt Auto Fib and Lin Reg code for the screener.(No proprietary stuff)
g. The auto Zigzag code is derived(Auto fib).
Question what are all these doing in a single screener ??
ZigZag is very useful in determining Trend Up or Down from one Pivot to another.
So Once you have a firm view of the Current Trend for your chosen timeframe and ticker…
We can consider few possible trading scenarios..
a. Re-entry in an Up Trend - Combination of OS Rsi And a Lower Channel breach followed by a re-entry back into the regression channel CAN be used as an effective re-entry.
b. Similarily one can join a Down Trend on OB Rsi and Upper Channel line breach followed by re-entry into the regression channel.
If ZigZag signals a range-bound market, bound within channel lines then the Upper breakout can be used to Sell and vice-versa!
In short many possibilities for using these functions together with Scanner and Alerts.
This facilitates timely PROFITABLE Trending and Counter trend opportunities across multiple tickers.
You must give a thorough READ to the various available tutorials on ZigZag / Regression and Fib retracements before attempting counter trend trades using these tools!!
A small TIP – Markets are sideways or consolidating 70% of the time!!
Acknowledgements: - Thanks a lot DGTRD for the Auto ZigZag code and also for the eagerness to help wherever possible..Respect!!
Disclaimer: The Alerts and Screener are just few tools among many and not any kind of Buy/Sell recommendations. Unless you have sufficient trading experience please consult a Financial advisor before investing real money.
*The alerts are set for crossovers however for viewing tickers trading above or below the channel use code in line 343 and 344 after setting up the Alerts!
** RSI alerts are disabled by default to avoid clutter, but if needed one can activate code lines 441,442,444 and 445
Wish you all, Happy Profitable Trading!

SMT - Smart Money Thursday Boxes
The Smart Money Trading Thursday - is a very specific trading system. You only trade it on a Thursday.
The script/indicator will color Thursdays as two boxes. If you just want one color, use same color for
both boxes. The boxes is there to indicate London/New York sessions.
SETTINGS
In the setting you find a numeric value as 1700-0400:5
The "5" indicate Thursday. You can change that if you prefer to color another specific day.
For example "4" would indicate Wednesday. And you can change the hours to fit your
sessions and trading style.
You can also use the 2 boxes on different days. If you for example would like to color up
London for Wednesday and Thursday. Then set hours to fit London session and adjust the
:5 to 4 on the 1st box and 5 on the 2nd.
HOW TO USE IT?
The Smart Money works in a way retail trading does not. Smart Money has an objective
to locate retail patterns, where there will be a lot of stop loss volume to be grabbed.
So when a retail trader see a setup like a "Double Top / Bottom". The Institutional
will see $$$ of dumb money, ready to be taken. The best moves happen on a Thursday
but if you are a skilled trader, you can see the move also occur on Wednesday or Friday.
The first thing that will happen, is that the Smart Money Breaks out of session. Meaning
they will leave the current weeks high/low range. To start collect negative contracts
of the retail volume.
When you see that happen. And you see a breakout that consist of 4 in a row 1 hour
chart candles. Then you have your first rule meet.
#1 Thursday breakout of current weeks high/low. And the move is a clean 4 hour move
as 4x H1 candles. The move can start within range. But must end clearly outside.
Visual Example:
#2 Next, we await an engulf at peak or near peak. That is where Institutional
may have problem to match any more contracts, and since they used their own
money to make this move. They must now mitigate orders, and return back to
the original retail pattern as most retail traders are now stopped out.
(Normally this is a long/clear candle out of range. they rarely go lower
then retail traders entry in the 1st push. This to not save any souls :)
#3 Price returns back to where the breakout from the retail happens.
You can now take your profit as a Smart Money Trader. Trading with less risk,
you can take profit of the return of that latest 4x H1 candle move. (Order
Block)
CONCLUSION
The best trade is when you can combine a retail pattern, followed by a
breakout which holds 4x 1 hour candles in the outbreak direction.
2nd best is when you have the 4x H1 breakout and really no clear retail
pattern. Still is the same game. Just not as clear as the one above.
Study the steps in this image and you see what to look after:
Good Luck with your trading!
Regards,
The Hunter Trading Group

Big Breakout IndexBig Breakout Index is a great indicator for detecting breakouts. When the current close breaks out of consolidation, the indicator will tell you.
Green - Buy
Red - Sell

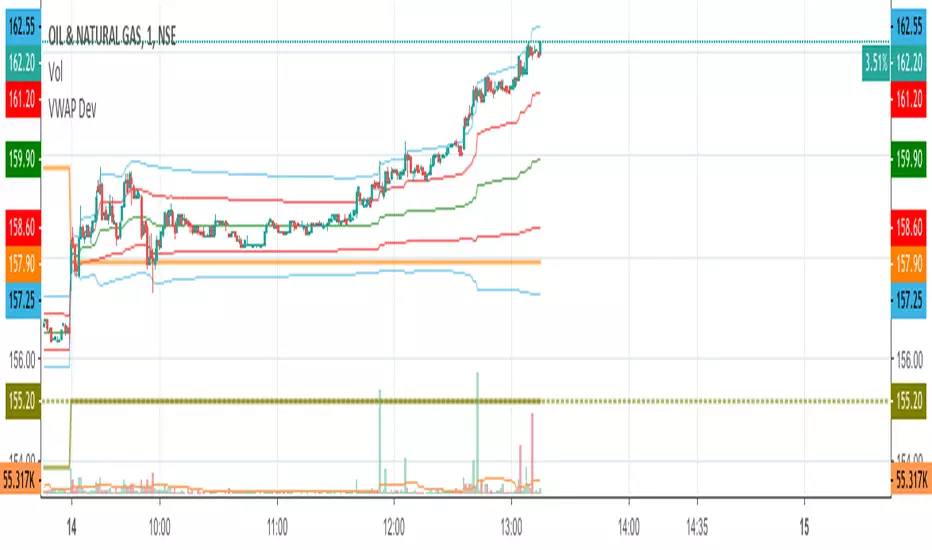
VWAP Stdev BandsCurrent price always obeys VWAP and is very useful for intraday traders. The Price will never go beyond the second deviation of VWAP at any point of time. The deviation bands are also very useful in predicting the volatility of the script.
Breakout trades can be taken based on the previous day's VWAP and it's deviations.
One can say that the stock has experienced breakout if current price crosses the fourth deviation of the previous day's VWAP or price bounces off that level, the price movement will be rapid if this occurs providing a good trading opportunity with low risk-reward ratio.
Systematic TF IndicatorThis is a simple trend following indicator which works off moving averages for trend bias and breakouts for entry.

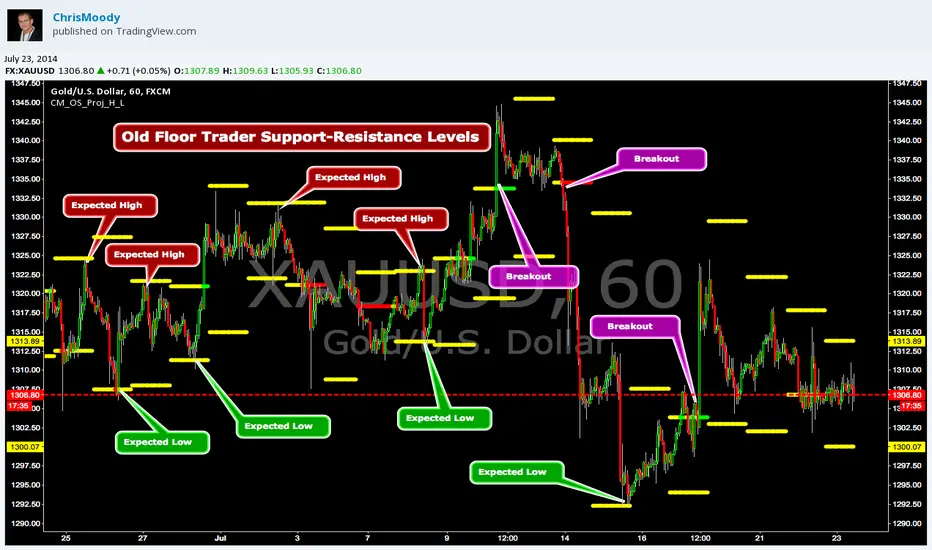
CM_OldSchool_Projected_high_LowHeard this story from Larry Williams…the trader who holds the record for winning the U.S. Trading Championship by turning $10K in to 2 Million.
A trader named Owen Taylor developed this formula as a Floor Trader before to calculate the Projected High and Low of the next day.
The formula worked so well…Owen charged other Traders 1K to get it.
I was pretty impressed with the results…so I coded it for the Weekly, Monthly, Quarterly, and Yearly Projected High Low.
While Owen considered these levels to be major support and resistance, Larry has developed many strategies based on the Breakout of the Projected High Low.
Therefore I coded it so the Levels would plot Yellow, and change to Green if the Projected High was taken out, and Red if the Projected Low was taken out.
***I’ve noticed on many instruments, Stocks, Index’s, Forex etc., depending on the instrument it works great as Support/Resistance or Breakouts.
***On a Daily Chart put the Quarterly and Yearly levels on SPY and EURUSD and go back about 10 years. Levels are pretty accurate.
Opening Range Breakout with VWAP & RSI ConfirmationThis indicator identifies breakout trading opportunities based on the Opening Range Breakout (ORB) strategy combined with intraday VWAP and higher timeframe RSI confirmation.
Opening Range: Calculates the high, low, and midpoint of the first 15 or 30 minutes (configurable) after your specified market open time.
Intraday VWAP: A volume-weighted average price calculated manually and reset daily, tracking price action throughout the trading day.
RSI Confirmation: Uses RSI from a user-selected higher timeframe (1H, 4H, or Daily) to confirm signals.
Buy Signal: Triggered when VWAP breaks above the Opening Range High AND the RSI is below or equal to the buy threshold (default 30).
Sell Signal: Triggered when VWAP breaks below the Opening Range Low AND the RSI is above or equal to the sell threshold (default 70).
Visuals: Plots Opening Range levels and VWAP on the chart with clear buy/sell markers and optional labels showing RSI values.
Alerts: Provides alert conditions for buy and sell signals to facilitate timely trading decisions.
This tool helps traders capture momentum breakouts while filtering trades based on momentum strength indicated by RSI.

Open Range BreakoutOpen Range Breakout (ORB)
The Open Range Breakout (ORB) is a classic intraday strategy used across stocks, indices, FX and futures. It focuses on how price behaves during the first minutes of a major session, when liquidity and volatility are highest.
This indicator fully automates the ORB process with session detection, box drawing, breakout & retest logic, and final Buy/Sell signals.
Multi-Session Support
Choose between the three most important global opens:
Asia (Tokyo) – JPY pairs, Asian indices, gold, crypto
London – FX majors, European indices, strong volatility
New York – US indices, USD pairs, gold, oil, highest volume
The Opening Range is calculated only during the selected session.
ORB Range (5 / 15 / 30 min)
The indicator builds the ORB High/Low from the first X minutes of the session, draws the box, and waits for price action once the range is complete.
How It Works
ORB Window → High/Low of the opening minutes are recorded.
Breakout → Price closes above/below the ORB → “BREAKOUT” label.
Retest → Price returns to the ORB box → “RETEST” label.
Confirmation Levels Freeze → Upper/lower structure set.
Final Signal
Close above frozen upper level → BUY
Close below frozen lower level → SELL
This filters out false breakouts and provides structured continuation signals.
Alerts
Includes built-in alert conditions for:
ORB BUY Signal
ORB SELL Signal
Alerts trigger exactly when the Buy or Sell label appears.
Works On
Stocks & indices
Forex
Futures

ATR Stop Loss Finder (Strict Breakout Mode)Title: ATR Stop Loss Finder (Strict Breakout Mode)
Description:
Volatility-Based Risk Management: Generates dynamic trailing stop-loss lines for both Long (Lower Line) and Short (Upper Line) positions based on ATR volatility.
Strict Breakout Detection: Features a unique "Strict Breakout" logic that highlights trend acceleration. It visually marks whenever the Long SL breaks a historical high or the Short SL breaks a historical low over a user-defined lookback period (e.g., 50 bars).
Visual Signals: Automatically plots Red Circles for bullish SL breakouts (New Highs) and Blue Circles for bearish SL breakdowns (New Lows), making strong momentum shifts easy to spot.
Real-Time Dashboard: Includes an informative table displaying current ATR and SL price levels for quick reference.

MeanReversion_tradeALERTOverview The Apex Reversal Predictor v2.5 is a specialized mean reversion strategy designed for scalping high-volatility assets like NQ (Nasdaq), ES (S&P 500), and Crypto. While most indicators chase breakouts, this system hunts for "Liquidity Sweeps"—moments where the market briefly breaks a key level to trap retail traders before snapping back to the true value (VWAP).
This is not just a signal indicator; it is a full Trade Manager that calculates your Entry, Stop Loss, and Take Profit levels automatically based on volatility (ATR).
The Logic: Why This Works Markets act like a rubber band. They can only stretch so far from their average price before snapping back. This script combines three layers of logic to identify these snap-back points:
The Stretch (Sigma Score): Measures how far price is from the VWAP relative to ATR. If the score > 2.0, the "rubber band" is overextended.
The Trap (Liquidity Sweep): Identifies Pivot Highs/Lows. It waits for price to break a pivot (luring in breakout traders) and then immediately reverse (trapping them).
The Exhaustion (RSI): Confirms that momentum is Overbought/Oversold to prevent trading against a strong trend.
Key Features
Dynamic Lines: Automatically draws Blue (Entry), Red (SL), and Green (TP) lines on the chart for active trades.
Smart Targets: Two modes for taking profit:
Mean Reversion: Targets the VWAP line (High Win Rate).
Fixed Ratio: Targets a specific Risk:Reward (e.g., 1:2).
Live Dashboard: Tracks Win Rate, Net Points, and the live "Stretch Score" in the bottom right corner.
Alert Ready: Formatted JSON alerts for easy integration with Discord or trading bots.
How & When to Use (User Guide)
1. Best Timeframes
5-Minute (5m): Best for NQ and volatile stocks (TSLA, NVDA). Filters out 1-minute noise but catches the intraday reversals.
15-Minute (15m): Best for Forex or slower-moving indices (ES).
2. The Setup Checklist Before taking a trade, look at the Dashboard in the bottom right:
Step 1: Check the "Stretch (Sigma)". Is it Orange or Red? This means price is extended and ripe for a reversal. If it's Green, the market is calm—be careful.
Step 2: Wait for the Signal.
"Apex BUY" (Green Label): Price swept a low and closed green.
"Apex SELL" (Red Label): Price swept a high and closed red.
Step 3: Execute. Enter at the close of the signal candle. Set your stop loss at the Red Line provided by the script.
3. Warning / When NOT to Use
Strong Trending Days: If the market is trending heavily (e.g., creating higher highs all day without looking back), do not fight the trend.
News Events: Avoid using this during CPI, FOMC, or NFP releases. The "rubber band" logic breaks during news because volatility expands indefinitely.

CODY BOT – Breakout SignalsCODY BOT is a minimalist, high-probability breakout indicator designed to keep your chart clean while highlighting actionable trading opportunities.
Unlike traditional indicators that generate too many signals, CODY BOT only alerts you to strong directional moves following consolidation, helping you focus on high-quality entries.
Key Features:
Detects breakouts above recent highs and below recent lows.
Filters weak moves using minimum candle body size.
Includes a cooldown period to prevent signal spam.
Clean and intuitive visual signals with large arrows for easy interpretation.
Optional customization for consolidation lookback bars, minimum candle size, and arrow visibility.
Alerts built-in for server-side and mobile notifications.
How to Use:
Look for BUY arrows when price breaks above consolidation highs.
Look for SELL arrows when price breaks below consolidation lows.
Combine with your preferred risk management and trend confirmation strategies.

VCP Trendline breakoutThe Signal:
Green Triangles indicate the price is approaching the trendline (Watchlist candidate).
Yellow Triangles indicate the price is very tight against the line (Execution imminent).
The Trigger: When price closes above the Grey Dotted Line, the line stops extending. This is your breakout signal.
Indicator Overview
The The VCP Trendline breakout indicator is a sophisticated technical indicator designed for trend followers and breakout traders (O'Neil, Minervini, Wyckoff styles). This script employs a State Machine logic to identify structural Volatility Contraction Patterns (VCP) in real-time.
It automatically detects valid Bases, tracks the "Right Side" construction, identifies nested handles (contractions), and draws precise supply trendlines—while strictly enforcing structural integrity rules (Higher Lows).
Core Logic & Features
1. Smart Base Detection
Trend Filter: The pattern recognition engine only activates when the price is above the 200 SMA, ensuring you are trading with the primary trend.
Base Validation: It identifies a "Base High" (H1) based on a configurable lookback period. It tracks the depth of the base and automatically invalidates the pattern if the drawdown exceeds the user-defined threshold (default 30%).
2. Recursive Nested Trendlines (VCP)
The indicator is capable of drawing Nested Trendlines (recursive resistance). It doesn't just draw a line from the peak; it identifies internal contractions within the base.
H1 (Primary): The main supply line from the top of the base.
H2, H3 (Internal): Trendlines connecting subsequent lower highs (handles) as volatility contracts.
Smart Fan: Includes a "Clean Fan" mode to show only the most relevant, latest trendline per anchor point.
3. Structural Integrity Enforcement (The "Higher Low" Rule)
This is the standout feature of this script. It performs an Anchor Integrity Check on every bar.
In a valid VCP, every contraction must form a Higher Low.
If the price creates a new pivot (H3) but then crashes lower than the previous contraction's floor (H2), the script identifies this as a Structural Failure.
Auto-Deletion: It immediately retroactively deletes the invalid trendlines associated with that failed contraction, keeping your chart clean and free of "ghost" signals.
4. "Right-Side" Logic
Collision Detection: Trendlines are calculated using "Right-Side Clearance." A line is only drawn if the path from the anchor to the new pivot is unobstructed by price action.
Signal Protection: "Watch" and "Near" signals are suppressed during the decline phase (Left Side). They only appear once the "Bottom" (L1) has been confirmed and price is recovering on the Right Side.
5. Proximity Alerts & Breakouts
Watch Zone (Green Triangle): Appears when the Low of the bar is within 8% (configurable) of a valid trendline.
Near Zone (Yellow Triangle): Appears when the Low of the bar is within 4% (configurable) of a valid trendline.
Breakout Stop: Trendlines are dynamic. The moment a bar closes above a trendline, the line stops extending immediately, marking the exact breakout point.
How to Use This Indicator
The Setup: Look for a stock in an uptrend (Price > 200 SMA).
The Construction: Wait for the script to identify the Base High (H1). As the price corrects and begins to recover, you will see Grey Dotted Lines appear, connecting the highs.
The Contraction: Watch for Nested Trendlines. If you see a second or third line form from a lower high (H2, H3), it indicates a tightening of price action (VCP).
Settings Configuration
Moving Averages
21 EMA, 50 SMA, 200 SMA: Built-in reference averages.
Base Settings
H1 Lookback: How many bars back the script looks to find the "Start" of the base (Default: 21). Increase this for longer-term bases.
Sub-High Pivot Bars: Controls the sensitivity of identifying internal highs (handles).
Max Base Depth: If the base drops more than this % (Default: 30%), the structure is considered failed and lines are removed.
Enable Nested Trendlines: Toggle ON to see internal VCP lines (H2, H3). Toggle OFF to see only the main H1 trendline.
Show Only Latest Line: Keeps the chart clean by removing older lines from the same anchor point.
Visuals & Signals
Near/Watch Zone %: Adjust the sensitivity of the Green/Yellow triangles.
Signal Size: Change the size of the triangle markers.
DISCLAIMER
This is an indicator, not a trading system. Apply good risk management and do your own due diligence before putting your hard earned money into anything.
This script is for educational and analytical purposes only. It does not constitute financial advice. Automated pattern recognition has limitations and should always be verified visually.

Range Lattice## RangeLattice
RangeLattice constructs a higher-timeframe scaffolding on any intraday chart, locking in structural highs/lows, mid/quarter grids, VWAP confluence, and live acceptance/break analytics. It provides a non-repainting overlay that turns range management into a disciplined process.
HOW IT WORKS
Structure Harvesting – Using request.security() , the script samples highs/lows from a user-selected timeframe (default 240 minutes) over a configurable lookback to establish the dominant range.
Grid Construction – Midpoint and quarter levels are derived mathematically, mirroring how institutional traders map distribution/accumulation zones.
Acceptance Detection – Consecutive closes inside the range flip an acceptance flag and darken the cloud, signaling balanced auction conditions.
Break Confirmation – Multi-bar closes outside the structure raise break labels and alerts, filtering the countless fake-outs that plague breakout traders.
VWAP Fan Overlay – Session VWAP plus ATR-based bands provide a live measure of flow centering relative to the lattice.
HOW TO USE IT
Range Plays : Fade taps of the outer rails only when acceptance is active and VWAP sits inside the grid—this is where mean-reversion works best.
Breakout Plays : Wait for confirmed break labels before entering expansion trades; the dashboard's Width/ATR metric tells you if the expansion has enough fuel.
Market Prep : Carry the same lattice from pre-market into regular trading hours by keeping the structure timeframe fixed; alerts keep you notified even when managing multiple tickers.
VISUAL FEATURES
Range Tap and Mid Pivot markers provide a tape-reading breadcrumb trail for journaling.
Cloud fill opacity tightens when acceptance persists, visually signaling balance compressions ready to break.
Dashboard displays absolute width, ATR-normalized width, and current state (Balanced vs Transitional) so you can glance across charts quickly.
Acceptance Flag toggle: Keep the repeated acceptance squares hidden until you need to audit balance.
PARAMETERS
Structure Timeframe (default: 240): Choose the timeframe whose ranges matter most (4H for indices, Daily for stocks).
Structure Lookback (default: 60): Bars sampled on the structure timeframe.
Acceptance Bars (default: 8): How many consecutive bars inside the range confirm balance.
Break Confirmation Bars (default: 3): Bars required outside the range to validate a breakout.
ATR Reference (default: 14): ATR period for width normalization.
Show Midpoint Grid (default: enabled): Display the midpoint and quarter levels.
Show Adaptive VWAP Fan (default: enabled): Toggle the VWAP channel for assets where volume distribution matters most.
Show Acceptance Flags (default: disabled): Turn the acceptance markers on/off for maximum visual control.
Show Range Dashboard (default: enabled): Disable if screen space is limited, re-enable during prep sessions.
ALERTS
The indicator includes five alert conditions:
Range High Tap: Price interacted with the RangeLattice high
Range Low Tap: Price interacted with the RangeLattice low
Range Mid Tap: Price interacted with the RangeLattice mid
Range Break Up: Confirmed upside breakout
Range Break Down: Confirmed downside breakout
Where it works best
This indicator works best on liquid instruments with clear structural levels. On very low timeframes (1-minute and below), the structure may update too frequently to be useful. The acceptance/break confirmation system requires patience—faster traders may find the multi-bar confirmation too slow for scalping. The VWAP fan is session-based and resets daily, which may not suit all trading styles.

FluxPulse Beacon## FluxPulse Beacon
FluxPulse Beacon applies a microstructure lens to every bar, combining directional thrust, realized volatility, and multi-timeframe liquidity checks to decide whether the tape is being pushed by real sponsorship or just noise. The oscillator's color-coded columns and adaptive burst thresholds transform complex flow dynamics into a single actionable flux score for futures and equities traders.
HOW IT WORKS
Momentum Extraction – Price differentials over a configurable pulse distance are smoothed using exponential moving averages to isolate directional thrust without reacting to single prints.
Volatility + Liquidity Normalization – The momentum stream is divided by realized volatility and multiplied by both local and higher-timeframe EMA volume ratios, ensuring pulses only appear when volatility and liquidity align.
Adaptive Thresholding – A volatility-derived standard deviation of flux is blended with the base threshold so bursts scale automatically between low-volatility and high-volatility market conditions.
Divergence Engine – Linear regression slopes compare price vs. flux to tag bullish/bearish divergences, highlighting stealth accumulation or distribution zones.
HOW TO USE IT
Continuation Entries : Go with the trend when histogram bars stay above the adaptive threshold, the signal line confirms, and trend bias agrees—this is where liquidity-backed follow-through lives.
Fade Plays : Watch for divergence alerts and shrinking compression values; when flux prints below zero yet price grinds higher, hidden selling pressure often precedes rollovers.
Session Filter : Compression percentage in the diagnostics table instantly tells you whether to trade thin overnight sessions—low compression means stand down.
VISUAL FEATURES
Dynamic background heat maps flux magnitude, while threshold lines provide a quick read on whether a pulse is statistically significant.
Diagnostics table displays live flux, signal, adaptive threshold, and compression for quick reference.
Alert-first workflow: The surface is intentionally clean—bursts and divergences are delivered via alerts instead of on-chart clutter.
PARAMETERS
Trend EMA Length (default: 34): Defines the macro bias anchor; increase for higher-timeframe confirmation.
Pulse Distance (default: 8): Controls how sensitive momentum extraction becomes.
Volatility Window (default: 21): Sample window for realized volatility normalization.
Liquidity Window (default: 55): Volume smoothing window that proxies liquidity expansion.
Liquidity Reference TF (default: 60): Select a higher timeframe to cross-check whether current volume matches institutional flows.
Adaptive Threshold (default: enabled): Disable for fixed thresholds on slower markets; enable for high-volatility assets.
Base Burst Threshold (default: 1.25): Minimum flux magnitude that qualifies as an actionable pulse.
ALERTS
The indicator includes four alert conditions:
Bull Burst: Detects upside liquidity pulses
Bear Burst: Detects downside liquidity pulses
Bull Divergence: Flags bullish delta divergence
Bear Divergence: Flags bearish delta divergence
LIMITATIONS
This indicator is designed for liquid futures and equity markets. Performance may degrade in low-volume or highly illiquid instruments. The adaptive threshold system works best on timeframes where sufficient volatility history exists (typically 15-minute charts and above). Divergence signals are probabilistic and should be confirmed with price action.
INSERT_CHART_SNAPSHOT_URL_HERE
---
## RangeLattice Mapper
RangeLattice Mapper constructs a higher-timeframe scaffolding on any intraday chart, locking in structural highs/lows, mid/quarter grids, VWAP confluence, and live acceptance/break analytics. It provides a non-repainting overlay that turns range management into a disciplined process.
HOW IT WORKS
Structure Harvesting – Using request.security() , the script samples highs/lows from a user-selected timeframe (default 240 minutes) over a configurable lookback to establish the dominant range.
Grid Construction – Midpoint and quarter levels are derived mathematically, mirroring how institutional traders map distribution/accumulation zones.
Acceptance Detection – Consecutive closes inside the range flip an acceptance flag and darken the cloud, signaling balanced auction conditions.
Break Confirmation – Multi-bar closes outside the structure raise break labels and alerts, filtering the countless fake-outs that plague breakout traders.
VWAP Fan Overlay – Session VWAP plus ATR-based bands provide a live measure of flow centering relative to the lattice.
HOW TO USE IT
Range Plays : Fade taps of the outer rails only when acceptance is active and VWAP sits inside the grid—this is where mean-reversion works best.
Breakout Plays : Wait for confirmed break labels before entering expansion trades; the dashboard's Width/ATR metric tells you if the expansion has enough fuel.
Market Prep : Carry the same lattice from pre-market into regular trading hours by keeping the structure timeframe fixed; alerts keep you notified even when managing multiple tickers.
VISUAL FEATURES
Range Tap and Mid Pivot markers provide a tape-reading breadcrumb trail for journaling.
Cloud fill opacity tightens when acceptance persists, visually signaling balance compressions ready to break.
Dashboard displays absolute width, ATR-normalized width, and current state (Balanced vs Transitional) so you can glance across charts quickly.
Acceptance Flag toggle: Keep the repeated acceptance squares hidden until you need to audit balance.
PARAMETERS
Structure Timeframe (default: 240): Choose the timeframe whose ranges matter most (4H for indices, Daily for stocks).
Structure Lookback (default: 60): Bars sampled on the structure timeframe.
Acceptance Bars (default: 8): How many consecutive bars inside the range confirm balance.
Break Confirmation Bars (default: 3): Bars required outside the range to validate a breakout.
ATR Reference (default: 14): ATR period for width normalization.
Show Midpoint Grid (default: enabled): Display the midpoint and quarter levels.
Show Adaptive VWAP Fan (default: enabled): Toggle the VWAP channel for assets where volume distribution matters most.
Show Acceptance Flags (default: disabled): Turn the acceptance markers on/off for maximum visual control.
Show Range Dashboard (default: enabled): Disable if screen space is limited, re-enable during prep sessions.
ALERTS
The indicator includes five alert conditions:
Range High Tap: Price interacted with the RangeLattice high
Range Low Tap: Price interacted with the RangeLattice low
Range Mid Tap: Price interacted with the RangeLattice mid
Range Break Up: Confirmed upside breakout
Range Break Down: Confirmed downside breakout
LIMITATIONS
This indicator works best on liquid instruments with clear structural levels. On very low timeframes (1-minute and below), the structure may update too frequently to be useful. The acceptance/break confirmation system requires patience—faster traders may find the multi-bar confirmation too slow for scalping. The VWAP fan is session-based and resets daily, which may not suit all trading styles.
---

Bassi's Pattern Breakout IndicatorBASSI'S PATTERN BREAKOUT INDICATOR
Author: Bassi | Published 2025
One of the cleanest and most accurate classic pattern detectors on TradingView – proudly coded and shared by Bassi.
Detects & confirms breakouts from:
• Double Top / Double Bottom
• Triple Top / Triple Bottom
• Head & Shoulders
• Inverse Head & Shoulders
Key Features:
• 100% non-repainting – signals only appear after candle close
• Smart breakout confirmation using the correct neckline level
• Visual pattern drawing (tops/bottoms + necklines)
• Clear breakout labels with vertical confirmation lines
• Real-time TradingView alerts (one alert per bar close)
• All alerts include "Bassi" prefix so you know it's the original
• Dynamic coloring for Double Bottom (red in lower areas, green in higher areas)
• No messy BUY/SELL labels – clean professional look (as requested by the community)
Why traders love it:
- Extremely reliable on all timeframes (1m to monthly)
- Works perfectly on Forex, Stocks, Crypto, Indices
- No false signals during consolidation
- Perfect for swing trading, scalping and position trading
Settings:
• Pivot Left/Right Bars – adjust sensitivity
• Price Tolerance % – how flat the tops/bottoms must be
• Max Pivot Storage – memory management
• Enable/disable alerts and visual markers
How to use:
1. Add to chart
2. Create alert → select "Bassi's Pattern Breakout Indicator"
3. Choose "Once per bar close"
4. Get notified instantly on every confirmed breakout!
This is the original and only authorized version by Bassi.
If you enjoy this indicator, please leave a like and follow for future updates!
© Bassi 2025 – All rights reserved
#pattern #breakout #doubletop #doublebottom #headandshoulders #tradingview #bassi

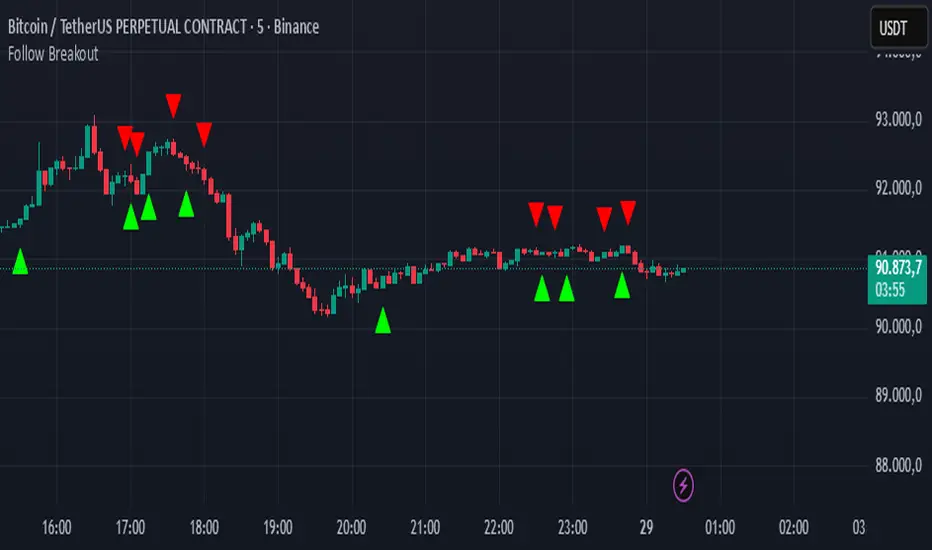
Follow BreakoutThe indicator tracks trend breakouts. It generates multiple signals during sideways trends.