NOVA Breakout Strategy v2.1 (TF M30)A clean, rules-based breakout signal tool for 30-minute charts.
It detects Dow swing breakouts and filters them with RSI, MACD and Volume so you only see the higher-quality entries. The script does not place trades and does not calculate SL/TP – it only prints clear LONG/SHORT labels at the entry price.
⸻
How it works
1. Timeframe enforcement – Signals are generated only on M30. On other timeframes the script shows a notice and stays silent.
2. Breakout engine (Dow swings) – The last confirmed swing high/low (pivots) is tracked.
• Breakout Up: bar closes above the last swing high by a small buffer.
• Breakout Down: bar closes below the last swing low by a small buffer.
3. Quality filters (all must be true):
• RSI (default length 30):
• Long: RSI > threshold and rising.
• Short: RSI < threshold and falling.
• MACD (12/26/9):
• Long: histogram > 0 and line > signal.
• Short: histogram < 0 and line < signal.
• Volume: current volume > SMA(volume, 20) × multiplier.
4. Debounce / anti-spam
• Cooldown of 4 hours (8 M30 bars) after any signal.
• Minimum price distance from the previous signal to avoid clustered labels.
5. Optional trend filter – Require EMA34 > EMA89 for Longs (and the opposite for Shorts).
Signals appear once the bar closes (barstate.isconfirmed). No swing lines are drawn to keep the chart clean; only entry labels are shown.
⸻
Inputs (key)
• RSI length & thresholds for Long/Short confirmation.
• MACD uses 12/26/9 (fixed).
• Volume multiplier (relative to SMA 20).
• Breakout buffer %, Cooldown hours, Min distance %.
• Enable EMA 34/89 trend filter (on/off).
• Show labels (on/off).
⸻
Usage tips
• Start with gold/major FX/indices on M30; use “Once per bar close” if you attach alerts.
• Increase the breakout buffer and volume multiplier in choppy markets.
• Tighten RSI thresholds (e.g., 55/45) if you want fewer but stronger signals.
⸻
Notes & limitations
• Pivots confirm after a few bars by definition; signals themselves are printed only on confirmed bar close and do not repaint once shown.
• This is a signal indicator, not investment advice. Always manage risk.
Search in scripts for "breakout"

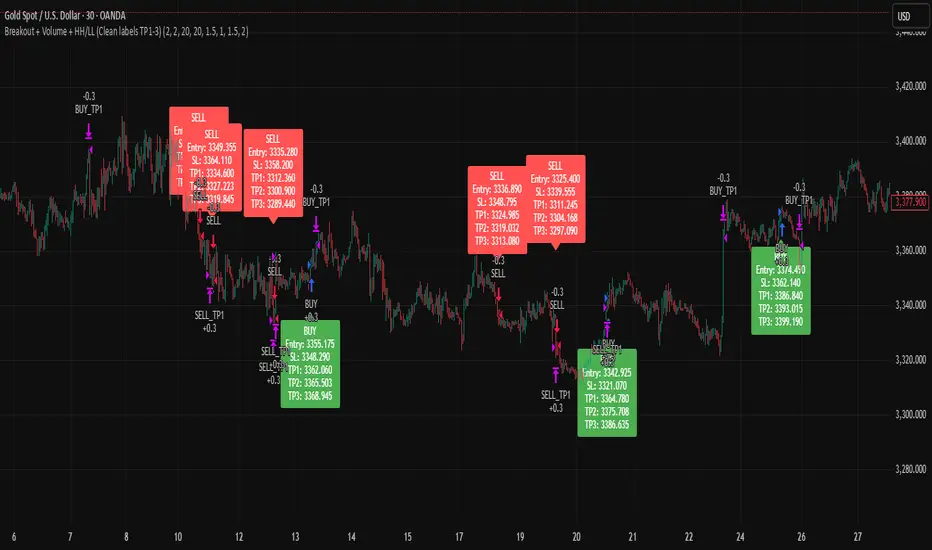
Breakout + Volume + HH/LL (Clean labels TP1-3)Breakout + Volume + HH/LL Strategy (Clean Labels)
This strategy combines breakout confirmation, volume strength, and market structure (Higher Highs / Lower Lows) to identify high-probability trade setups.
Breakout Filter: Uses a Donchian channel to detect price breakouts above resistance or below support.
Volume Confirmation: Requires volume to exceed the moving average of volume by a chosen multiplier, filtering out weak or false breakouts.
Market Structure: Long trades are only allowed if a Higher High (HH) has formed, and short trades only if a Lower Low (LL) has formed.
Trade Execution Rules:
For BUY trades: Entry at breakout, stop loss (SL) below the last pivot low, and three take profits (TP1–TP3) based on configurable risk-reward ratios.
For SELL trades: Entry at breakout, stop loss above the last pivot high, with TP1–TP3 levels set symmetrically below the entry.
Labels on Chart:
Each signal is marked with a clean label showing only:
Trade direction (BUY or SELL)
Entry price
Stop Loss
TP1, TP2, TP3
This makes the chart uncluttered while still providing all key trade information for execution or backtesting.
Open Range Breakout Strategy With Multi TakeProfitHello everyone,
For a while, I’ve been wanting to develop new scripts, but I couldn’t decide what to create. Eventually, I came up with the idea of coding traditional and well-known trading strategies—while adding modern features such as multi–take profit options. For the first strategy in this series, I chose the Open Range Strategy .
For those unfamiliar with it, the Open Range Strategy is a trading approach where you define a specific time period at the beginning of a trading session—such as the first 15 minutes, 30 minutes, or 1 hour—and mark the highest and lowest prices within that range. These levels then act as reference points for potential breakouts: if the price breaks above the range, it may signal a long entry; if it breaks below, it may indicate a short entry. This method is popular among day traders for capturing early momentum in the market.
Since this strategy is generally used as an intraday strategy , I added a Trade Session feature. This allows you to define the exact time window during which trades can be opened. Once the session ends, all positions are automatically closed, ensuring trades remain within your chosen intraday period.
Even though it’s a relatively simple concept, I’ve come across many different variations of it. That’s why I created a highly customizable project. Under the Session Settings, you can select the time window you want to define as your range. Whether it’s the first 15-minute candle or the entire first hour, the choice is entirely yours.
For stop-loss placement, there are two different options:
Middle of the Range – The stop loss is placed at the midpoint between the high and low of the defined range, offering a balanced buffer for both bullish and bearish setups.
Top/Bottom of the Range – The stop loss is placed just beyond the range’s high for short trades or just below the range’s low for long trades, providing a more conservative risk approach.
I’ve always been a big fan of the multi take-profit feature, so I added two different take-profit targets to this project. Take profits are calculated based on a Risk-to-Reward Ratio, which you can adjust in the settings. You can also set different position sizes for each target, allowing you to scale out of trades in a way that suits your strategy.
The result is a flexible, user-friendly strategy script that brings together a classic approach with modern risk management tools—ready to be tailored to your trading style

Multi Year BreakoutWhat the Script Does (Simple Summary)
Name: It's called "Multi Year Breakout" (or MYBO for short) and shows up right on your main price chart.
Settings You Control: You can easily change settings like:
How many months or years back the script should look to find the important old highest price and lowest price.
How many months back it should look for the recent highest price.
Whether you want to see the lines drawn on the chart for these highs and lows.
The color, thickness, and style (solid, dashed, dotted) of the lines.
An optional info box showing the price levels, where it appears, and the text size.
What it Calculates: It finds the exact price for the highest high in the "older" period you set, the highest high in the "recent" period, and the lowest low in the "older" period.
What it Draws:
It draws horizontal lines on your chart at these key price levels. Think of the high lines (Fuchsia for older, Orange for recent) as price ceilings (resistance).
It draws small triangle arrows below the price bars when a potential breakout happens.
The Breakout Signal:
It checks if today's closing price moved above the highest ceiling (either the older Fuchsia line or the recent Orange line, whichever was higher yesterday).
If it did, you get an arrow:
Fuchsia Arrow: Price broke above the older high ceiling (often more important).
Orange Arrow: Price broke above the recent high ceiling.
Alerts:
The script creates alert conditions. If you want a notification (popup, email, etc.), you MUST manually create an alert in TradingView's alert menu, choosing this script and selecting either the "Fuchsia Breakout" or "Orange Breakout" condition.
Best Way to Use It (Simple Guide)
Goal: Use this script to help find stocks that are breaking through significant past price ceilings. This might signal the start of a new upward move.
Best Charts: Works best on Daily or Weekly charts to see the bigger picture price action over months and years.
Setup:
Add the script to your preferred chart.
Adjust the settings (gear icon ⚙️) to define your "older" and "recent" periods (e.g., 60 months back for the older start, 12 months back for the older end / recent end).
Choose which lines you want to see (usually the Fuchsia and Orange high lines are most useful).
Reading the Chart:
Fuchsia Line: A major price level that stopped the price going higher in the more distant past. Breaking this is often significant.
Orange Line: The highest price reached more recently. Breaking this shows current momentum.
Arrows: An arrow appears when the price closes above the relevant high line (based on yesterday's level). The color tells you if it cleared the older (Fuchsia) or recent (Orange) hurdle.
Very Important - Use Other Tools Too! Don't trade based only on an arrow. Always look for extra confirmation:
Volume: Was there a lot more trading activity than usual on the breakout day? (High volume is a good sign).
Chart Pattern: Was the stock building up energy in a pattern before breaking out?
Market Direction: Is the overall stock market also looking positive?
Set Up Alerts (If Wanted): If you want TradingView to notify you, go to the 'Alert' menu, select this script (MYBO), choose the "Fuchsia Breakout" or "Orange Breakout" condition, and set how you want to be notified.
Manage Risk: Sometimes breakouts look good but then fail. Always decide before you trade how much you're willing to risk and where you'll exit if the price falls back down (use a stop-loss).
Think of this script as a signal that says "Hey, look at this stock, it just cleared an important level!". It's your cue to investigate further using other analysis before making any trading decisions.

Volume Breakout [Afnan]Introducing the Relative Volume / Volume Breakout Multiplier (RVI) , RVI is specifically designed for traders who incorporate volume breakout analysis into their trading strategies, particularly breakout traders.
This indicator provides a unique perspective on volume dynamics by quantifying the extent of volume breakouts in relation to the Simple Moving Average (SMA). It offers an upgraded version of the default volume indicator on TradingView, with the added feature of Relative Volume.
For example, if the volume SMA is 100M and the current volume is 200M, the indicator will return a breakout number of 2.0, indicating that the current volume is twice that of the volume SMA. Conversely, if the volume SMA is 100M and the current volume is 50M, the indicator will return a value of 0.50, indicating that the current volume is half of the volume SMA.
This tool can be a very helpful for breakout traders, helping them identify potential trading opportunities and assess volume strength more effectively. this indicator is a must-have in the toolkit of any trader who focuses on volume breakout analysis.
Remember, every tool we use, every analysis we perform, is a step towards becoming better traders. So, let’s embrace this journey of continuous learning and improvement together. As the saying goes, “The only limit to our realization of tomorrow will be our doubts of today." Let’s step into the future with confidence, armed with the right tools and the right mindset.
Lastly, a big thank you for your support, your likes, and your comments. They mean a lot! If you have any questions, feel free to ask. Together, let’s make trading a rewarding experience!

Premium Volatility Breakout Strategy [wbburgin]This the premium version of my Volatility Breakout strategy, which improves significantly on the original strategy (publicly available on my profile). Improvements are below. A note about any of my premium scripts: I will continue updating and improving the original (public) versions.
This strategy is not built for any specific asset or timeframe, and has been backtested on crypto, equities, and forex from 1min - 1day. However, I recommend using it on more volatile assets because it is a breakout strategy.
********** My Background
I am an investor, trader, and entrepreneur with 10 years of cryptocurrency and equity trading experience and founder of two fintech startups. I am a graduate of a prestigious university in the United States and carry broad and inclusive interests in mathematical finance, computer science, machine learning / artificial intelligence, as well as other fields.
**********
Improvements over the original Volatility Breakout strategy include:
Faster Trend Detection → The Premium Volatility Breakout strategy will catch trends faster by using adaptive volatility-weighted bands instead of standard-width volatility-weighted bands. This can improve win size and has performed well in my backtesting.
ADX Filter → False breakouts dampen the overall results of the original script, as well as the % profitable,so an ADX filter has been programmed into the script (toggle on/off in settings). This filter will only enter long and short trades when the ADX is above a certain threshold. This is by default toggled off because in most instances it will not be necessary, but in certain environments may be useful.
MA Configuration → Different types of moving averages and weights are now configurable in the settings. These can change the responsiveness of the strategy.
External Trend Filter → I use this strategy as a filter for some of my low-timeframe algorithms. I have added an external trend filter (a plot only displayed in the data window) that will return “1” when the trend is long and “-1” when the trend is short (displayed on-chart with red and green trend curves).
Customizable Alert Messages In-Strategy → In the settings, there will be text boxes where you can create your own alerts. All you will need to do is create an alert in the alert panel on TradingView and leave the message box blank - if you fill out the alert boxes in the settings, these will automatically populate into your alerts. There are in total four different customizable alerts messages: Entry and Exit alerts for both Long and Short sides. If you disable stop loss and/or take profit, these alerts will also be disabled. Similarly, if you disable shorts, all short alerts will be disabled.
About stop losses: This strategy does not come with a stop loss because the moving average acts as a stop loss / trade exit for both long and short entries.
**********
Display
You can turn off highlighting or barcolor in the settings. Additionally, future updates may include a color scheme for users using a light-themed window.
**********
Configuring Alerts
In TradingView desktop, go to the ‘Alerts’ tab on the right panel. Click the “+” button to create a new alert. Select this strategy for the condition and one of the two options that includes alert() function calls. Name the alert what you wish and clear the default message, because your text in the settings will replace this message.
Now that the alert is configured, you can go to the settings of the strategy and fill in your chosen text for the specific alert condition. You will need to check “Long and Short” in the “Trade Direction” setting in order for any Short Alerts to become active.
**********
Disclaimer
Copyright by wbburgin.
The information contained in my Scripts/Indicators/Algorithms does not constitute financial advice or a solicitation to buy or sell any securities of any type. I will not accept liability for any loss or damage, including without limitation any loss of profit, which may arise directly or indirectly from the use of or reliance on such information.
All investments involve risk, and the past performance of a security, industry, sector, market, financial product, trading strategy, backtest, or individual's trading does not guarantee future results or returns. Investors are fully responsible for any investment decisions they make. Such decisions should be based solely on an evaluation of their financial circumstances, investment objectives, risk tolerance, and liquidity needs.

Wunder Breakout botWunder Breakout bot
1. Wunder Breakout bot is based on the breakout of the trend line. Breakout is a technical trading strategy that is used to determine the moment of a trend line breakout on the price chart. It is based on the assumption that when price crosses a trend line, it signals a change in trend direction and the possible start of a new price movement.
2. The entry points for the trendline breakout strategy are based on the principle of breaking through a set trendline. This means that we look for the moment when the price of the asset crosses the trend line that we have established in order to enter a sell or buy position.
3. We use fixed take-profit and stop-loss, but you can use other risk management systems, based on the suggested settings.
4. Wunder Breakout bot script has added a function to calculate the risk per portfolio (your deposit). When this option is enabled, you get the calculation of the entry amount in dollars relative to your Stop Loss. You can chooseselect the percentage of risk per your portfolio in the settings. the percentage of risk per your portfolio in the settings. The loss will be calculated from the amount that will be displayed on the chart.
For example, if your deposit is $1000 and you set your risk at 1%, with a Stop Loss of 5%, your entry volume would be $200. The SL loss would be $10. $10 is your 1% risk or 1% of your deposit.
*Important! ** The risk per trade must be less than the Stop Loss value. If the risk is more than SL, you should use leverage.
The amount of funds included in the deal is calculated in dollars. This option was created if you want to send a dollar amount from Tradingview to the exchange. However, by specifying the volume in dollars, you will get the net profit and drawdown displayed incorrectly in the backtest results because TradingView calculates the backtest volume in contracts.
To display the correct net profit and drawdown values in Tradingview backtest results, use the "Volume in Contracts" option.

Volatility Range Breakout Strategy [wbburgin]The "Volatility Range Breakout Strategy" uses deviations of high-low volatility to determine bullish and bearish breakouts.
HOW IT WORKS
The volatility function uses the high-low range of a lookback period, divided by the average of that range, to determine the likelihood that price will break in a specific direction.
High and low ranges are determined by the relative volatility compared to the current closing price. The high range, for example, is the (volatility * close) added to the close, the low range is this value subtracted by the close.
A volatility-weighted moving average is taken of these high and low ranges to form high and low bands.
Finally, breakouts are identified once the price closes above or below these bands. An upwards breakout (bullish) occurs when the price breaks above the upper band, while a downwards breakout (bearish) occurs when the price breaks below the lower band. Positions can be closed either by when the price falls out of its current band ("Range Crossover" in settings under 'Exit Type') or when the price falls below or above the volatility MA (default because this allows us to catch trends for longer).
INPUTS/SETTINGS
The AVERAGE LENGTH is the period for the volatility MA and the weighted volatility bands.
The VOLATILITY LENGTH is how far the lookback should be for highs/lows for the volatility calculation.
Enjoy! Let me know if you have any questions.

Yesterday’s High Breakout - Trend Following StrategyYesterday’s High Breakout it is a trading system based on the analysis of yesterday's highs, it works in trend-following mode therefore it opens a long position at the breakout of yesterday's highs even if they occur several times in one day.
There are several methods for exiting a trade, each with its own unique strategy. The first method involves setting Take-Profit and Stop-Loss percentages, while the second utilizes a trailing-stop with a specified offset value. The third method calls for a conditional exit when the candle closes below a reference EMA.
Additionally, operational filters can be applied based on the volatility of the currency pair, such as calculating the percentage change from the opening or incorporating a gap to the previous day's high levels. These filters help to anticipate or delay entry into the market, mitigating the risk of false breakouts.
In the specific case of NULS, a 9% Take-Profit and a 3% Stop-Loss were set, with an activated trailing-stop percentage. To postpone entry and avoid false breakouts, a 1% gap was added to the price of yesterday's highs.
Name : Yesterday's High Breakout - Trend Follower Strategy
Author : @tumiza999
Category : Trend Follower, Breakout of Yesterday's High.
Operating mode : Spot or Futures (only long).
Trade duration : Intraday.
Timeframe : 30M, 1H, 2H, 4H
Market : Crypto
Suggested usage : Short-term trading, when the market is in trend and it is showing high volatility.
Entry : When there is a breakout of Yesterday's High.
Exit : Profit target or Trailing stop, Stop loss or Crossunder EMA.
Configuration :
- Gap to anticipate or postpone the entry before or after the identified level
- Rate of Change for Entry Condition
- Take Profit, Stop Loss and Trailing Stop
- EMA length
Backtesting :
⁃ Exchange: BINANCE
⁃ Pair: NULSUSDT
⁃ Timeframe: 2H
⁃ Fee: 0.075%
⁃ Slippage: 1
- Initial Capital: 10000 USDT
- Position sizing: 10% of Equity
- Start : 2018-07-26 (Out Of Sample from 2022-12-23)
- Bar magnifier: on
Credits : LucF for Pine Coders (f_security function to avoid repainting using security)
Disclaimer : Risk Management is crucial, so adjust stop loss to your comfort level. A tight stop loss can help minimise potential losses. Use at your own risk.
How you or we can improve? Source code is open so share your ideas!
Leave a comment and smash the boost button!
Thanks for your attention, happy to support the TradingView community.

Opening Range Breakout (and price targets)This Opening Range Breakout indicator stands apart from others for several reasons. Apart from displaying the opening range high and low on a chart, the script also plots customized potential price targets ( different from any other on TradingView! ) for breakouts and breakdowns in price action. These customized targets can be toggled on and off in the input section of the indicator's settings.
With regard to the indicator itself, it has two other key inputs, the "ORB total time (minutes)" and "ORB Timeframe". The first input sets the maximum number of minutes to be used in the calculation of the opening range, and the second input sets the specific time frame when the opening range is calculated. The script plots the opening range high and low on the chart as two separate lines with the high in blue and the low in white, and these lines dynamically change color of the high to green and the low to red if the current price is above or below the opening range, respectively.
The script starts by calculating whether or not the current bar falls within the specified time frame. It then sets the initial values of the opening range high and low, and continuously updates these values if the current bar's high or low is higher or lower than the previous values, respectively. The updated values are then plotted on the chart with the specified style and color.
Traders may use the ORB Indicator to trade breakouts and breakdowns of the opening range. If the price breaks above the opening range high, traders may look to enter long positions, and if the price breaks below the opening range low, traders may look to enter short positions. The customized price targets may be consulted for potential areas to take profit. The color change of the high and low lines can provide additional confirmation of a potential breakout or breakdown, adding to the strength of the trade setup. It is important to note that the ORB Indicator does not guarantee success, and traders should always consider other technical and fundamental factors before entering a trade.
Users can also create alerts for when price breaks above or below the opening range. This will provide up-to-date live alerts for traders who cannot be staring at their screens all day long.

PriceCatch Breakout Signals IOHi TradingView Community.
Here is a script that identifies and marks two different breakout levels on the chart. It works on all instruments - equities, forex, crypto & commodities.
Probable Breakout Buy Level
Stop-Reverse Buy Level
The above chart is self-explanatory. The script uses two different formulas to look out for breakouts. This logic opens up more opportunities.
As the levels are marked in advance before the breakouts occur, it will give traders ample time to study further and plan the trade.
PLAYING SAFE
After taking the trade, to play safe, I follow this method that once the Low of the price goes above the Breakout Level, I usually shift the stop loss to buy price to protect against any sudden reversal. For me protecting capital is important. As usual with price action, longer time-frames produce more reliable signals.
STOP LOSS
While the initial stop level is suggested, traders may also use the ATR to set stop loss. Users may find my free script 'ATR value on Chart' useful.
NOTE - PRIOR TO USING THIS SCRIPT:
You may use this script in addition to your other indicators or independently. Please remember that the script is shared with absolutely no assurances and warranties whatsoever regarding usability and as a responsible trader, please satisfy yourselves thoroughly and use it only if you are convinced it works for you. Remember, you are 100% responsible for your actions. If you understand and accept that, you may use the script. The script does not identify any short signals.
QUERIES/FEEDBACK
Please PM me.
Regards to all and wish everyone all the best with trading.

Matze BreakoutShows 2 different states of breakout:
Arrow = unusual volume, raising volume, positiv rate of change, standard deviation breakout
Bolt = very unusual volume, very high standard deviation breakout

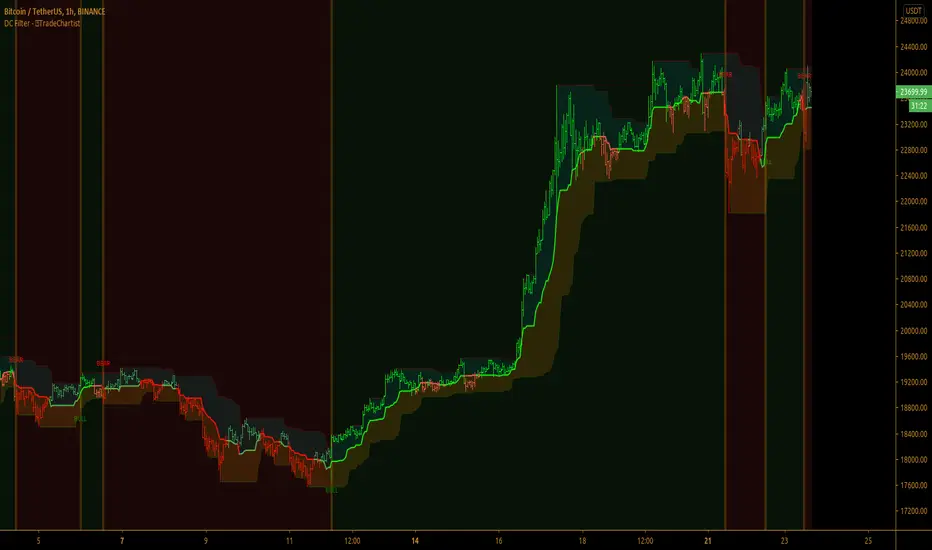
TradeChartist Donchian Channels Breakout Filter™TradeChartist Donchian Channels Breakout Filter is an elegant version of the classic Donchian Channels with few extra variations and option to filter breakouts based on user preferred Breakout price selection to generate Trade Entries.
===================================================================================================================
Features of ™TradeChartist Donchian Channels Breakout Filter
======================================================
Option to plot Donchian Channels of user preferred length, based on the Source price in addition to High/Low Donchian Channels.
Generates trade entries based on user preferred Breakout Price. For example, if the user prefers HL2 as breakout price, irrespective of the Donchian Channels type, trade entries are generated only when hl2 price (average of high/low) breaks out of the upper or lower band.
Option to plot background colour based on Breakout trend. The bull zones are filled with green background, the Bear zones are filled with red background and the bar that broke out is filled with orange background.
Option to colour price bars using Donchian Channels price trend. The Donchian Channels basis line is plotted using the same colours as coloured bars as default.
Alerts can be created for long and short entries using Once per Bar Close .
Note: This script does not repaint . To use the script for trade entries, wait for the bar close and use a second confirmator (includes fundamentals) based on asset type as some markets require users to have good pulse on the fundamentals as trading by Technicals/price action dynamic alone may not be safe.
===================================================================================================================
Best Practice: Test with different settings first using Paper Trades before trading with real money
===================================================================================================================
This is not a free to use indicator. Get in touch with me (PM me directly if you would like trial access to test the indicator)
Premium Scripts - Trial access and Information
Trial access offered on all Premium scripts.
PM me directly to request trial access to the scripts or for more information.
===================================================================================================================
Fearzone & Greedzone Levels - Contrarian & Breakout (Expo)"Be fearful when others are greedy, and greedy when others are fearful" - Warren Buffett. Fearzone & Greedzone Levels - Contrarian & Breakout (Expo) is a contrarian and breakout indicator that gives us an indication when fear and greed begins to take over in the market. Traders should be prepared for increased volatility and good trading opportunities.
This indicator can both be used to identify potential reversal points and be used to identify breakouts from previous Fear and Greed Levels.
The Fearzone and Greedzone can be visualized with candlesticks or with circles depending on what you prefer.
Alert conditions are added.
HOW TO USE
1. Use the indicator to identify when investors are fearful and greedy.
2. Use the indicator to identify potential reversal points.
3. Use the indicator to identify potential breakouts.
INDICATOR IN ACTION
4 hour chart
4 hour chart
I hope you find this indicator useful , and please comment or contact me if you like the script or have any questions/suggestions for future improvements. Thanks!
I will continually work on this indicator, so please share your experience and feedback as it will enable me to make even better improvements. Thanks to everyone that has already contacted me regarding my scripts. Your feedback is valuable for future developments!
-----------------
Disclaimer
Copyright by Zeiierman.
The information contained in my scripts/indicators/ideas does not constitute financial advice or a solicitation to buy or sell any securities of any type. I will not accept liability for any loss or damage, including without limitation any loss of profit, which may arise directly or indirectly from the use of or reliance on such information.
All investments involve risk, and the past performance of a security, industry, sector, market, financial product, trading strategy, or individual’s trading does not guarantee future results or returns. Investors are fully responsible for any investment decisions they make. Such decisions should be based solely on an evaluation of their financial circumstances, investment objectives, risk tolerance, and liquidity needs.
My scripts/indicators/ideas are only for educational purposes!

Trend Following BreakoutEasy Trend Following Strategy using Highs and Lows breakout of the last X candles to enter and exit trades.
You can easily change the ENTRY and EXIT value in order to find the best settings.
This strategy seems to be working well for $BTC and $ETH on the 4H and 1D.
I didn't play with it too much as I am testing script to trade on the 15 minutes chart with margin. This script can't do this successfully but I hope it can be helpful for what you want to achieve.


Universal Breakout Strategy [KedArc Quant]Description:
A flexible breakout framework where you can test different logics (Prev Day, Bollinger, Volume, ATR, EMA Trend, RSI Confirm, Candle Confirm, Time Filter) under one system.
Choose your breakout mode, and the strategy will handle entries, exits, and optional risk management (ATR stops, take-profits, daily loss guard, cooldowns).
An on-chart info table shows live mode values (like Prev High/Low, Bollinger levels, RSI, etc.) plus P&L stats for quick analysis.
Use it to compare which breakout style works best on your instrument and timeframe, whether intraday, swing, or positional trading
🔑 Why it’s useful
* Flexibility: Switch between breakout strategies without loading different indicators.
* Clarity: On-chart info table displays current mode, relevant indicator levels, and live strategy P&L stats.
* Testing efficiency: Quickly A/B test different breakout styles under the same backtest environment.
* Transparency: Every trade is rule-based and displayed with entry/exit markers.
🚀 How it helps traders
* Lets you experiment with breakout strategies quickly without loading multiple scripts.
* Helps identify which breakout method fits your instrument & timeframe.
* Gives clear on-chart visual + statistical feedback for confident decision-making.
⚙️ Input Configuration
* Breakout Mode → choose which strategy to test:
* *Prev Day* → breakouts of yesterday’s High/Low.
* *Bollinger* → Upper/Lower BB pierce.
* *Volume* → Breakout confirmed with volume above average.
* *ATR Stop* → Wide range breakout using ATR filter.
* *Time Filter* → Breakouts inside defined session hours.
* *EMA Trend* → Breakouts only in EMA fast > slow alignment.
* *RSI Confirm* → Breakouts with RSI confirmation (e.g. >55 for longs).
* *Candle Confirm* → Breakouts validated by bullish/bearish candle.
* Lookback / ATR / Bollinger inputs → adjust sensitivity.
* Intrabar mode → option to evaluate breakouts using bar highs/lows instead of closes.
* Table options → show/hide info table, show/hide P&L stats, choose corner placement.
📈 Entry & Exit Logic
* Entry → occurs when breakout condition of chosen mode is met.
* Exit → default exits via opposite signals or optional stop/target if enabled.
* Session filter → optional auto-flat at session end.
* P&L management → optional daily loss guard, cooldown between trades, and ATR-based stop/take profit.
❓ FAQ — Choosing the best setup
Q: Which strategy should I use for which chart?
* *Prev Day Breakouts*: Best on indices, FX, and liquid futures with strong daily levels.
* *Bollinger*: Works well in range-bound environments, or crypto pairs with volatility compression.
* *Volume*: Good on equities where breakout strength is tied to volume spikes.
* *ATR Stop*: Suits volatile instruments (commodities, crypto).
* *EMA Trend*: Useful in trending markets (stocks, indices).
* *RSI Confirm*: Adds momentum filter, better for swing trades.
* *Candle Confirm*: Ideal for scalpers needing visual confirmation.
* *Time Filter*: For intraday traders who want signals only in high-liquidity sessions.
Q: What timeframe should I use?
* Intraday traders → 5m to 15m (Time Filter, Candle Confirm).
* Swing traders → 1H to 4H (EMA Trend, RSI Confirm, ATR Stop).
* Position traders → Daily (Prev Day, Bollinger).
* Breakout
A trade entry condition triggered when price crosses above a resistance level (for longs) or below a support level (for shorts).
* Prev Day High/Low
Formula:
Prev High = High of (Day )
Prev Low = Low of (Day )
* Bollinger Bands
Formula:
Basis = SMA(Close, Length)
Upper Band = Basis + (Multiplier × StdDev(Close, Length))
Lower Band = Basis – (Multiplier × StdDev(Close, Length))
* Volume Confirmation
A breakout is only valid if:
Volume > SMA(Volume, Length)
* ATR (Average True Range)
Measures volatility.
Formula:
ATR = SMA(True Range, Length)
where True Range = max(High–Low, |High–Close |, |Low–Close |)
* EMA (Exponential Moving Average)
Weighted moving average giving more weight to recent prices.
Formula:
EMA = (Price × α) + (EMA × (1–α))
with α = 2 / (Length + 1)
* RSI (Relative Strength Index)
Momentum oscillator scaled 0–100.
Formula:
RSI = 100 – (100 / (1 + RS))
where RS = Avg(Gain, Length) ÷ Avg(Loss, Length)
* Candle Confirmation
Bullish candle: Close > Open AND Close > Close
Bearish candle: Close < Open AND Close < Close
Win Rate (%)
Formula:
Win Rate = (Winning Trades ÷ Total Trades) × 100
* Average Trade P&L
Formula:
Avg Trade = Net Profit ÷ Total Trades
📊 Performance Notes
The Universal Breakout Strategy is designed as a framework rather than a single-asset optimized system. Results will vary depending on the chart, timeframe, and asset chosen.
On the current defaults (15-minute, INR-denominated example), the backtest produced 132 trades over the selected period. This provides a statistically sufficient sample size.
Win rate (~35%) is relatively low, but this is balanced by a positive reward-to-risk ratio (~1.8). In practice, a lower win rate with larger wins versus smaller losses is sustainable.
The average P&L per trade is close to breakeven under default settings. This is expected, as the strategy is not tuned for a single symbol but offered as a universal breakout framework.
Commissions (0.1%) and slippage (1 tick) are included in the simulation, ensuring realistic conditions.
Risk management is conservative, with order sizing set at 1 unit per trade. This avoids over-leveraging and keeps exposure well under the 5-10% equity risk guideline.
👉 Traders are encouraged to:
Experiment with inputs such as ATR period, breakout length, or Bollinger parameters.
Test across different timeframes and instruments (equities, futures, forex, crypto) to find optimal setups.
Combine with filters (trend direction, volatility regimes, or volume conditions) for further refinement.
⚠️ Disclaimer This script is provided for educational purposes only.
Past performance does not guarantee future results.
Trading involves risk, and users should exercise caution and use proper risk management when applying this strategy.

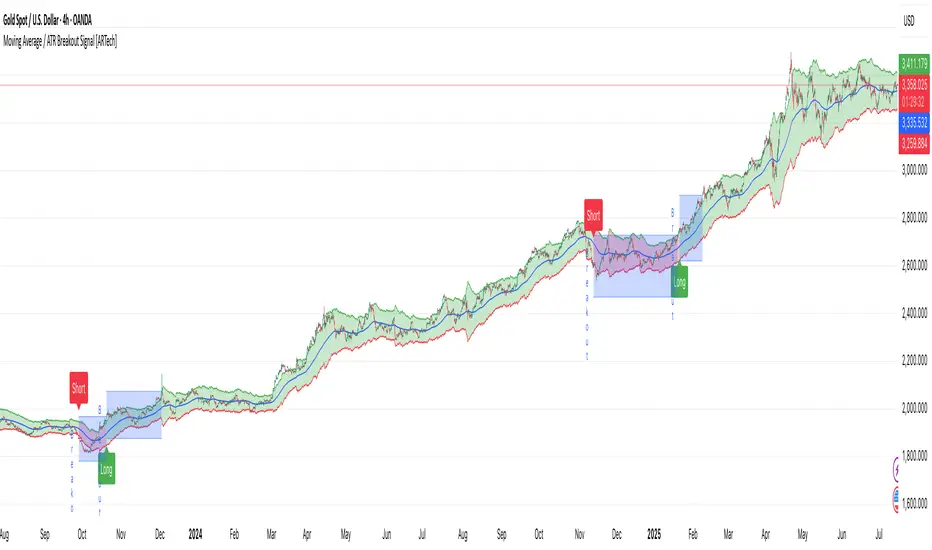
Moving Average / ATR Breakout Signal [ARTech]Moving Average / ATR Breakout Signal
This indicator generates trend-following signals based on price breaking above or below a user-defined Moving Average (MA). It supports various MA types and lengths, while offering optional filters like ATR bands and breakout thresholds to enhance signal quality. The tool is designed to help traders detect momentum shifts with configurable confirmation logic and offers visual enhancements to help traders better interpret market conditions at a glance.
Key Features:
• Multi-Type Moving Average Support: Choose from various Moving Average types including EMA, SMA, Hull MA, VWMA, RMA, TEMA, and more — fully customizable with source and length options.
• Flexible Signal Logic: Signals are generated when price breaks above or below the selected MA. You can define the number of confirmation candles and choose between wick-based or close-based break logic.
• ATR-Based Filtering: Enable ATR filtering to create dynamic upper and lower breakout bands around the MA. This helps reduce noise and validate true breakouts with volatility-adjusted thresholds.
• Breakout Threshold Filtering: Add an optional breakout condition where the price must first move a minimum percentage away from the previous signal level before a new opposite signal is allowed. Prevents choppy back-to-back signals.
• Visual Enhancements: Color-coded backgrounds highlight long and short zones, adapting dynamically to signal context. Optional MA slope coloring further supports trend visualization.
• Signal Alerts: Customizable alerts for long and short signals, including user-defined messages, to keep you notified in real-time.
Why use this indicator?
• Helps you identify clear trend shifts by focusing on price action relative to a customizable moving average.
• Improves signal reliability with optional ATR filtering and breakout confirmation, reducing false signals.
• Flexible MA types and lengths let you tailor the indicator to your trading style.
• Suitable for traders of all levels looking for a straightforward, yet powerful trend-following tool.
How to Use
███████ Alerts ███████
• Custom Alerts: To enable Custom Alerts, you need to activate the fx alert() function call option in TradingView’s alert creation dialog. Then, select the desired alert type (Long or Short) from the indicator's settings under the "Alerts" section, you can customize messages and enable notifications for Long and Short signals.
Using Custom Alerts allows you to set up one alert that covers both Long and Short signals, simplifying your alert management.
• Long and Short Alerts: To create Long or Short alerts, open the alert dialog, select this indicator as the condition, then choose “Long” or “Short” from the list and click Create.
You need to set up two separate alerts: one for Long signals and one for Short signals.
███████ Moving Average ███████
This is the core component of the signal system. You can customize:
Moving Average Type: Choose from SMA, EMA, WMA, Hull MA, VWMA, RMA, or TEMA
Length: Adjust the length to suit your strategy.
Source: Select which price data (e.g., Close, Open, HL2) is used to calculate the MA.
Show Slope Color: Colors the MA line based on its direction: upward slopes are shown in the selected "Up" color, while downward slopes use the "Down" color. This helps you visually confirm trend direction at a glance.
Show Background Color: When enabled, highlights the area between the MA and price to enhance signal zones:
– If ATR filter is on, the space between ATR bands is shaded.
– If ATR filter is off, the area between the MA line and bar closes is colored.
This helps emphasize potential breakout or trend-following zones visually.
███████ Break Options ███████
Confirm Candles: Defines the number of consecutive candles that must break the selected level to confirm a signal.
– If ATR filter is enabled, this level is the ATR bands.
– If ATR is disabled, the Moving Average line is used.
This helps filter out noise and avoid premature signals.
Break Type: Specifies how the candle must break the level:
– Close: The candle must close beyond the level.
– Wick: A wick touching or exceeding the level is enough.
Choose based on how strict you want the breakout condition to be.
███████ Filters ███████
This section provides optional filters to improve signal accuracy:
ATR
When enabled, breakout confirmation requires the price to cross above the upper breakout line or below the lower breakout line by a specified percentage from the last signal price.
• Multiplier: Adjusts the width of ATR bands by multiplying the ATR value.
• Length: Sets the period for ATR calculation.
• Smoothing: Selects the smoothing method applied to the ATR (RMA, SMA, EMA, WMA).
• Upper and Lower Line Colors: Customize the colors of the ATR bands.
Breakout Filter
When enabled, breakout confirmation requires the price to cross above the upper breakout line or below the lower breakout line by a specified percentage from the last signal price.
• Threshold (%): Defines the minimum percentage price movement required to validate a breakout.
• Show Breakout Levels: Toggle to display or hide breakout threshold area on the chart.
Fractal Breakout Trend Following System█ OVERVIEW
The Fractal Breakout Trend Following System is a custom technical analysis tool designed to pinpoint significant fractal pivot points and breakout levels. By analyzing price action through configurable pivot parameters, this indicator dynamically identifies key support and resistance zones. It not only marks crucial highs and lows on the chart but also signals potential trend reversals through real-time breakout detections, helping traders capture shifts in market momentum.
█ KEY FEATURES
Fractal Pivot Detection
Utilizes user-defined left and right pivot lengths to detect local highs (pivot highs) and lows (pivot lows). This fractal-based approach ensures that only meaningful price moves are considered, effectively filtering out minor market noise.
Dynamic Line Visualization
Upon confirmation of a pivot, the system draws a dynamic line representing resistance (from pivot highs) or support (from pivot lows). These lines extend across the chart until a breakout occurs, offering a continuous visual guide to key levels.
Trend Breakout Signals
Monitors for price crossovers relative to the drawn pivot lines. A crossover above a resistance line signals a bullish breakout, while a crossunder below a support line indicates a bearish move, thus updating the prevailing trend.
Pivot Labelling
Assigns labels such as "HH", "LH", "LL", or "HL" to detected pivots based on their relative values.
It uses the following designations:
HH (Higher High) : Indicates that the current pivot high is greater than the previous pivot high, suggesting continued upward momentum.
LH (Lower High) : Signals that the current pivot high is lower than the previous pivot high, which may hint at a potential reversal within an uptrend.
LL (Lower Low) : Shows that the current pivot low is lower than the previous pivot low, confirming sustained downward pressure.
HL (Higher Low) : Reveals that the current pivot low is higher than the previous pivot low, potentially indicating the beginning of an upward reversal in a downtrend.
These labels provide traders with immediate insight into the market structure and recent price behavior.
Customizable Visual Settings
Offers various customization options:
• Adjust pivot sensitivity via left/right pivot inputs.
• Toggle pivot labels on or off.
• Enable background color changes to reflect bullish or bearish trends.
• Choose preferred colors for bullish (e.g., green) and bearish (e.g., red) signals.
█ UNDERLYING METHODOLOGY & CALCULATIONS
Fractal Pivot Calculation
The script employs a sliding window technique using configurable left and right parameters to identify local highs and lows. Detected pivot values are sanitized to ensure consistency in subsequent calculations.
Dynamic Line Plotting
When a new pivot is detected, a corresponding line is drawn from the pivot point. This line extends until the price breaks the level, at which point it is reset. This method provides a continuous reference for support and resistance.
Trend Breakout Identification
By continuously monitoring price interactions with the pivot lines, the indicator identifies breakouts. A price crossover above a resistance line suggests a bullish breakout, while a crossunder below a support line indicates a bearish shift. The current trend is updated accordingly.
Pivot Label Assignment
The system compares the current pivot with the previous one to determine if the move represents a higher high, lower high, higher low, or lower low. This classification helps traders understand the underlying market momentum.
█ HOW TO USE THE INDICATOR
1 — Apply the Indicator
• Add the Fractal Breakout Trend Following System to your chart to begin visualizing dynamic pivot points and breakout signals.
2 — Adjust Settings for Your Market
• Pivot Detection – Configure the left and right pivot lengths for both highs and lows to suit your desired sensitivity:
- Use shorter lengths for more responsive signals in fast-moving markets.
- Use longer lengths to filter out minor fluctuations in volatile conditions.
• Visual Customization – Toggle the display of pivot labels and background color changes. Select your preferred colors for bullish and bearish trends.
3 — Interpret the Signals
• Support & Resistance Lines – Observe the dynamically drawn lines that represent key pivot levels.
• Pivot Labels – Look for labels like "HH", "LH", "LL", and "HL" to quickly assess market structure and trend behavior.
• Trend Signals – Watch for price crossovers and corresponding background color shifts to gauge bullish or bearish breakouts.
4 — Integrate with Your Trading Strategy
• Use the identified pivot points as potential support and resistance levels.
• Combine breakout signals with other technical indicators for comprehensive trade confirmation.
• Adjust the sensitivity settings to tailor the indicator to various instruments and market conditions.
█ CONCLUSION
The Fractal Breakout Trend Following System offers a robust framework for identifying critical fractal pivot points and potential breakout opportunities. With its dynamic line plotting, clear pivot labeling, and customizable visual settings, this indicator equips traders with actionable insights to enhance decision-making and optimize entry and exit strategies.

Session Breakout Scalper Trading BotHi Traders !
Introduction:
I have recently been exploring the world of automated algorithmic trading (as I prefer more objective trading strategies over subjective technical analysis (TA)) and would like to share one of my automation compatible (PineConnecter compatible) scripts “Session Breakout Scalper”.
The strategy is really simple and is based on time conditional breakouts although has more ”relatively” advanced optional features such as the regime indicators (Regime Filters) that attempt to filter out noise by adding more confluence states and the ATR multiple SL that takes into account volatility to mitigate the down side risk of the trade.
What is Algorthmic Trading:
Firstly what is algorithmic trading? Algorithmic trading also known as algo-trading, is a method of using computer programs (in this case pine script) to execute trades based on predetermined rules and instructions (this trading strategy). It's like having a robot trader who follows a strict set of commands to buy and sell assets automatically, without any human intervention.
Important Note:
For Algorithmic trading the strategy will require you having an essential TV subscription at the minimum (so that you can set alerts) plus a PineConnecter subscription (scroll down to the .”How does the strategy send signals” headings to read more)
The Strategy Explained:
Is the Time input true ? (this can be changed by toggling times under the “TRADE MEDIAN TIMES” group for user inputs).
Given the above is true the strategy waits x bars after the session and then calculates the highest high (HH) to lowest low (LL) range. For this box to form, the user defined amount of bars must print after the session. The box is symmetrical meaning the HH and LL are calculated over a lookback that is equal to the sum of user defined bars before and after the session (+ 1).
The Strategy then simultaneously defines the HH as the buy level (green line) and the LL as the sell level (red line). note the strategy will set stop orders at these levels respectively.
Enter a buy if price action crosses above the HH, and then cancel the sell order type (The opposite is true for a stop order).
If the momentum based regime filters are true the strategy will check for the regime / regimes to be true, if the regime if false the strategy will exit the current trade, as the regime filter has predicted a slowing / reversal of momentum.
The image below shows the strategy executing these trading rules ( Regime filters, "Trades on chart", "Signal & Label" and "Quantity" have been omitted. "Strategy label plots" has been switched to true)
Other Strategy Rules:
If a new session (time session which is user defined) is true (blue vertical line) and the strategy is currently still in a trade it will exit that trade immediately.
It is possible to also set a range of percentage gain per day that the strategy will try to acquire, if at any point the strategy’s profit is within the percentage range then the position / trade will be exited immediately (This can be changed in the “PERCENT DAY GAIN” group for user inputs)
Stops and Targets:
The strategy has either static (fixed) or variable SL options. TP however is only static. The “STRAT TP & TP” group of user inputs is responsible for the SL and TP values (quoted in pips). Note once the ATR stop is set to true the SL values in the above group no longer have any affect on the SL as expected.
What are the Regime Filters:
The Larry Williams Large Trade Index (LWLTI): The Larry Williams Large Trade Index (LWTI) is a momentum-based technical indicator developed by iconic trader Larry Williams. It identifies potential entries and exits for trades by gauging market sentiment, particularly the buying and selling pressure from large market players. Here's a breakdown of the LWTI:
LWLTI components and their interpretation:
Oscillator: It oscillates between 0 and 100, with 50 acting as the neutral line.
Sentiment Meter: Values above 75 suggest a bearish market dominated by large selling, while readings below 25 indicate a bullish market with strong buying from large players.
Trend Confirmation: Crossing above 75 during an uptrend and below 25 during a downtrend confirms the trend's continuation.
The Andean Oscillator (AO) : The Andean Oscillator is a trend and momentum based indicator designed to measure the degree of variations within individual uptrends and downtrends in the prices.
Regime Filter States:
In trading, a regime filter is a tool used to identify the current state or "regime" of the market.
These Regime filters are integrated within the trading strategy to attempt to lower risk (equity volatility and/or draw down). The regime filters have different states for each market order type (buy and sell). When the regime filters are set to true, if these regime states fail to be true the trade is exited immediately.
For Buy Trades:
LWLTI positive momentum state: Quotient of the lagged trailing difference and the ATR > 50
AO positive momentum state: Bull line > Bear line (signal line is omitted)
For Sell Trades:
LWLTI negative momentum stat: Quotient of the lagged trailing difference and the ATR < 50
AO negative momentum state: Bull line < Bear line (signal line is omitted)
How does the Strategy Send Signals:
The strategy triggers a TV alert (you will neet to set a alert first), TV then sends a HTTP request to the automation software (PineConnecter) which receives the request and then communicates to an MT4/5 EA to automate the trading strategy.
For the strategy to send signals you must have the following
At least a TV essential subscription
This Script added to your chart
A PineConnecter account, which is paid and not free. This will provide you with the expert advisor that executes trades based on these strategies signals.
For more detailed information on the automation process I would recommend you read the PineConnecter documentation and FAQ page.
Dashboard:
This Dashboard (top right by defualt) lists some simple trading statistics and also shows when a trade is live.
Important Notice:
- USE THIS STRATEGY AT YOUR OWN RISK AND ALWAYS DO YOUR OWN RESEARCH & MANUAL BACKTESTING !
- THE STRATEGY WILL NOT EXHIBIT THE BACKTEST PERFORMANCE SEEN BELOW IN ALL MARKETS !

Session Breakout/Sweep with alertsThis indicator is based on popular London breakout strategy. but as I noticed that it don't work good with breakouts so I made it to be used as reversal entries as well. By default the timing is set for asian session but you can change it according to your need.
Use as breakout
Use as liquidity sweep
Note:
On some pairs the timing changes automatically (I don't know why), if you face this issue , go to settings and set the timing accordingly and save it as templet so that you don't have to change it every time you load the chart with timing issue.
I hope you guys find it useful. Do share your though and feedback in comments.

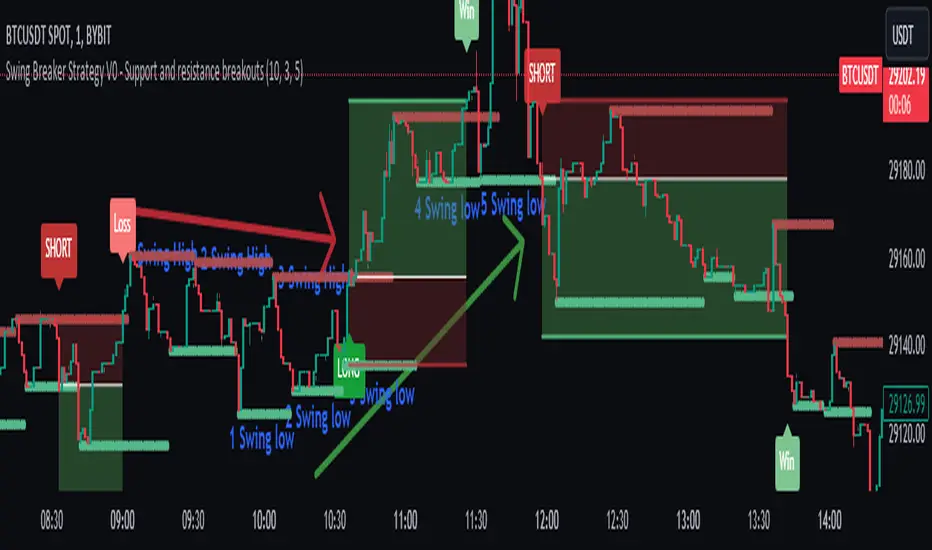
Swing Breaker Strategy [v0.1] - Support and resistance breakoutSwing Breaker Strategy - Support and Resistance Breakouts
This strategy has no repainting.
Default settings:
Swing Barsback: 10
Number of Swings: 3
Stoploss Candles Lookback: 5
Why these default settings?
This strategy has been backtested with over 100 trades, and on a larger scale of 1000 trades, it has reported a 1.33 profit factor with a maximum 5% cumulative drawdown, using no leverage. In this backtest, the settings (10,3,5) were used, becoming the default settings as they are more adaptable to different market conditions.
How does this strategy work?
Defining swing lows (support) and swing highs (resistance): We can locate these candles by looking at a symmetrical candle unit around them. For example, the default settings present a 10 swing bars back, which means there is no superior level within a 10-candle radius in the case of a swing high, and the opposite for a swing low. Swings are located a few candles after, just the number of swing bars back (width), because it is needed to ensure it is a swing.
Locating trends: We locate trends by looking at consecutive swings. For example, in the default settings, to determine a bullish trend, we need 3 consecutive ascending swing lows; for a bearish trend, 3 consecutive descending swing highs. You can find this parameter in settings as "Number of swings."
When a trend is formed, a stop entry is placed at the last swing until it is broken.
Just after the entry, the stop is placed at the lowest (in the case of a long) or the highest (in the case of a short) of the last candles. You can define that number in the settings as "Stoploss candles lookback," which default is 5. The take profit is placed at 2 times the stop value, resulting in a 2 risk-reward ratio.
Why is this strategy protected?
No other strategy combines the way of locating swings and turning it into a strategy, including customizable parameters such as stop loss, swing width and introducing the number of swings. That's why we decided to protect it.
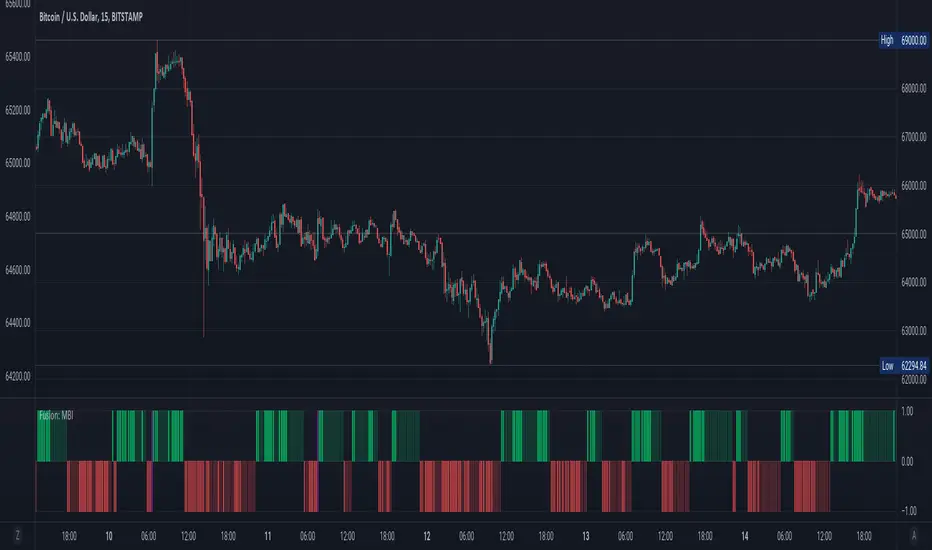
Fusion: Monster Breakout IndexThis indicator is designed to display on both the main chart and a separate chart area. If you want to display it on the main chart then flip the 4 display options. Well... you might want to:
Disable it first
Move it
Flip the display options
and then show it so the move doesn't look ugly.
Display options:
On a separate chart it will display red and lime bars showning potential breakouts.
On the main chart it will show a channel.
Personally like to see it both ways so I generally have two copies of it with one on the main chart.
The " Bar back marker " option is a tiny down arrow at the top of the chart showing where the length of the lookback starts from the current bar. So, if you set the length to 10 then this will be 10 bars back from the current bar. You can show it on or off the main chart but it's not all that visually tasteful off the main chart.
The length is certainly not some optimized setting so set to whatever suits your needs.
The source I set at hl2 which makes more sense to me than the default most people use of close so again, don't assume the settings are correct for your environment... play with it.
Credit:
Modified from the "Monster Breakout Index" by racer8 under the licence of: This source code is subject to the terms of the Mozilla Public License 2.0 at mozilla.org
The code is structured to easily drop into a bigger system so use it as a lone indicator or add the code to some bigger project you are creating. If you do, send me a note, it would be nice to know it's being well used.
Finally, if you find value please do make a comment, give a thumbs up etc.
Enjoy and good luck!