Search in scripts for "breakout"
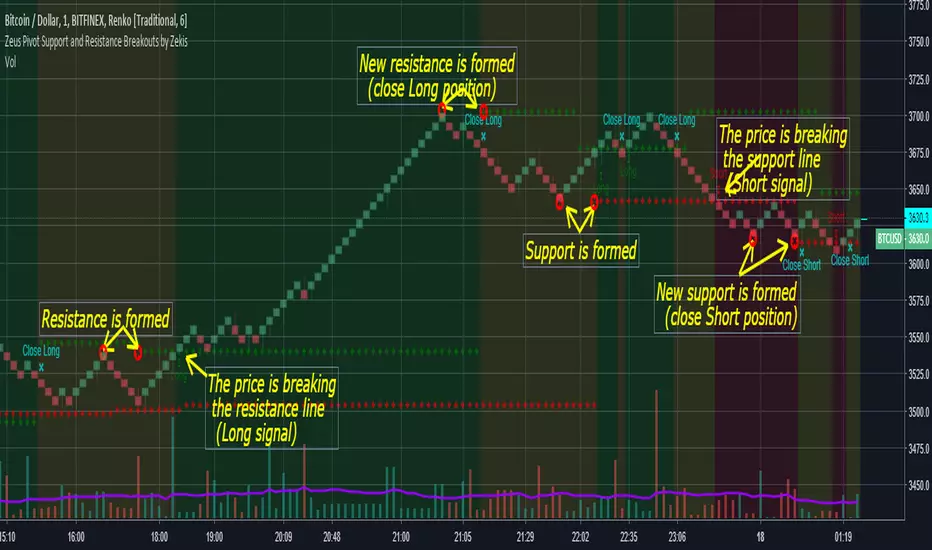
Zeus Pivot Points Support and Resistance Breakouts by ZekisZeus Pivot Support and Resistance Breakouts by Zekis
Is an indicator with big results, it forms new support /resistance according to the last higher high or lower low (it prints new ones only if it breaks through the last one)
Rules:
- enter Long or Short when the support or resistance is craked
- exit when new support or resistance is starts to form
Alerts for entries and exits
A moving average is added to filter signals (leave it at 1 for price close signals)
Bar colors can be added to see longs, shorts or no position
Background colors for longs, shorts or no position
Enjoy!
@Zekis
ORB Pro - NY Opening Range Breakout [Elev8+]**ORB Pro - NY Opening Range Breakout ** is a comprehensive, professional-grade toolkit designed for intraday traders who rely on the **Opening Range Breakout (ORB)** strategy.
Unlike standard ORB indicators that simply draw lines, this suite offers a complete dashboard-driven system that monitors **four distinct sessions** simultaneously, providing real-time status updates and precision alerts.
### 🎯 What is the Opening Range Breakout (ORB)?
The Opening Range is the price range established during the first period of the trading session (e.g., the first 15 or 30 minutes). This period represents the initial balance between buyers and sellers. A breakout from this range often signals the likely trend direction for the remainder of the session.
### 🚀 Key Features
**1. Multi-ORB Monitoring**
Stop switching settings constantly. This suite monitors four key ranges at once:
* **Pre-Market 15m** (08:00 – 08:15 ET)
* **Pre-Market 30m** (08:00 – 08:30 ET)
* **NY Cash Open 15m** (09:30 – 09:45 ET)
* **NY Cash Open 30m** (09:30 – 10:00 ET)
**2. Smart Status Dashboard**
A compact panel in the bottom-right corner gives you the live state of every session:
* **⏳ Waiting:** The session has not started yet.
* **⚡ Forming:** The range is currently being built.
* **↔️ Range:** The range has formed, but price is still contained within the range.
* **🚀 BULL / 📉 BEAR:** A confirmed breakout has occurred.
* **⛔ OFF:** The session is disabled in settings.
**3. "Dynamic Resolution" Technology**
This is a unique pro feature.
* **Precision:** The script *always* calculates the High/Low levels using 1-minute data, ensuring your support/resistance lines are pixel-perfect regardless of your chart timeframe.
* **Flexibility:** Breakout signals (Alerts/Labels) are triggered based on your *current* chart timeframe. This allows you to trade a 5m or 15m breakout strategy while keeping 1m-level precision on your levels.
**4. Visual Clarity**
* **Breakout Labels:** Automatically plots "BULL" or "BEAR" labels on the exact candle that confirms a breakout.
* **Profit Targets:** Optional toggle to show 1x and 2x profit targets projected from the breakout level.
* **Time-Bound Signals:** Signals are strictly time-bound to the active window to prevent late, low-quality alerts.
### 🛠️ How to Use
1. **Add to Chart:** Works best on intraday timeframes (1m, 5m, 15m).
2. **Configure:** Enable the sessions you trade (e.g., NY 15m) in the settings.
3. **Wait for Forming:** Watch the box form live. The dashboard will show "⚡ Forming".
4. **Trade the Break:** Wait for a candle **Close** outside the range. The dashboard will flip to "BULL" or "BEAR" and a label will appear.
5. **Manage Risk:** Use the opposite side of the range or the midline as your stop loss.
### ⚙️ Settings Overview
* **Global Settings:** Toggle forming boxes, dashboard, and label visibility.
* **Breakout Method:** Choose between **Close** (safer) or **Wick** (aggressive) for signal triggers.
* **Session Groups:** Individually enable/disable the 4 distinct sessions and customize their colors/styles.
---
*Disclaimer: This tool is for educational and analytical purposes only. Past performance of a strategy does not guarantee future results. Always manage your risk.*

ATR ZigZag BreakoutATR ZigZag Breakout
This strategy uses my ATR ZigZag indicator (powered by the ZigZagCore library) to scalp breakouts at volatility-filtered highs and lows.
Everyone knows stops cluster around clear swing highs and lows. Breakout traders often pile in there, too. These levels are predictable areas where aggressive orders hit the tape. The idea here is simple:
→ Let ATR ZigZag define clean, volatility-filtered pivots
→ Arm a stop market order at those pivots
→ Join the breakout when the crowd hits the level
The key to greater success in this simple strategy lies in the ZigZag. Because the pivots are filtered by ATR instead of fixed bar counts or fractals, the levels tend to be more meaningful and less noisy.
This approach is especially suited for intraday trading on volatile instruments (e.g., NQ, GC, liquid crypto pairs).
How It Works
1. Pivot detection
The ATR ZigZag uses an ATR-based threshold to confirm swing highs and lows. Only when price has moved far enough in the opposite direction does a pivot become “official.”
2. Candidate breakout level
When a new swing direction is detected and the most recent high/low has not yet been broken in the current leg, the strategy arms a stop market order at that pivot.
• Long candidate → most recent swing high
• Short candidate → most recent swing low
These “candidate trades” are shown as dotted lines.
3. Entry, SL, and TP
If price breaks through the level, the stop order is filled and a bracket is placed:
• Stop loss = ATR × SL multiplier
• Take profit = SL distance × RR multiplier
Once a level has traded, it is not reused in the same swing leg.
4. Cancel & rotate
If the market reverses and forms a new swing in the opposite direction before the level is hit, the pending order is cancelled and a new candidate is considered in the new direction.
Additional Features
• Optional session filter for backtesting specific trading hours

Moving Average Channel Breakout (No Repaint) This indicator creates a channel using two simple moving averages: SMA of highs (upper line) and SMA of lows (lower line).
How it works:
- When a candle closes above the upper channel line, the following candles turn green (bullish trend)
- When a candle closes below the lower channel line, the following candles turn red (bearish trend)
- The trend color remains until a breakout in the opposite direction occurs
Anti-repaint:
This indicator does NOT repaint. The candle color is determined at the open, based on the previous candle's close. Once a candle opens with a color, that color never changes.
Breakout strategy:
- Candle opens green → Long entry signal
- Candle opens red → Short entry signal
The signal and entry moment are perfectly synchronized at the candle open, making it ideal for systematic breakout strategies.

Structure Breakout - Buy Sell IndicatorStructure Breakout - Buy Sell Indicator
📈 OVERVIEW:
A minimalist indicator that identifies market structure breakouts using swing point analysis.
Displays clear blue buy arrows and red sell arrows when price breaks key swing levels.
🔧 HOW IT WORKS:
1. Identifies swing highs and lows using configurable lookback period
2. Triggers BUY signal (blue arrow) when price closes above previous swing high
3. Triggers SELL signal (red arrow) when price closes below previous swing low
4. Uses clean visual arrows without cluttering the chart
⚙️ KEY FEATURES:
• Clean, uncluttered visual signals
• Customizable sensitivity period
• Blue arrows for buy signals (below bars)
• Red arrows for sell signals (above bars)
• No lagging repainting
• Works on all timeframes
🎯 TRADING APPLICATIONS:
• Swing trading entries
• Breakout confirmation
• Trend continuation signals
• Support/resistance breaks
⚡ SETTINGS:
• Structure Detection Period (default: 20) - Adjust sensitivity of swing detection
⚠️ RISK DISCLAIMER:
This is an educational tool. Always use proper risk management.
Past performance does not guarantee future results.

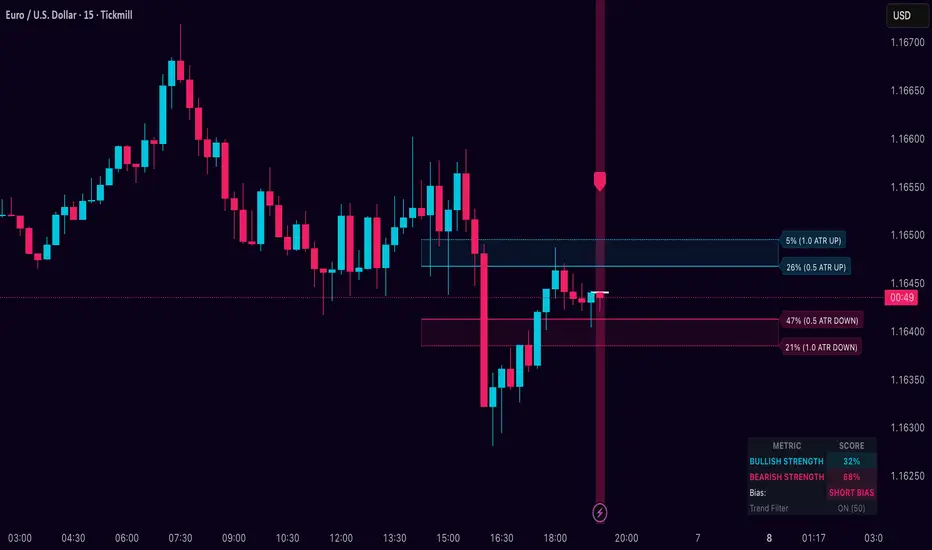
Dynamic Breakout Odds [RayAlgo]█ OVERVIEW
Dynamic Breakout Odds is a probability-based breakout tool that uses ATR and pattern matching to estimate how likely price is to expand up or down from the current candle.
Instead of guessing, the indicator scans historical candles that look like the current one and measures how often price broke above or below by a volatility-based amount.
It then projects those probabilities forward as clean levels and a bias dashboard on your chart.
Use it to quickly answer:
• “Is the next move statistically more likely up or down?”
• “How far does price typically travel from here, in ATR terms?”
█ CONCEPTS
Candle Profile Matching
The script builds a “profile” of the current setup using two elements:
• The color of the previous candle (bullish close vs bearish close)
• The trend environment (above/below EMA, if the filter is enabled)
Only historical candles with the same profile are used for statistics. This keeps the probabilities specific to the current context instead of mixing all market conditions together.
ATR-Based Expansion
For every matching historical candle, the script checks how far price moved away from the open using ATR:
• Upward move thresholds
• Moderate expansion (≈ 0.5 ATR above the open)
• Stronger expansion (≈ 1.0 ATR above the open)
• Downward move thresholds
• Moderate expansion (≈ 0.5 ATR below the open)
• Stronger expansion (≈ 1.0 ATR below the open)
It counts how often each expansion happened, then converts those counts into probabilities.
Normalized Probability Scores
The indicator doesn’t just show raw percentages; it normalizes them so that all scenarios together form a consistent probability set.
Internally it tracks four outcomes for similar candles:
• Chance of a moderate move upward
• Chance of a strong move upward
• Chance of a moderate move downward
• Chance of a strong move downward
These are then normalized so the total is roughly 100%. From this, two main metrics are derived:
• Bullish Strength = combined normalized odds of upside moves
• Bearish Strength = combined normalized odds of downside moves
Whichever side has the higher score defines the current directional bias .
█ WHAT YOU SEE ON THE CHART
1. Breakout Projection Levels
Four horizontal levels are projected around the open of the current bar:
• Two upside levels
• Nearer upside expansion (~0.5 ATR above the open)
• Further upside expansion (~1.0 ATR above the open)
• Two downside levels
• Nearer downside expansion (~0.5 ATR below the open)
• Further downside expansion (~1.0 ATR below the open)
Each line extends a configurable number of bars into the future, so you visually see a breakout “corridor” above and below price.
2. Probability Labels
At the right edge of each line, you’ll see a label such as:
• “X% – near upside”
• “Y% – further downside”
These labels tell you how frequently similar candles in the chosen lookback reached that expansion. You immediately know which scenario has been more common historically.
3. Breakout Zones
Between the paired upside lines and the paired downside lines, shaded “probability zones” can be shown:
• The upper shaded band highlights the typical upside expansion range
• The lower shaded band highlights the typical downside expansion range
These zones visually group probable target areas instead of just single lines.
4. Background Tint
The background behind price is softly tinted towards:
• Bullish color when Bullish Strength > Bearish Strength
• Bearish color when Bearish Strength > Bullish Strength
The stronger the statistical imbalance between the two, the more pronounced the tint. This gives you an instant feel for whether conditions lean more Long, more Short, or are nearly Neutral.
5. Directional Bias Arrow
On the last bar the script can plot a clean arrow:
• Up-arrow below price when bullish odds dominate
• Down-arrow above price when bearish odds dominate
The arrow is positioned beyond all projection lines, making it easy to see even on cluttered charts and reminding you of the current statistical bias without text.
6. Origin Marker
A small horizontal mark is drawn at the open of the current candle.
This acts as the “starting point” from which all ATR-based expansions above and below are measured.
7. Dashboard Panel
A compact dashboard is drawn in a corner of the chart (location configurable). It displays:
• Bullish Strength – combined normalized probability for upside expansions
• Bearish Strength – combined normalized probability for downside expansions
• Bias – “Long Bias”, “Short Bias”, or “Neutral”
• Trend Filter – shows whether EMA-based filtering is ON or OFF and which length is used
This gives you a quick, text-based summary of the current statistical environment.
█ SETTINGS
Analysis Lookback Period
• Controls how many historical bars the script inspects when searching for similar candles.
• Larger values = more history, smoother statistics, slower adaptation.
• Smaller values = faster adaptation, but more noise and less stability.
ATR Length
• The period used to compute ATR volatility.
• Defines how “big” 0.5 ATR and 1.0 ATR moves are on your current symbol and timeframe.
Trend Filter (EMA)
• Filter by Trend?
• When ON, only historical candles in a similar trend regime are used.
• When OFF, all past candles with similar color are considered, regardless of trend.
• Trend EMA Length
• EMA period used to classify trend.
• Price above EMA → uptrend environment.
• Price below EMA → downtrend environment.
This filter helps you separate behavior in uptrends from downtrends, which can significantly change breakout dynamics.
Visual Settings
• Projection Width (bars)
• How far the lines and zones extend into the future.
• Show Probability Zones
• Toggle shaded bands between each pair of levels.
• Label Size
• Choose smaller or larger text for the probability labels on the right.
• Tint Background by Bias
• Turn the bias-based background on or off.
• Show Bias Marker on Last Candle
• Toggle the up/down arrow marker.
• Dashboard Location
• Select top/bottom left/right corner for the panel.
█ HOW TO USE IT
1. Start With the Dashboard
Look at Bullish Strength vs Bearish Strength:
• If bullish is clearly larger → environment statistically favors upside expansion.
• If bearish is clearly larger → environment statistically favors downside expansion.
• If they are close → treat the situation as Neutral; consider reducing position size or waiting for more clarity.
2. Use Levels as Dynamic Targets
The projected lines and zones can serve as:
• Profit targets based on typical expansion distance
• Logical regions for scaling out
• Areas where you expect price behavior to change (e.g., loss of momentum)
Short-term traders often focus on the nearer expansion levels, while swing traders may use the farther levels as extended targets.
3. Align With Trend (Optional)
With the trend filter ON:
• Prefer Long setups when price is above the EMA and bullish probabilities dominate.
• Prefer Short setups when price is below the EMA and bearish probabilities dominate.
With the filter OFF, you get pure color-plus-pattern statistics across the whole lookback, which can be useful if you deliberately trade counter-trend or range conditions.
4. Combine With Your Existing System
Dynamic Breakout Odds is best used as a confirmation and targeting layer :
• Combine it with structure (support/resistance, supply/demand, order blocks).
• Combine it with volume or orderflow tools if you use them.
• Use the probability zones to validate whether your planned target is realistic relative to recent volatility.
It is not designed to be a standalone “buy/sell” signal generator, but a statistical map around your entries.
█ PRACTICAL EXAMPLES
Example A – Bullish, Moderate Expansion Frequently Hit
• Bullish Strength significantly higher than Bearish Strength.
• The nearer upside level shows a strong historical hit rate.
Interpretation: similar setups often produce at least a moderate push upward before failing.
Use case: trade pullbacks in the direction of the bias, targeting the nearer upside projection as an initial take-profit.
Example B – Bearish, Deeper Downside Often Reached
• Bearish Strength clearly dominant.
• Both the nearer and farther downside levels show decent probabilities.
Interpretation: similar conditions historically saw follow-through to the downside.
Use case: use rallies against the direction of the bias to position into shorts, planning partial exits around the first downside projection and runners toward the second.
Example C – Neutral, Balanced Probabilities
• Bullish and Bearish Strength scores are close.
• Background tint is very light or absent.
Interpretation: the market is statistically indecisive; expansions up or down are similarly likely.
Use case: consider range trading tactics, mean-reversion ideas, or simply standing aside until a clearer skew develops.
█ BEST PRACTICES
• Use on liquid symbols and reasonable timeframes to avoid distorted ATR behavior.
• Don’t overfit lookback length to a single instrument; test across markets.
• Let the indicator provide context, not absolute certainty.
• Always combine with proper risk management (position sizing, max loss per trade, etc.).
• Be cautious with very small sample sizes (e.g., very short lookbacks on low-volume assets).
█ LIMITATIONS & NOTES
• All probabilities are based on historical behavior ; markets can change regime.
• ATR distances are relative to recent volatility and may shrink/expand over time.
• The script intentionally does not guarantee any direction or target; it only reports what has been most common in similar past situations.
█ DISCLAIMER
This tool is for educational and informational purposes only.
It does not constitute financial advice or a guarantee of performance.
Always do your own research, test on demo or historical data, and use appropriate risk management when trading live capital.
Session Opening Range Breakout (ORBO)This strategy automates a classic Opening Range Breakout (ORBO) approach: it builds a price range for the first minutes after the market opens, then looks for strong breakouts above or below that range to catch early directional moves.
Concept
The idea behind ORBO is simple:
The first minutes after the session open are often highly informative.
Price forms an “opening range” that acts as a mini support/resistance zone.
A clean breakout beyond this zone can lead to high-momentum moves.
This script turns that logic into a fully backtestable strategy in TradingView.
How the strategy works
Opening Range Session
Default session: 09:30–09:50 (exchange time)
During this window, the script tracks:
orHigh → highest high within the session
orLow → lowest low within the session
This forms your Opening Range for the day.
Breakout Logic (after the window ends)
Once the defined session ends:
Long Entry:
If the close crosses above the Opening Range High (orHigh),
→ strategy.entry("OR Long", strategy.long) is triggered.
Short Entry:
If the close crosses below the Opening Range Low (orLow),
→ strategy.entry("OR Short", strategy.short) is triggered.
Only one opening range per day is considered, which keeps the logic clean and easy to interpret.
Daily Reset
At the start of a new trading day, the script resets:
orHigh := na
orLow := na
A fresh Opening Range is then built using the next session’s 09:30–09:50 candles.
This ensures entries are always based on today’s structure, not yesterday’s.
Visuals & Inputs
Inputs:
Opening range session → default: "0930-0950"
Show OR levels → toggle visibility of OR High / Low lines
Fill range body → optional shaded zone between OR High and OR Low
Chart visuals:
A green line marks the Opening Range High.
A red line marks the Opening Range Low.
Optional yellow fill highlights the entire OR zone.
Background shading during the session shows when the range is currently being built.
These visuals make it easy to see:
Where the OR sits relative to current price
How clean / noisy the breakout was
How often price respects or rejects the opening zone
Backtesting & Optimization
Because this is written as a strategy():
You can use TradingView’s Strategy Tester to view:
Win rate
Net profit
Drawdown
Profit factor
Equity curve
Ideas to experiment with:
Change the session window (e.g., 09:15–09:45, 10:00–10:30)
Apply to different:
Markets: indices, FX, crypto, stocks
Timeframes: 1m / 5m / 15m
Add your own:
Stop Loss & Take Profit levels
Time filters (only trade certain days / times)
Volatility filters (e.g., ATR, range size thresholds)
Higher-timeframe trend filter (e.g., only take longs above 200 EMA)

Daniel.Yer Volume Breakout Signal🧠 Summary – Daniel.Yer Volume Breakout Signal
The indicator only works on time frames of minutes.
An indicator that detects high-volume breakouts after the market opens and highlights potential entry zones.
Based on sampling the opening volume window and comparing it to the session’s volume peak.
Visually marks preparation areas (colored background) and plots BUY/SELL triangles for confirmation candles.
Includes real-time alert conditions for leading tickers: SPY, AAPL, MSFT, META, AMD, TSLA, NVDA, PLTR, GOOG, and AMZN.
Optimized for day trading — provides actionable alerts even when the user is offline.

Breakout Volume Momentum [5m]Breakout Volume Momentum Indicator (Pine Script v5)
This TradingView Pine Script v5 indicator plots a green dot below a 5-minute price bar whenever all the breakout and volume conditions are met. It is optimized for live intraday trading (not backtesting) and includes customizable inputs for thresholds and trading session times. Key features and conditions of this indicator:
Gap Up Threshold: Current price is up at least X% (default 20%) from the previous day’s close (uses higher-timeframe daily data) before any signal can trigger.
Relative Volume (RVOL): Current bar’s volume is at least Y× (default 2×) the average volume of the last 20 bars. This ensures unusually high volume is present, indicating strong interest.
Trend Alignment: Price is trading above the VWAP (Volume-Weighted Average Price) and above a fast EMA. In addition, the fast EMA (default 9) is above the slower EMA (default 20) to confirm bullish momentum
tradingview.com
tradingview.com
. These filters ensure the stock is in an intraday uptrend (above the average price and rising EMAs).
Intraday Breakout (optional): Optionally require the price to break above the recent intraday high (default last 30 bars). If enabled, a signal only occurs when the stock exceeds its prior range high, confirming a breakout. This can be toggled on/off in the settings.
Avoid Parabolic Spikes: The script skips any bar with an excessively large range (default >12% from low to high), to avoid triggering on spiky or unsustainable parabolic candles.
Time Window Filter: Signals are restricted to a specific session window (by default 09:30 – 11:00 exchange time, typically the morning session) and will not trigger outside these hours. The session window is adjustable via inputs
stackoverflow.com
.
Alerts: An alert condition is provided so you can set a Trading View alert to send a push notification when a green dot signal fires. The alert message includes the ticker and price at the time of signal.

Screener - Moving Average / ATR Breakout Signal [ARTech]Screener - Moving Average / ATR Breakout Signal
This indicator features a powerful multi-symbol screener that scans up to 40 user-defined symbols in real time for Moving Average (MA) and ATR breakout signals. Users can customize the list of symbols, select the asset class (e.g., Crypto, Stocks, Forex). The screener detects trend-following signals based on price crossing a chosen MA type and length, enhanced by optional ATR-based volatility filters and breakout thresholds to improve signal accuracy. Signals can be displayed on the chart via labels, tooltips, or a compact signal table, allowing traders to monitor multiple markets simultaneously without switching charts. The list of symbols generating signals can also be tracked with customizable alerts, enabling traders to receive real-time notifications for long and short breakout signals directly via TradingView alerts.
This indicator is developed based on the concept of Moving Average / ATR Breakout Signal script on TradingView, with enhancements to support multi-symbol scanning.
Key Features
• Multi-Symbol Screener: Scans up to 40 user-defined symbols simultaneously, with automatic separator detection and symbol validation.
• Repaint Prevention: Carefully designed to avoid repaint issues. The script structure and signal logic have been built to ensure reliable behavior, even across multiple symbols and varying chart conditions.
• Flexible Signal Display: Offers chart labels, tooltips, or a compact table to show signals, enabling multi-market monitoring without switching charts.
• Customizable Alerts: Supports alerts for both long and short signals, sending a list of symbols generating signals as real-time notifications.
• Multi-Type Moving Average Support: Choose from several MA types including EMA, SMA, Hull MA, VWMA, RMA, and TEMA, with customizable source and length settings.
• Flexible Signal Logic: Generates signals when price breaks above or below the selected MA, with options for confirmation candles and wick or close based breakout detection.
• ATR-Based Filtering: Utilizes ATR to create dynamic breakout bands around the MA, reducing noise and improving breakout validation.
• Breakout Threshold Filtering: Adds an optional minimum percentage price move before a new opposite signal is allowed, preventing rapid reversals.
Why use this indicator?
• Scans up to 40 symbols at the same time.
• Users can define the symbol list, asset class, and automatically detects the symbol separator; warns if any symbols are invalid
• Detected signals are shown directly on the chart as labels, tooltips, or in a compact table.
• The list of signal-generating symbols can be tracked with alerts — no need to watch the chart constantly.
How to Use
███████ Alerts ███████
🔸 Long / Short
To enable Custom Alerts, select the desired alert type (Long or Short) from the indicator's settings under the "Alerts" section, you can customize messages and enable notifications for Long and Short signals. Then, you need to activate the fx alert() function call option in TradingView’s alert creation dialog.
Alert messages include your custom message followed by a list of symbols currently giving signals, each shown on a new line. For example, if your input message is set to “🟢 Long Signal” and BTCUSD and ETHUSD are signaling, the alert will look like this:
🟢 Long Signal
BTCUSD
ETHUSD
This format helps you clearly see the type of signal and each symbol individually, making real-time monitoring easier.
🔸 Alert Delay (seconds)
This setting adds a delay before alerts are triggered. It helps ensure that signals are based on confirmed bar closures for slight timing differences between symbol data feeds (especially in multi-symbol mode). For example, setting a 30-second delay allows all symbols to finish processing before the alert fires, avoiding early or incomplete signal lists.
For best results, try different delay values to see what works best with your selected timeframe.
███████ Display / Signal ███████
🔸 Display Mode
Choose how the indicator presents signals on your chart. Focus on a single symbol (Chart mode), Scan and display multiple symbols at once (Screener mode), or hide visuals and use only tables or alerts (No mode).
• Chart Mode: Displays signals only for the current chart symbol. Useful for testing and optimizing signal conditions before scanning multiple assets.
• Screener Mode: Activates the screener functionality, showing results for all valid symbols in your list. Signals appear as labels on the chart and are also listed in the signal table for easy tracking.
• No (Table Only): Hides all on-chart visuals (labels, markers). Signals are still processed and can be viewed in tables or used with alerts. This mode is ideal when you're using multiple screeners at once and want to avoid overlapping visuals. Each screener can display its results in separate table positions (e.g., bottom right, top left, etc.), so turning off chart visuals helps keep your workspace clean while still tracking multiple symbol groups efficiently. This way, you can also track more than 40 symbols by using multiple screener instances with different symbol groups and table positions.
🔸 Long
You can independently turn ON or OFF the display of Long signals using the toggle.
🔸 Short
You can independently turn ON or OFF the display of Short signals using the toggle.
███████ Symbols ███████
🔸 Symbols
You can enter up to 40 symbols. Symbols must be written in full format. For example: BINANCE:BTCUSDT, NASDAQ:AAPL, or OANDA:EURUSD. TradingView requires this full format to correctly recognize each symbol. Due to TradingView’s limitations, only the first 40 symbols in your list will be processed
- Separator Rules: Letters (A–Z), numbers (0–9), underscore (_), dot (.), and exclamation mark (!) are allowed within symbol names (e.g., BINANCE:BTCUSDT.P). Therefore, avoid using them as separators. Instead, use comma (,) , semicolon (;) , space , or newline to separate multiple symbols.
- Auto Detection: The indicator automatically detects the separator used in your list. If the format is incorrect or a symbol is invalid, a warning will appear to help you fix it.
🔸 Symbol Filter
When scanning multiple symbols, it's important that they belong to the same market type (Crypto, Stocks, Forex, etc.). Different markets have different trading hours, and mixing them may cause issues.
For example, if your chart is using a stock symbol (like NASDAQ:AAPL) and your symbol list includes crypto symbols (like BINANCE:BTCUSDT), the screener may not work correctly. Since stock markets are not open 24/7, the chart time may fall outside of crypto trading hours — causing crypto signals to fail or not update properly.
To avoid this issue, the indicator includes a Symbol Filter. This lets you filter your symbol list to include only the correct asset type (e.g., only Crypto or only Stocks). By using this filter, you make sure the screener runs under the correct market conditions and avoids signal mismatches.
If you set the filter to None , no filtering will be applied. In this case, you are responsible for making sure all listed symbols match your chart’s market type.
For best results, always use symbols from the same market type as your chart symbol. This ensures that candle open/close times align across all symbols, avoiding timing mismatches. Symbols and the chart must follow the same market hours for accurate and consistent signal generation.
🔸 Show Symbols on Table
This feature helps you quickly review the symbols you've entered. When enabled, a table appears in the bottom-right corner of the chart displaying all symbols from your list along with their market types and statuses
- Green background: Symbol is valid and matches the selected Symbol Filter. It can generate signals.
- Gray background: Symbol is valid but does not match the selected filter. It will not generate signals.
- Red background: Symbol is invalid (e.g., due to incorrect names, delisting, or unsupported by broker).
You don’t need to remove invalid or mismatched symbols, but no signals will be generated for them. This visual check makes it easier to catch symbol issues before relying on the screener output.
███████ Signal Display Style ███████
🔸 Display Method
Choose how signals will be shown visually
• Label: The signal appears as a label on the candle. The label includes all triggering symbols as text.
• Tooltip: An icon (such as 🟢 or 🔴) is shown instead of full text. Hold your mouse pointer on the icon on chart for a few seconds to see a tooltip listing the triggered symbols. This method keeps your chart cleaner and less cluttered.
• None: No visual markers appear on candles. Signals are only visible in the signal table — ideal if you're using multiple indicators and want to avoid chart clutter.
🔸 Symbol Display Format
This setting affects the labels, tooltips, signal table, and alert messages, ensuring consistency across all displays. Select whether you want symbols to appear as:
• EXCHANGE:SYMBOL: BINANCE:BTCUSDT
• SYMBOL: BTCUSDT
🔸 Long Signal Icon
Used only in Tooltip mode, these icons (e.g., 🟢 for Long) appear on bars where signals are detected. Customize it freely to match your style or strategy.
🔸 Short Signal Icon
Used only in Tooltip mode, these icons (e.g., 🔴 for Short) appear on bars where signals are detected. Customize it freely to match your style or strategy.
🔸 Size
Adjust the visual size of labels or tooltips. Smaller sizes help reduce clutter when many signals trigger in close proximity.
███████ Signal Table ███████
This section controls the appearance and behavior of the signal table that displays last detected Long and Short signals for your symbols.
🔸 Show
Enable or disable the signal table display on the chart.
🔸 Highlight Signal Duration (Bars)
When a signal occurs, the corresponding cell in the table is highlighted using the selected Long or Short color for this many bars. This helps visually track recent signals over time. The bar where the signal icon appears is counted as 1.
🔸 Table Size
Choose the size of the table to fit your chart layout and readability preferences.
🔸 Table Position
Select where the table appears on your chart (e.g., top right, middle right, bottom left).
🔸 Title
Customize the table header text. The default is “Recent Signals”.
🔸 Background Color
Set the table’s background color and transparency to match your chart’s theme.
🔸 Long Signal Color
Choose the highlight color used to mark Long signals within the table.
🔸 Short Signal Color
Choose the highlight color used to mark Short signals within the table.
🔸 Text Color
Customize the text color inside the table for better contrast and readability.
🔸 Show Bars Since Signal
Optionally display how many bars have passed since each signal appeared. The bar where the signal occurs counts as 1.
███████ Signal ███████
This is the core component of the signal system. You can customize:
🔸 Moving Average Type
Choose from SMA, EMA, WMA, Hull MA, VWMA, RMA, or TEMA
🔸 Length
Adjust the length to suit your strategy.
🔸 Source
Select which price data (e.g., Close, Open, HL2) is used to calculate the MA.
🔸 Confirm Candles
Defines the number of consecutive candles that must break the selected level to confirm a signal.
– If ATR filter is enabled, this level is the ATR bands.
– If ATR is disabled, the Moving Average line is used.
This helps filter out noise and avoid premature signals.
🔸 Break Type
Specifies how the candle must break the level:
– Close: The candle must close beyond the level.
– Wick: A wick touching or exceeding the level is enough.
Both options generate signals only after the candle has closed.
🔸 Filter
This section provides optional filters to improve signal accuracy.
ATR
When the ATR filter is enabled, signals are generated only if the price breaks above the upper ATR line or below the lower ATR line—calculated by adding or subtracting the ATR multiplied threshold from the moving average—and the breakout must occur for the number of consecutive confirmation candles specified by the user input . This helps reduce false signals during low volatility periods.
• Multiplier: Adjusts the width of ATR bands by multiplying the ATR value.
• Length: Sets the period for ATR calculation.
• Smoothing: Selects the smoothing method applied to the ATR (RMA, SMA, EMA, WMA).
Breakout
When enabled, breakout confirmation requires the price to cross above the upper breakout line or below the lower breakout line by a specified percentage from the last signal price.
• Threshold (%): Defines the minimum percentage price movement required to validate a breakout.
• Show Breakout Levels: Toggle to display or hide breakout threshold area on the chart.

Opening Range Breakout Detector📈 Opening Range Breakout Detector (TF-Independent)
Tracks breakouts with precision. No matter the chart, no matter the timeframe.
This indicator monitors whether price breaks above or below the Opening Range across multiple key durations — 1m, 5m, 10m, 15m, 30m, 45m, and 60m — using 1-minute data under the hood, while you can work on higher timeframe charts (daily, etc.).
Highlights:
✅ Status table shows which ORs broke UP or DOWN
⏱ Control which timeframes to track
🖼 Customizable table position, size and colors
Crafted by @FunkyQuokka

RTB - Momentum Breakout Strategy V3
📈 RTB - Momentum Breakout Strategy V3 is a directional breakout strategy based on momentum. It combines exponential moving averages (EMAs), RSI, and recent support/resistance levels to detect breakout entries with trend confirmation. The system includes dynamic risk management using ATR-based stop-loss and trailing stop levels. Webhook alerts are supported for external automated trading integrations.
🔎 The strategy was backtested using default parameters on BTCUSDT Futures (Bybit) with 4-hour timeframe and a 0.05% commission per trade.
⚠️ This script is for educational purposes only and does not constitute financial advice. Always do your own research before trading.

Katalyst's Opening Range BreakoutKatalyst's Opening Range Breakout + No Trade Zone
📜 Overview:
This indicator allows traders to visualize the high and low of the opening range for a user-selected timeframe (e.g., 30s, 1m, 5m, 15m). It features fully customizable lines, labels, and an optional **No Trade Zone** fill to help you identify breakout levels with ease.
---
🎯 Key Features:
1. **Customizable Opening Range**:
- Select your preferred opening range duration: **30 seconds, 1 minute, 2 minutes, 5 minutes, 10 minutes, or 15 minutes**.
- The indicator calculates and plots the **high** and **low** of the selected opening range.
2. **Dynamic Line Styling**:
- Choose the **line color**, **transparency**, and **style**: **Solid, Dashed, or Dotted**.
- Lines extend to the right of the chart for clarity.
3. **No Trade Zone** *(Optional / Disabled by default)*:
- When enabled, fills the area between the high and low lines with a customizable **color and transparency**.
- Helps visually identify consolidation areas where trading might be avoided.
4. **Labels for Precision**:
- Clearly displays the **Opening Range High** and **Low** values.
- Labels are color-coded and positioned dynamically for easy interpretation.
5. **Clean and Efficient Updates**:
- The indicator deletes old lines, labels, and fills before creating new ones, ensuring a clutter-free chart.
---
⚙️ How to Use:
1. **Select Your Timeframe**:
- From the settings, choose your desired opening range duration: 30s, 1m, 2m, 5m, 10m, or 15m.
2. **Customize the Visuals**:
- Adjust line color, style, and transparency.
- Enable the **No Trade Zone** for a transparent background fill between the high and low lines.
3. **Interpret the Breakout**:
- Watch for price movements above or below the **opening range** to identify potential breakout opportunities.
---
🛠 Settings:
Opening Range Duration: Select the timeframe for the opening range (30s, 1m, 2m, 5m, 10m, 15m).
Line Color: Set the color of the range lines.
Line Transparency: Adjust the transparency of the lines (0 = solid, 100 = invisible).
Line Style: Choose line style: Solid, Dashed, or Dotted.
Label Colors: Customize the label colors for the high and low values.
Enable No Trade Zone: Fill the area between high and low lines with a transparent color.
No Trade Zone Color: Set the fill color for the no trade zone.
No Trade Zone Transparency: Adjust the transparency of the no trade zone fill.
---
📈 Ideal For
Day traders and scalpers looking to trade **breakouts**.
Traders who want to identify areas of consolidation visually.
Anyone who relies on the **opening range** for their trading strategy.
---
🔍 Example Usage:
Set the opening range to **5 minutes** and enable the **No Trade Zone** with a light red fill.
Watch for price to break above or below the high/low lines to signal potential trade opportunities.
---
✨ Why Use This Indicator?
This script simplifies your breakout strategy by providing a clear, visually appealing representation of the opening range. The flexible customization options and the optional **No Trade Zone** make it a powerful tool for identifying high-probability trades.
---
Let me know if you need any additional tweaks or clarifications for this description. It's all set to help traders understand and use your powerful script! 🚀📈

Advanced Volume-Driven Breakout SignalsThe "Advanced Volume-Driven Breakout Signals" indicator is a cutting-edge tool designed to help traders identify high-potential trading opportunities through sophisticated volume analysis techniques. This indicator integrates volume flow analysis, moving averages, and Relative Volume (RVOL) to provide a comprehensive view of market conditions, going beyond traditional Volume Spread Analysis (VSA) methods.
Key Features:
Volume Flow Analysis: Distinguishes bullish and bearish volume flows with distinct colors, making it easier to visualize market sentiment and potential breakout points.
Volume Flow Moving Averages: Calculates moving averages for volume using various methods (SMA, EMA, WMA, HMA, VWMA), accommodating different trading strategies. This includes settings for adjusting the type of moving average and its period, as well as thresholds for high, medium, and low volume levels.
Volume Spikes Detection: Identifies significant volume spikes based on user-defined multipliers and moving averages, highlighting unusual trading activity.
Volume MA Cloud Settings: Computes general moving averages of volume to track trends and detect deviations. This feature includes options to select different moving average types and adjust thresholds for detecting high volume activity.
Relative Volume (RVOL): Measures current volume relative to historical averages, triggering signals when RVOL exceeds predefined thresholds, indicating notable changes in trading activity.
Entry Conditions: Provides clear long and short entry signals based on combined volume flow conditions and RVOL, offering actionable trading opportunities.
Volume Visualization:
— Bullish Volume Flow: Light and dark green bars indicate bullish volume flow.
— Bearish Volume Flow: Light and dark red bars denote bearish volume flow.
— High Volume Bars: Highlighted in yellow, and extreme volume bars in orange for additional context. These bars are plotted for visual aid and do not directly influence trade signals, focusing instead on the quality and strength of the volume flow.
Alerts: Allows users to create alert notifications for long and short entry signals when the criteria are met, enabling traders to respond promptly to trading opportunities.
Usage:
Overlay: Apply the indicator directly to your price chart to visualise real-time signals and volume conditions.
Customisable: Adjust settings for moving averages, RVOL, and other parameters to match your trading strategy and preferences.
Comparison to VSA Scripts: The "Advanced Volume-Driven Breakout Signals" indicator extends beyond traditional VSA scripts by incorporating a wider range of analytical features. While VSA primarily focuses on volume spread patterns and price action, this indicator offers enhanced functionality with advanced RVOL metrics, customizable moving averages, and detailed volume spike detection, making it a more versatile tool for identifying breakout opportunities and managing trades. It is particularly effective when used alongside key levels and order blocks.
Acknowledgements: Special thanks to @oh92 and @goofoffgoose for their invaluable scripts, which served as inspiration in the development of this advanced trading indicator.
Notes: The script is continually evolving, with ongoing refinements aimed at enhancing accuracy and performance.

VWAP Bollinger Band Crossover Breakout with ResistanceCredit to © Jesus_Salvatierra for VWAP script
This script help you find a trend in momentum stock that is about to breakout and shows resistance point. This script utilizes Bollinger bands VWAP and is good for intra day charts.
VWAP, or Volume Weighted Average Price, is a technical analysis tool used to measure the average price a security trades at during a given time period, weighted by the trading volume for each price level. It is commonly used by traders and investors to identify the true average price of a security and to assess whether they are buying or selling at a fair price.
A Bollinger Band is a technical analysis tool that uses standard deviation to measure the volatility of a security. The Bollinger Band is typically composed of three lines: the upper band, the lower band, and the middle band. The middle band is a simple moving average of the security's price, while the upper and lower bands are calculated based on the standard deviation of the security's price.
A Bollinger Band crossover occurs when the price of a security crosses above or below one of the bands. When the price crosses above the upper band, it is considered overbought, while when it crosses below the lower band, it is considered oversold. Traders often use Bollinger Band crossovers as a signal to enter or exit a position, depending on their trading strategy.
The VWAP and Bollinger Band crossover are two separate technical analysis tools that can be used in conjunction with each other. When a security's price crosses above or below the Bollinger Band, traders may look to the VWAP to confirm whether the security is trading at a fair price. If the security is trading above the VWAP, it may be overvalued, while if it is trading below the VWAP, it may be undervalued. Similarly, traders may use the Bollinger Band crossover as a signal to enter or exit a position, while also taking into account the VWAP to assess whether the price is fair.

Fractal BreakoutThis indicator prints channels based on Williams Fractals creating an upper and a lower channel. Breakouts of these channels are marked as buy or sell signal including the respective alerts. Furthermore the indicator includes a Moving Average which can be toggled on to be used as a trendfilter (buy above, sell below).

[Excalibur] Pivoted Automatic Breakout Trend LinesPREAMBLE:
As I will elaborate further, lines and linearity are everywhere in the our thoughts, words, objects, and nature. For example, in our youth, drawing lines on paper, ascribing them in the dirt, and using them to perfect hand writing is common occurrences in life everyone has experienced. Our minds are uniquely adaptable to envision linearities in many natural or abstract objects, including facial geometry. That's how we easily recognize each other in person. For decades, along our path on roadways to and from our destinations, road lines have long safely guided us. Common phrases are "get in line", "walk the line", "line of duty", and "finish line" in English. Gazing upon the earth's line of horizon on calm wide open ocean standing upon the shoreline, it is easily visible and it has curvature. Sorry to break it to you flat earthers.
Multitudes of agreed upon lines define nationally recognized boundaries on maps for very specific reasons. Some lines are just simply not meant to be crossed and are purposefully intended to be respected. Even at the time of this original release, lines are being "crossed" on unimaginable and tragic scales, forming a trend of devastation of lives and livelihoods. On occasion in human history, border lines have to be redefined, especially when a godvernment no longer represents the WILL of a vast geographic majority of it's citizens. When puppet representatives and misleaders only have a self serving interest to put their citizens most treasured values, grievances, and souls in the grave, succession is a matter of last resort and it's often statistically speaking 101% necessary.
As an American, from my opinionated perspective assessing the situation, I welcome the ancestral people of Donetsk and Luhansk to the world stage, being independent to choose their own destinies and fates, because all that Ukraine wishes to do with them year, after year, after year is render them as subjugates or use them for target practice. And that isn't right! The way 2021+ is heading, by the year 2100 I suspect every continental map is going to have new lines on them.
LINES OF ANTIQUITY:
Many recorded instances throughout history detailing the use of lines, has endured centuries of time. The ancient origins and study of "Euclidean geometry" would have been performed scribbling in the ground, preferably in sand. The Greek mathematician Euclid of Alexandria, the founder of geometry, most probably spent a great deal of his life doing this in order to pass his bold ideas onto future generations.
Before Euclid's time, Spartans in the battle of Thermopylae drew their lines in the sand with their swords adhering to the infamous words "Molon Labe" (come and take ). These disciples of agoge, born and destined for rigorous entrainment were bound by duty, no retreat, no surrender. Hundreds of Spartan sigma males held the line for as long as they could for the security of their free peoples. In almost every case of Spartan history the imperative notion of holding the battle lines was absolutely necessary at all costs, regardless of the carnage delivered from their enemy adversaries, including the unrelenting hordes of invasion commanded by the tyrant Xerxes. ALL gave some on those days.
Over two millennia later, Colonel William Travis at the Alamo carved a line in the ground for able men to decide which side of history they would reside on. History has an awfully bad habit of repeating itself, as it is always told in forewarnment. Lines have always been pertinent, decisive, and always shall be. A world without lines, would make our grasp of understanding and existence nearly impossible to carry on civilization.
LINES IN MODERN TIMES:
The versatility of lines are every where imaginable in this 21st century. A short list of their applications are in art, design, engineering, architecture, demarcation, and they are always, always ever pervasive in computer graphics. Without a doubt, lines are now pinnacle to having the ability to make our charting possible in order to recognize trends. Here in this script's application I intended them to automatically reveal geometry, trends, and breakout zones.
When I originally encountered my discovery of TradingView's existence, the very first thing I was doing, was to naturally draw lines across the price action pivot points in search of identifiable opportunities. Three years later, I have now finalized my vision of automatically drawing an ample amount of them by harnessing the "Power of Pine" in version 5. As you will soon see, utilization of this script will reveal hidden geometry that is otherwise typically unforeseen.
SCRIPT FUNCTIONALITY:
Programmatically drawing lines on top of numeric chaos has been an arduous task, taking me over a year to stabilize this code to my liking. The possibilities of automatically drawing lines on market price action could in theory actually result into hundreds per chart pane. This script does have a limitation of 60 line segments/rays maximum. I have gone to great lengths to accomplish this feat, just to arrive at 60 per overlay indicator. Beyond that, I am experiencing limitations of Pine. Because of the amount of work required to finalize this indicator, this is one of my "Excalibur" indicators. I literally had to pull this code from the deepest recesses of my mind. I would classify this kind of indicator as a weapon of mass financial creation, so I'm offering it's availability to all members.
Segments/rays may be computationally drawn as far back as 5000 bars into the chart's history, but no more than that are to be expected. Only one line will occur from pivot point to pivot point. All duplicate line occurrences computed are not redrawn over another, as I ensured by filtration this would not happen. Numerous adjustments are present to handle a majority of expectations and the numerous visual acuities of members. I envision many thousands of members utilizing this script's versatility as a visual aid to help guide them along their path of trading assessments and decisiveness.
SCRIPT UTILITY:
Having the ability to recognize geometry in price movements is ultra handy in relation to directional trending and channeling arrangements especially. Trends are guaranteed at some unknown point in time to breakout, and form new trends or cycles. I employed a fire and ice color duo to differentiate between the upper trend lines from the lower trend lines. It seemed to be most visible without interfering too often with other indicators. These can be changed to any color combo you desire in Settings. Additional line preferences are provided to support your tailored experience while having other indicators present in the overlay pane. It may even be configured to only display two lines at a minimum. By doing so, you can really focus and fine tune Settings for just these two segments/rays with very specific refined tweaks.
One caveat of detecting pivots, is that they aren't recognized until after they have formed. Always remember that pivot points aren't instantaneously discoverable until their full form is computationally apparent in the form of a chevron. Technically describing the pivot detection is beyond normal comprehension and to difficult to explain in this description. I will also say, viewing this on a 4K display resolution reveals the best view. If you wish to use more than one instance of this indicator in the overlay for more than 60 lines at a time, go right ahead. However it may become messy.
P.S. This script and it's description was partially inspired by Twisted Sister's song "We're Not Gonna Take It"
RISK DISCLAIMER:
My scripts and indicators are specifically intended for informational and educational use only. This script uses historical data points to perform calculations to derive real-time calculations. They do not infer, indicate, or guarantee future results or performance.
By utilizing this script/indicator or any portion of it, you agree to accept 100% responsibly and liability for your investment or financial decisions, and I will not be held liable for your subjective analytic interpretations incurring sustained monetary losses. The opinions and information visual or otherwise provided by this script/indicator is not investment advice, nor does it constitute recommendation.

Volume Bar Breakout and Breakdown IndicatorVolume shows strength of a movement and highest volume shows the region that pushed price to certain extent with full strength. Breakout or Breakout of the highest volume bar range shows continuity further push by sellers or buyers indicating a trend continuation for a small period if not for long duration. Entries can be taken once signal is generated with stoploss as recommended.
Guidelines:
Don't trade if range is too large
Don't trade if Breakdown or Breakdown candle body / range is too large or if there is high volatility
Use additional indicator to get the idea of overall trend analysis

DC Breakout Strategy | This is simplicity at its finest.As the title already describes: this is a Donchian breakout strategy. This strategy, as of now, only goes long. It goes long when the price close makes a new high and the 8 day moving average is above the 32 day moving average. The strategy exits the trade if the price breaks the atr trailing stop of * 3 or the 8 day moving average crosses below the 32 day moving average.
This is simplicity at its finest.

Volume Breakout (ValueRay)Easy visuals on, if volume is way over average. Good for Mean Reverting. Higher Volume tends to higher breakout chances.
Please whisper me for for ideas how to make this better. Its a very simple script, but got some alpha. If you know how to improve, let me know and i will code it into.
Green Line Breakout (GLB) - Public UseNOTE: This is public use - open source version of GLB published by me in Sep 2020. As Trading View is not allow unprotect script already shared, I am sharing it for anyone to use the script and make a copy.
========
This is an implementation of Green Line Breakout ( GLB ) which is popularized by Eric Wish through his Wishing Wealth Blog.
GLB indicator looks at a monthly chart for a stock that hit a new all time high recently and draw a green horizontal line at the highest price reached at any month, that has not been surpassed for at least 3 months.
In other words, this method finds stock that reached an all-time high and has then rested for at least three months. When a stock moves through the green line or is above its last green line, it is an indication of strong buying interest.
Read more about how to use the indicator in Wishing Wealth Blog.
Usage Explanation:
1. Set the time frame to Monthly for a stock and automatically a green dashed line appears based on the calculation explained above
2. If no GLB found for a stock, then green line appears at 0.0
2. If you set any other time frame other than Monthly, no Green Dashed line shown
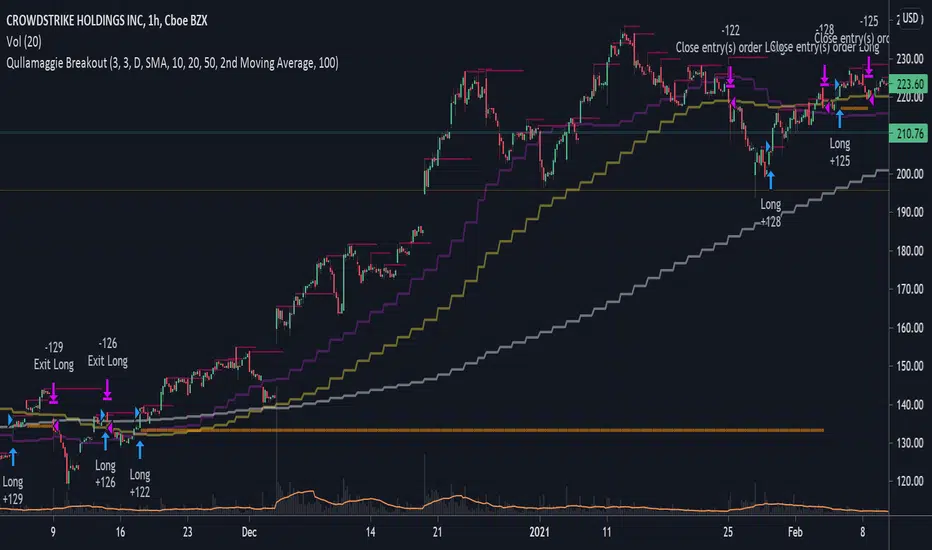
Qullamaggie BreakoutThe intent of this strategy is to buy breakouts with a tight stop on smaller timeframes in the direction of the longer term trend. Default longer term trend is the daily, but the user can choose any timeframe to use for the SMAs (which act as filters and trailing stops).
Exit the trade using a trailing stop of a close below either the 10 MA or 20 MA (user choice) on that larger timeframe as the position moves in your favor (i.e. whenever position price rises above the MA). This is one area where this script could use a little work or some human intervention - when the trade is entered right in the vicinity of the moving averages, you get some whipsaw. Not sure how to avoid that at this point though if you want to look at those longer term moving averages as your exit criteria.
Option of using daily ATR as a measure of finding contracting ranges and ensuring a decent risk/reward. (If the difference between the breakout point and your stop level is below a certain % of ATR, it could possibly find those consolidating periods.)