Dekidaka-Ashi - Candles And Volume Teaming Up (Again)The introduction of candlestick methods for market price data visualization might be one of the most important events in the history of technical analysis, as it totally changed the way to see a trading chart. Candlestick charts are extremely efficient, as they allow the trader to visualize the opening, high, low and closing price (OHLC) each at the same time, something impossible with a traditional line chart. Candlesticks are also cleaner than bars charts and make a more efficient use of space. Japanese peoples are always better than everyone at an incredible amount of stuff, look at what they made, the candlesticks/renko/kagi/heikin-ashi charts, the Ichimoku, manga, ecchi...
However classical candlesticks only include historical market price data, and won't include other type of data such as volume, which is considered by many investors a key information toward effective financial forecasting as volume is an indicator of trading activity. In order to tackle to this problem solutions where proposed, the most common one being to adapt the width of the candle based on the amount of volume, this method is the most commonly accepted one when it comes to visualizing both volume and OHLC data using candlesticks.
Now why proposing an additional tool for volume data visualization ? Because the classical width approach don't provide usable data regarding volume (as the width is directly related to the volume data). Therefore a new trading tool based on candlesticks that allow the trader to gain access to information about the volume is proposed. The approach is based on rescaling the volume directly to the price without the direct use of user settings. We will also see that this tool allow to create support and resistances as well as providing signals based on a breakout methodology.
Dekidaka-Ashi - Kakatte Koi Yo!
"Dekidaka" (出来高) mean "Volume" in a financial context, while "Ashi" (足) mean "leg" or "bar". In general methods based on candlesticks will have "Ashi" in their name.
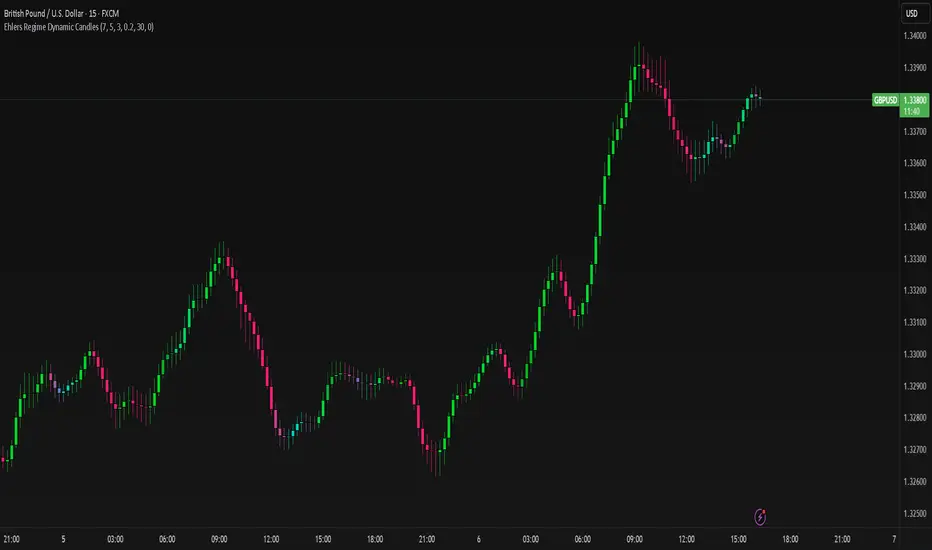
Now that the name of the indicator has been explained lets see how it works, the indicator should be overlayed directly to a candlestick chart. The proposed method don't alter the shape of the candlesticks and allow to visualize any information given by the candles. As you can see on the figure below the candle body of the proposed tool only return the border of the candle, this allow to show the high/low wick of the candle.
The body size of the candle is based on two things : the absolute close/open difference, and the volume, if the absolute close/open difference is high and the volume is high then the body of the candle will be clearly visible, if the volume is high but the absolute close/open difference is low, then the body will be less visible. This approach is used because of the rescaling method used, the volume is divided by the sum between the current volume value and the precedent volume value, this rescale the volume in a (0,1) range, this result is multiplied by the absolute close/open difference and added/subtracted to the high/low price. The original approach was based on normalization using the rolling maximum, but this approach would have led to repainting.
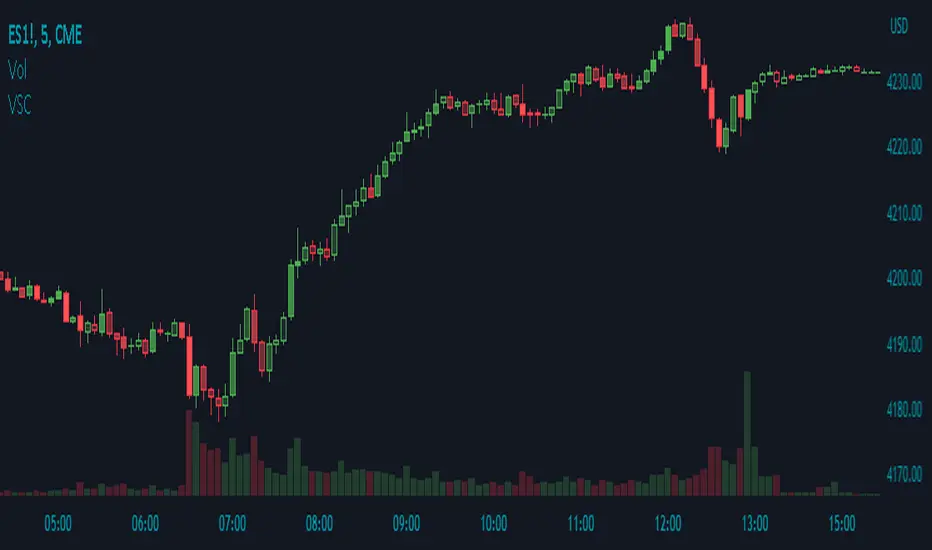
You have access to certain settings that can help you obtain a better visualization, the first one being the body size setting, with higher values increasing the body amplitude.
In green body with size 2, in red with size 1. The smooth parameter will smooth the volume data before being used, this allow to create more visible bodies.
Here smooth = 100.
Making Bands From The Dekidaka-Ashi
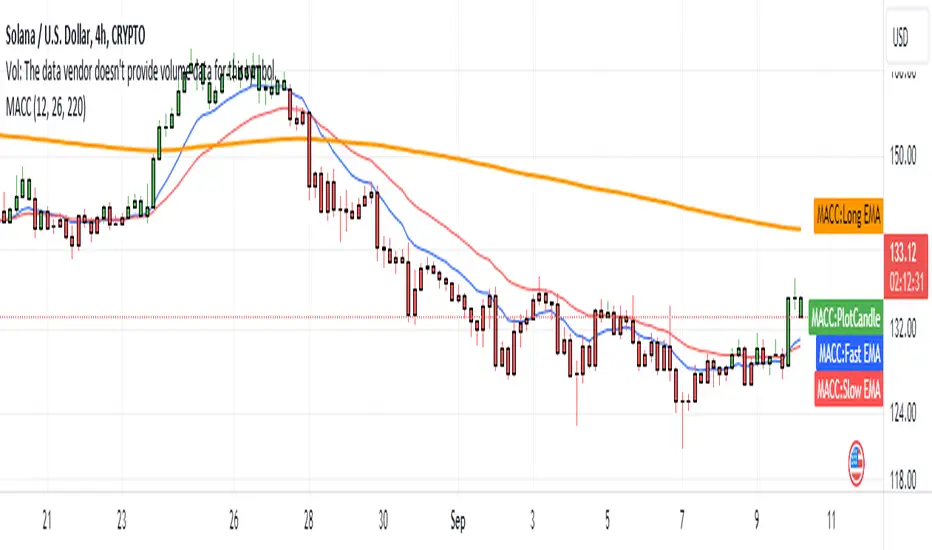
This tool is made so it output two rescaled volume values, with the highest value being denoted as "Dekidaka-high" and the lowest one as "Dekidaka-low". In order to get bands we must use two moving averages, one using the Dekidaka-high as input and the other one using Dekidaka-low, the body size parameter should be fairly high, therefore i will hide the tool as it could cause trouble visualizing the bands.
Bands with both MA's of period 20 and the body size equal to 20. Larger periods of the MA's will require a larger amount of body size.
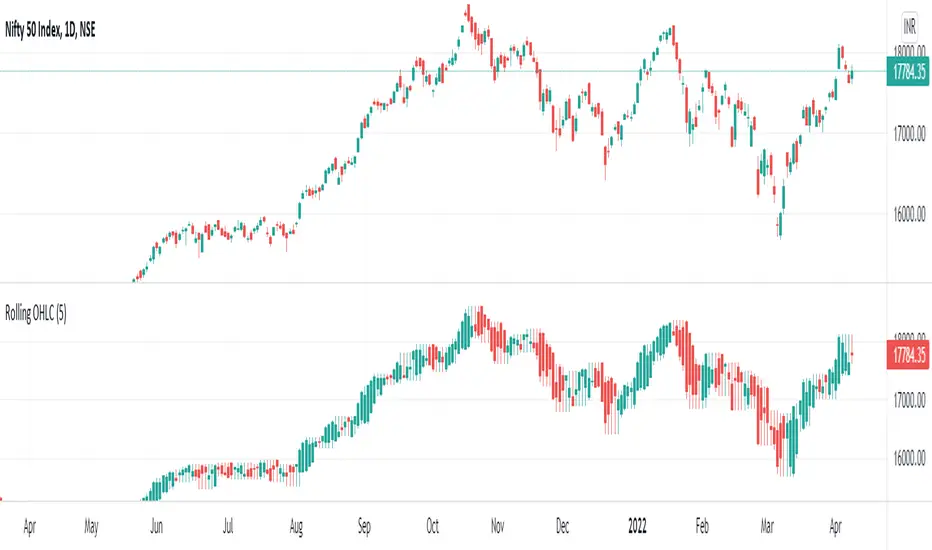
Breakout Signals
There is a wide variety of signals that can be made from candles, ones i personally like comes from the HA candles. The proposed tool is no exception and can produce a wide variety of signals. The signals generated are basic ones based on a breakout methodology, here is each signal with their associated label :
Strong Bullish signal "⇈" : The high price cross the Dekidaka-high and the closing price is greater than the opening price
Strong Bearish signal "⇊" : The low price cross the Dekidaka-low and the closing price is lower than the opening price
Weak Bullish signal "↑" : The high price cross the Dekidaka-high and the closing price is lower than the opening price
Weak Bearish signal "↓" : The low price cross the Dekidaka-low and the closing price is greater than the opening price
Uncertain "↕" : The high price cross the Dekidaka-high and the low price cross the the Dekidaka-low
In order to see the signals on the chart check the "Show signals" option. Note that such signals are not based on an advanced study, and even if they are based on a breakout methodology we can see that volatile movement rarely produce signals, therefore signals mostly occur during low volume/volatility periods, which isn't necessarily a great thing.
Conclusion
A trading tool based on candlesticks that aim to include volume information has been presented and a brief methodology has been introduced. A study of the signals generated is required, however i'am not confident at all on their accuracy, i could work on that in the future. We have also seen how to make bands from the tool.
Candlesticks remain a beautiful charting technique that can provide an enormous amount of information to the trader, and even if the accuracy of patterns based on candlesticks is subject to debates, we can all agree that candlesticks will remain the most widely used type of financial chart.
On a side note i mostly use a dark color for a bullish candle, and a light gray for a bearish candle, with the border color being of the same color as the bullish candle. This is in my opinion the best setup for a candlestick chart, as candles using the traditional green/red can kill the eyes and because this setup allow to apply a wide variety of colors to the plot of overlayed indicators without the fear of causing conflict with the candles color.
Thanks for reading ! :3 Nya
A Word
This morning i received some hateful messages on twitter, the users behind them certainly coming from tradingview, so lets be clear, i know i'am not the most liked person in this community, i know that perfectly, but no one merit to be receive hateful messages. I'am not responsible for the losses of peoples using my indicators, nor is tradingview, using technical indicators does not guarantee long term returns, your ability to be profitable will mostly be based on the quality and quantity of knowledge you have.
Pine Script® indicator