Fibonacci Entry SignalsЭтот индикатор "Fibonacci Entry Signals" помогает определить точки входа в покупку и продажу на основе уровней Фибоначчи и скользящей средней.
Ключевые особенности:
Уровни Фибоначчи: Индикатор рисует на графике несколько уровней Фибоначчи, таких как 38.2%, 50% и 61.8%. Эти уровни определяются на основе крайних точек цены за последние 100 баров. Уровень 0% соответствует самой низкой точке, а уровень 100% - самой высокой.
Точки входа: При наступлении условий входа в покупку или продажу, индикатор отмечает на графике точки входа в виде треугольников вверх или вниз соответственно. Условия входа в покупку определяются, когда цена пересекает уровень Фибоначчи 38.2% вверх и находится выше скользящей средней за последние 50 баров. Условия входа в продажу аналогичны, но цена пересекает уровень Фибоначчи 61.8% вниз.
Этот индикатор может быть полезен для трейдеров, которые используют уровни Фибоначчи в своей торговой стратегии и ищут точки входа в рынок. Однако, перед использованием на реальном счете, рекомендуется провести тщательное тестирование и адаптацию к своим индивидуальным потребностям и стратегии торговли.
Давайте рассмотрим, как пользоваться индикатором "Fibonacci Entry Signals":
Установка на график: Для начала необходимо добавить индикатор на график вашего торгового актива. Вы можете сделать это, выбрав его из списка индикаторов в торговой платформе.
Интерпретация уровней Фибоначчи: Индикатор отображает на графике несколько уровней Фибоначчи, таких как 38.2%, 50% и 61.8%. Понимание этих уровней поможет вам определить возможные точки входа в рынок. Обычно, уровень 38.2% используется как уровень поддержки, а уровень 61.8% - как уровень сопротивления.
Точки входа в покупку и продажу: Индикатор помогает определить моменты, когда можно войти в покупку или продажу. При наступлении условий входа в покупку, индикатор отмечает на графике точку входа в виде зеленого треугольника вверх. При наступлении условий входа в продажу, индикатор отмечает точку входа на графике в виде красного треугольника вниз.
Управление позициями: После получения сигнала от индикатора, решение о входе в позицию остается за вами. Важно помнить, что индикатор является только инструментом, который помогает в принятии решений, и его сигналы всегда следует подтверждать другими аспектами вашей торговой стратегии, такими как подтверждение другими индикаторами или анализ фундаментальных данных.
Тестирование и адаптация: Прежде чем использовать индикатор на реальном счете, рекомендуется провести тщательное тестирование на исторических данных и адаптировать его к своим индивидуальным торговым потребностям и стратегии.
Индикатор "Fibonacci Entry Signals" может быть полезным инструментом для трейдеров, которые используют уровни Фибоначчи в своей торговой стратегии и ищут точки входа в рынок.
his "Fibonacci Entry Signals" indicator helps identify entry points for buying and selling based on Fibonacci levels and moving averages.
Key features:
Fibonacci Levels: The indicator draws several Fibonacci levels on the chart, such as 38.2%, 50%, and 61.8%. These levels are determined based on the extreme price points over the last 100 bars. The 0% level corresponds to the lowest point, and the 100% level corresponds to the highest point.
Entry Points: When conditions for buying or selling occur, the indicator marks entry points on the chart as upward or downward triangles, respectively. Entry conditions for buying are determined when the price crosses above the 38.2% Fibonacci level and remains above the 50-bar moving average. Entry conditions for selling are similar, but the price crosses below the 61.8% Fibonacci level.
This indicator can be useful for traders who use Fibonacci levels in their trading strategy and look for entry points in the market. However, before using it on a real account, it is recommended to conduct thorough testing and adaptation to your individual trading needs and strategy.
Let's look at how to use the "Fibonacci Entry Signals" indicator:
Installation on the Chart: First, you need to add the indicator to the chart of your trading asset. You can do this by selecting it from the list of indicators in the trading platform.
Interpreting Fibonacci Levels: The indicator displays several Fibonacci levels on the chart, such as 38.2%, 50%, and 61.8%. Understanding these levels will help you identify potential entry points in the market. Usually, the 38.2% level is used as support, and the 61.8% level is used as resistance.
Entry Points for Buying and Selling: The indicator helps identify moments when you can enter buying or selling positions. When conditions for buying occur, the indicator marks the entry point on the chart as a green upward triangle. When conditions for selling occur, the indicator marks the entry point on the chart as a red downward triangle.
Position Management: After receiving a signal from the indicator, the decision to enter a position is up to you. It's important to remember that the indicator is just a tool to help you make decisions, and its signals should always be confirmed by other aspects of your trading strategy, such as confirmation from other indicators or fundamental analysis.
Testing and Adaptation: Before using the indicator on a real account, it's recommended to conduct thorough testing on historical data and adapt it to your individual trading needs and strategy.
The "Fibonacci Entry Signals" indicator can be a useful tool for traders who use Fibonacci levels in their trading strategy and look for entry points in the market.
Search in scripts for "entry"
[blackcat] L1 Ichimoku Cloud with Entry SignalsThe Ichimoku Cloud is a technical analysis indicator used to identify potential trend reversals, support and resistance levels, and generate entry and exit signals in financial markets. It was developed by a Japanese journalist named Goichi Hosoda, who went by the pen name Ichimoku Sanjin.
The Ichimoku Cloud consists of several components, including the Tenkan-sen (Conversion Line), Kijun-sen (Base Line), Senkou Span A (Leading Span A), Senkou Span B (Leading Span B), and the Cloud. The Tenkan-sen and Kijun-sen lines are calculated based on the average of the highest high and lowest low over a specific period of time. The Senkou Span A is the average of the Tenkan-sen and Kijun-sen, plotted ahead of the current price. The Senkou Span B is calculated based on the average of the highest high and lowest low over a longer period of time, also plotted ahead of the current price. The Cloud is the area between Senkou Span A and Senkou Span B and is often used to identify potential support and resistance levels.
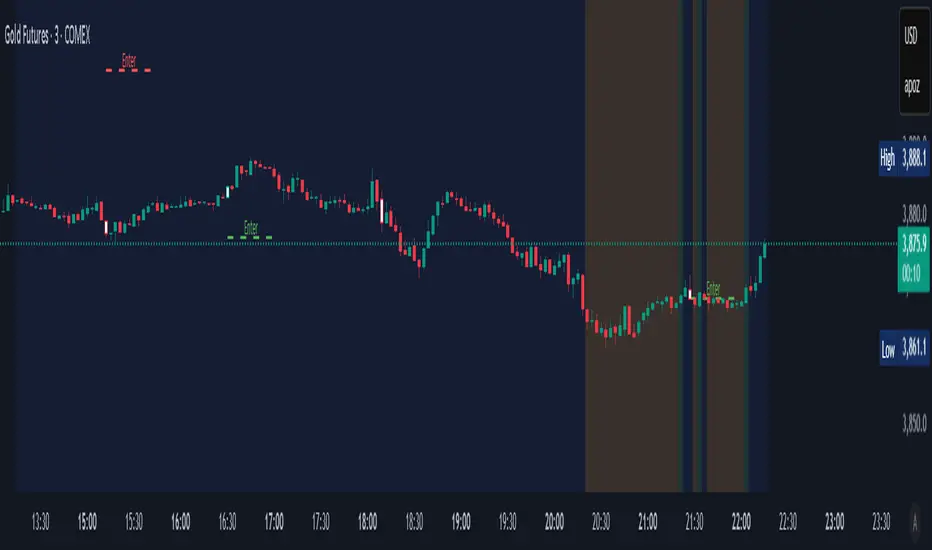
The Ichimoku Cloud with Entry Signals script provided above is a TradingView Pine script that plots the Ichimoku Cloud on a chart, along with entry signals. The entry signals are generated based on the crossover and crossunder of the Tenkan-sen and Kijun-sen lines, as well as the relationship of the closing price with Senkou Span A and Senkou Span B. When the conditions for a long entry signal are met, a green triangle-up shape is plotted below the price bars. Conversely, when the conditions for a short entry signal are met, a red triangle-down shape is plotted above the price bars.
It's important to note that the Ichimoku Cloud is a versatile indicator that can be used in various ways, including identifying trends, determining support and resistance levels, and generating entry and exit signals. Traders and investors often use it in conjunction with other technical analysis tools and indicators to make informed trading decisions.
This piece of code is a TradingView indicator script used to plot Ichimoku Cloud and display entry signals. It is written in Pine Script language.
First, the `indicator` function is used to set the title and short title of the indicator and overlay it on the main chart.
Next, two parameters `tenkanPeriod` and `kijunPeriod` are defined to represent the calculation period of Tenkan-sen (Conversion Line) and Kijun-sen (Base Line) respectively. Then, the `ta.sma` function is used to calculate the values of Tenkan-sen and Kijun-sen, and they are plotted on the chart using the `plot` function.
After that, the value of Senkou Span A (Leading Span A) is calculated using the `math.avg` function, and it is plotted on the chart using the `plot` function. Similarly, the value of Senkou Span B (Leading Span B) is calculated and plotted.
Then, the `fill` function is used to fill the area between Senkou Span A and Senkou Span B with color, forming the cloud.
Finally, entry signals are determined based on certain conditions. If the conditions are met, the `plotshape` function is called to plot arrow shapes at the corresponding positions to represent entry points.
Extreme Entry with Mean Reversion and Trend FilterThis non-repainting indicator is an improved version of my previous work, a more versatile tool designed to provide traders with dynamic and adaptive entry signals while incorporating a mean reversion and trend filtering mechanism. By combining RSI overbought/oversold, regular divergence and confirmatory momentum oscillator such as CCI or MOM, this indicator generates more precise and timely signals for entering trades.
The indicator offers a comprehensive set of entry conditions for both Buy and Sell entries:
• For Buy entries, it checks for oversold conditions based on RSI levels, and detects bullish divergence patterns while oversold and it identifies upward crossovers in the selected entry signal source (CCI or Momentum).
• Similarly, for Sell entries, it identifies downward crossovers of the CCI or Mom, after the recent overbought conditions, and bearish divergence patterns inside the overbought RSI.
To refine the entry signals even further, the indicator utilizes a mean reversion filter. Traders can choose to display signals that occur inside or outside the upper and lower mean reversion bands:
• Range Entries are indicating potential buying opportunities near the lower band and selling opportunities near the upper band. This is based on the concept of mean reversion, which suggests that prices tend to return to the average when they reach the upper or lower bands. By focusing on these signals, traders can take advantage of price movements that have a higher probability of reversing towards the mean.
• Extreme Entries, on the other hand, represent signals that occur outside of the bands, signaling potential pullbacks during strong trends. By entering positions only at extreme highs or lows, traders can avoid getting caught in the middle of the trend. This approach helps traders capitalize more favorable trading opportunities which have a high reward-risk ratio.
Trend Filter acts as a directional bias for the entry signals. When enabled, long and short entry conditions are filtered based on the relationship between the closing price and the EMA.
Traders have the flexibility to customize, tweak the indicator filter and values in the settings according to their preferences strategies and traded assets, tailoring the signals to their specific needs. The script sets alert conditions to trigger alerts for buy, sell, or both entry signals. This indicator can be used in conjunction with price action or other technical analysis tools for confirmation and better trading decisions.
I created this indicator for my own use, and I share this for informational purposes only. It does not constitute financial advice so use at your own risk and consider your financial situation before making any trading decisions. The indicator's accuracy is not guaranteed, and past performance is not indicative of future results.
I appreciate your feedback on this indicator. As I am new to script development, I am open to comments and suggestions to improve it. If you encounter any issues while using this indicator, please let me know in the comments section. If you find it helpful, I kindly ask for your support in boosting it. Thank you for your cooperation.
DIY Entry SignalsThis indicator allows you to set up entry signals based on your own conditions.
Note that this indicator DOES NOT give any information about exits. It is not intended to be a signal indicator that someone could blindly follow. It is intended for use in backtesting to help spot entry points more easily.
Also note that this indicator DOES NOT plot anything other than moving averages and entry signals. The other indicators referenced will need to be added on their own to be visible on the chart.
Credit to The_Caretaker for both BBWP and PMARP indicators. For more information on how those work, see their descriptions. Big thanks to him for making them open source, as well.
Instructions for use:
Signal Types:
This section allows you to choose whether you want long, short, or both types of signals.
Moving Averages:
Configure up to 4 moving averages to be plotted on the chart. Options include show/hide, color, length, and type.
RSI:
Choose the period and source used for the Relative Strength Index indicator, a very commonly used momentum oscillator.
Stochastic:
Choose the K, D, smoothing, and source for the Stochastic indicator, a very commonly used momentum oscillator.
BBWP:
Choose settings for the Bollinger Band Width Percentile indicator. This measures volatility based on Bollinger Bands and was created by The_Caretaker. The indicator is free and open source, so definitely check it out.
This section allows the user to choose the price source, basis type ( SMA , EMA , or VWMA ), length, and lookback. It also includes a threshold setting to determine the BBWP requirement used for entry signals.
PMARP:
Choose settings for the Price Moving Average Ratio & Percentile. This calculates the ratio between a source price and moving average over a lookback period. This was also created by The_Caretaker, and it is a free and open source indicator.
This section allows the user to choose price source, lookback, PMAR length, and moving average type.
DMI/ADX:
Choose settings for the Directional Movement Index and the Average Directional Index. This shows which direction the price is moving by comparing prior highs and lows and calculating a positive directional movement and a negative directional movement. The average of the positive and negative movements is used to plot the ADX line.
Long/Short Conditions:
Choose which indicators will be used to determine entry signals, as well as some options for each indicator that is included.
Note: A signal will only be plotted if ALL selected conditions are met.
Options in these sections include:
Faster moving averages above or below slower moving averages (implying a trend direction)
RSI thresholds (separate for long and short)
Stochastic thresholds (separate for long and short)
Whether K should be above or below D (implying trend direction of the Stochastic indicator)
Whether a signal should only be generated on the bar when the Stochastic first crosses the threshold.
BBWP on/off (The threshold for this is determined in the BBWP section of the settings)
PMARP thresholds (separate for long and short)
Bogdan Ciocoiu - Sniper EntryWhat is Sniper Entry
Sniper Entry is a set indicator that encapsulates a collection of pre-configured scripts using specific variables that enable users to extract signals by interpreting market behaviour quickly, suitable for 1-3min scalping. This instrument is a tool that acts as a confluence for traders to make decisions concerning current market conditions. This indicator does not apply solely to an asset.
What Sniper Entry is not
Sniper Entry is not interpreting fundamental analysis and will also not be providing out of box market signals. Instead, it will provide a collection of integrated and significantly improved open-source subscripts designed to help traders speculate on market trends. Traders must apply their strategies and configure Sniper Entry accordingly to maximise the script's output.
Originality and usefulness
The collection of subscripts encapsulated in this tool makes it unique in the Trading View ecosystem. This indicator enables traders to consider entry positions or exit positions by comparing similar algorithms at once.
Its usefulness also emerges from the unique configurations embedded in the indicator's settings, which are different from those of the original scripts.
This indicator's originality is also reflected in how its modules are integrated, including the integration of the settings.
Open-source reuse
I used the following open-source resources, which I simplified significantly and pre-configured for short term scalping. The source codes for the below are already in the public domain, including the following links listed below.
www.tradingview.com (open source)
(open source and generic algorithm)
www.tradingview.com (open source)
(open source)
(open source)
www.tradingview.com (generic MA algorithm and open source)
(generic VWAP algorithm and open source)
[blackcat] L1 GMMA Long EntryLevel: 1
Background
The Guppy Multiple Moving Average (GMMA) is a technical indicator that identifies changing trends, breakouts, and trading opportunities in the price of an asset by combining two sets of moving averages (MA) with different time periods. There is a short term group of MAs and a long term group of MAs.
Function
L1 GMMA Long Entry classify short-mid term GMMA cluster and long term GMMA cluster with key Fibnocci numbers. Long entry signal is generated with GMMA cluster relationship.
Key Signal
Long entry 1~6 ---> Long entry signal generated with GMMA cluster relationship.
Pros and Cons
Pros:
1. easy observe price trend
2. it covers short, middle and long term trend analysis
Cons:
1. Only long entry signal is disclosed here
2. No complex trading strategy is used yet
Remarks
NA
Readme
In real life, I am a prolific inventor. I have successfully applied for more than 60 international and regional patents in the past 12 years. But in the past two years or so, I have tried to transfer my creativity to the development of trading strategies. Tradingview is the ideal platform for me. I am selecting and contributing some of the hundreds of scripts to publish in Tradingview community. Welcome everyone to interact with me to discuss these interesting pine scripts.
The scripts posted are categorized into 5 levels according to my efforts or manhours put into these works.
Level 1 : interesting script snippets or distinctive improvement from classic indicators or strategy. Level 1 scripts can usually appear in more complex indicators as a function module or element.
Level 2 : composite indicator/strategy. By selecting or combining several independent or dependent functions or sub indicators in proper way, the composite script exhibits a resonance phenomenon which can filter out noise or fake trading signal to enhance trading confidence level.
Level 3 : comprehensive indicator/strategy. They are simple trading systems based on my strategies. They are commonly containing several or all of entry signal, close signal, stop loss, take profit, re-entry, risk management, and position sizing techniques. Even some interesting fundamental and mass psychological aspects are incorporated.
Level 4 : script snippets or functions that do not disclose source code. Interesting element that can reveal market laws and work as raw material for indicators and strategies. If you find Level 1~2 scripts are helpful, Level 4 is a private version that took me far more efforts to develop.
Level 5 : indicator/strategy that do not disclose source code. private version of Level 3 script with my accumulated script processing skills or a large number of custom functions. I had a private function library built in past two years. Level 5 scripts use many of them to achieve private trading strategy.
[blackcat] L1 Banker Entry IndicatorLevel: 1
Background
@testtttt1111 inquired me how to model banker entry
Function
L1 Banker Entry Indicator demostrates a simple model of banker entry for long or short
Key Signal
bankerthreshold ---> customized input for threshold value for banker move identification
pumpdumpsoon ---> alerts for pump or dump start soon in green color
longshortentry ---> alerts for long or short entry in orange color
bankermove ---> alerts for banker move in yellow color
Pros and Cons
Pros:
1. indicating banker move and entries
2. simple classification of banker move alerts
Cons:
1. no direction can be identified
2. no volume information is utilized for big fund move
Remarks
A demo for banker entry inquired by @testtttt1111
Readme
In real life, I am a prolific inventor. I have successfully applied for more than 60 international and regional patents in the past 12 years. But in the past two years or so, I have tried to transfer my creativity to the development of trading strategies. Tradingview is the ideal platform for me. I am selecting and contributing some of the hundreds of scripts to publish in Tradingview community. Welcome everyone to interact with me to discuss these interesting pine scripts.
The scripts posted are categorized into 5 levels according to my efforts or manhours put into these works.
Level 1 : interesting script snippets or distinctive improvement from classic indicators or strategy. Level 1 scripts can usually appear in more complex indicators as a function module or element.
Level 2 : composite indicator/strategy. By selecting or combining several independent or dependent functions or sub indicators in proper way, the composite script exhibits a resonance phenomenon which can filter out noise or fake trading signal to enhance trading confidence level.
Level 3 : comprehensive indicator/strategy. They are simple trading systems based on my strategies. They are commonly containing several or all of entry signal, close signal, stop loss, take profit, re-entry, risk management, and position sizing techniques. Even some interesting fundamental and mass psychological aspects are incorporated.
Level 4 : script snippets or functions that do not disclose source code. Interesting element that can reveal market laws and work as raw material for indicators and strategies. If you find Level 1~2 scripts are helpful, Level 4 is a private version that took me far more efforts to develop.
Level 5 : indicator/strategy that do not disclose source code. private version of Level 3 script with my accumulated script processing skills or a large number of custom functions. I had a private function library built in past two years. Level 5 scripts use many of them to achieve private trading strategy.
L1 Moving Average Fingerprint for Long EntryLevel: 1
Background
This script combines moving average processing with highest high and lowest low to disclose the "fingerprint" of a specific trading pair to describe its unique behavior.
Function
Moving Average Fingerprint for Long Entry is a Level 1 pine script. It utilize several moving average of inherent highest high and lowest low and combine them with customized fingerprint coefficients to depict the unique behavior of a specific trading pair across multiple markets for long entry point identification.
Key Signal
FingerPrint1~6 are basic-level fingerprints with moving average of highest high and lowest low.
FingerPrint7~8 are composite fingerprint definitions with coefficients/weights,where coefficients/weights need to be tuned to discover the inherent "fingerprint" of a specific trading pair.
FingerPrint10~12 are composite fingerprint calculation for long entry alerts
ReadytoLong is a long entry filter where long entry point may happen within it. By using crossover() function to a customized threshold value, you can define accurate long entries.
Pros and Cons
Pros:
1. Combine moving average and extreme points to disclose a trading pair behavior.
2. Smart to tune specific set of parameters to obtain unique fingerprints of trading pairs.
3. Smart position sizing scheme by adjusting the threshold values.
Cons:
1. Require tune input parameters for each trading pair in a specific period and time frame.
2. Only long entry was studied, no short entry and re-entry are available yet to form as a trading system.
3. "ReadytoLong" is an inaccurate range where multiple long entries may happen at improper points in chop market.
4. Complex input parameters to obtain a unique fingerprint set.
Remarks
Although I wrote pine script for more than two years, this is the first script published in the community. I will publish more with my works in this platform.
Hope the community can improve this concept and make it as a trading system.
Readme
In real life, I am a prolific inventor. I have successfully applied for more than 60 international and regional patents in the past 12 years. But in the past two years or so, I have tried to transfer my creativity to the development of trading strategies. Tradingview is the ideal platform for me. I am selecting and contributing some of the hundreds of scripts to publish in Tradingview community. Welcome everyone to interact with me to discuss these interesting pine scripts.
The scripts posted are categorized into 5 levels according to my efforts or manhours put into these works.
Level 1 : interesting script snippets or distinctive improvement from classic indicators or strategy. Level 1 scripts can usually appear in more complex indicators as a function module or element.
Level 2 : composite indicator/strategy. By selecting or combining several independent or dependent functions or sub indicators in proper way, the composite script exhibits a resonance phenomenon which can filter out noise or fake trading signal to enhance trading confidence level.
Level 3 : comprehensive indicator/strategy. They are simple trading systems based on my strategies. They are commonly containing several or all of entry signal, close signal, stop loss, take profit, re-entry, risk management, and position sizing techniques. Even some interesting fundamental and mass psychological aspects are incorporated.
Level 4 : script snippets or functions that do not disclose source code. Interesting element that can reveal market laws and work as raw material for indicators and strategies. If you find Level 1~2 scripts are helpful, Level 4 is a private version that took me far more efforts to develop.
Level 5 : indicator/strategy that do not disclose source code. private version of Level 3 script with my accumulated script processing skills or a large number of custom functions. I had a private function library built in past two years. Level 5 scripts use many of them to achieve private trading strategy.
Magracia Entry-Exit 5 Min Time frame//------------------------------------------------------------------------------------------------------
// 🧭 Indicator Description
//------------------------------------------------------------------------------------------------------
// 📘 Overview:
// This indicator is a modified version of the LuxAlgo pattern logic designed to detect
// high-probability **RBD (Rally–Base–Drop)** and **DBR (Drop–Base–Rally)** reversal structures
// directly on the current candle. It automatically identifies potential BUY and SELL zones,
// plots corresponding trade signals, and dynamically calculates **Take Profit (TP)** and **Stop Loss (SL)** levels.
//
// The goal of this tool is to give clear, visually guided trade entries and exits that
// follow price structure and momentum changes without repainting historical data.
//
//------------------------------------------------------------------------------------------------------
// 🧩 How It Works:
// • **RBD (Rally–Base–Drop)** → Indicates a bearish reversal (SELL signal)
// • **DBR (Drop–Base–Rally)** → Indicates a bullish reversal (BUY signal)
// • Optional **RBR / DBD** continuation patterns can be toggled on for trend continuation setups.
// • When a signal is detected, the script automatically places:
// ▫ A BUY or SELL marker at the candle
// ▫ Dynamic TP (green dotted line) and SL (red dotted line) levels
// ▫ An EXIT marker when either TP or SL is reached
//
//------------------------------------------------------------------------------------------------------
// ⚙️ Inputs:
// • Enable or disable individual pattern types (RBD, RBR, DBD, DBR)
// • Toggle continuation patterns (RBR/DBD)
// • Customize Take Profit and Stop Loss percentages
// • Adjust rally/drop bar colors for easier pattern visualization
//
//------------------------------------------------------------------------------------------------------
// 🧠 Usage Tips:
// • Works best on volatile pairs and short–term timeframes (1m to 15m)
// • Can be combined with volume or trend filters for stronger confirmation
// • When used on higher timeframes (e.g., 4H+), increase TP/SL percentage range
//
//------------------------------------------------------------------------------------------------------
// ⚠️ Notes:
// • Signals are plotted **in real-time on the current candle** (not delayed).
// • This indicator is for visual and educational use only and does not guarantee profitability.
// • For optimal results, combine it with proper risk management and confirmation indicators.
//
//------------------------------------------------------------------------------------------------------
// © Gideon (CC BY-NC-SA 4.0 Licensed)
//------------------------------------------------------------------------------------------------------
Palat Trading System Entry Prices (Bear)This script gives you the entry points for 4,5,6,7 consecutive candles which got up closing vs last trading day.
Palat Trading System Entry Prices (Bull)This script gives you the entry points for 4,5,6,7 consequetive candles which got down closing vs last trading day.
FEI: Futures Entry Identifier📘 FEI: Futures Entry Identifier
FEI is a modular, futures-grade entry engine designed for precision trading across GC1!, MNQ1!, ES1!, and related contracts. It combines manual SVP structure, CHoCH detection, and Colby-style candle strength filters to identify high-probability long and short entries.
🔧 Features
• Manual SVP inputs (VAH, VAL, POC)
• Symbol-aware filters for micro vs standard contracts
• Multi-timeframe signal logic (3m, 5m, 10m, 15m, 30m)
• CHoCH detection with optional engulfing filter (default off)
• FRVP entry zone plotting after CHoCH confirmation
• Candle coloring on CHoCH trigger
• Session-aware logic (ETH default, optional RTH-only)
• Narratable visuals and audit-safe alerts
🧭 How to Use
1. Input VAH, VAL, and POC manually
2. Select signal timeframe (e.g. 3m or 5m)
3. Watch for CHoCH (white candle = structural shift)
4. Entry line plots at top/bottom of recent range
5. Long/short markers appear when SVP + candle strength align
6. Toggle RTH-only mode if needed
🌟 Why It’s Unique
FEI is built for traders who demand clarity, structure, and precision. Every signal is narratable, audit-safe, and resolution-aware—ideal for futures overlays and sniper-grade entries.
ARGT Possible entry and exit points:This is just an observation, and not any type of financial advice.
]To identify key entry and exit points. In addition, this is based on YTD and yearly charts. This is a work in progress.
EMA + MACD Entry Signals (Jason Wang)EMA9、20、200 + MACD(12、26、9) Entry Signals ,严格的设置出入场条件
1.做多的k棒:
• EMA9 > EMA200
• EMA20 > EMA200
• EMA9 > EMA20
• MACD DIF > 0 且 DIF > DEM
• 入场信号:
• DIF 上穿 DEM
• 或 EMA9 上穿 EMA20
2.做空的k棒:
• EMA9 < EMA200
• EMA20 < EMA200
• EMA9 < EMA20
• MACD DIF < 0 且 DIF < DEM
• 入场信号:
• DIF 下穿 DEM
• 或 EMA9 下穿 EMA20
Multi Asset Position Size Calculator (Extended with Entry ModeMulti Asset Position Size Calculator (Extended with Entry Mode
Ultimate Sniper Entry - Pivot PerfectionT2R📌 Description
The Ultimate Sniper Entry – Pivot Perfection is a precision trading tool designed to identify high-probability pivot points and generate early buy/sell entries with strong confirmation. By combining pivot detection, volume spikes, momentum filters (RSI), candle patterns, and EMA trend alignment, this system helps traders capture market reversals and trend continuation setups with improved accuracy.
It offers:
Smart Pivot Detection with adjustable sensitivity.
Multi-layer Confirmation: volume, momentum, candle structure, and EMA trend filter.
Non-Repainting Signals: arrows plotted only after pivot confirmation.
Visual Aids: buy/sell arrows, optional pivot markers, background trend shading.
Alerts: instant notifications for sniper buy/sell entries.
Info Panel: quick reference guide directly on chart.
Ideal for traders who want structured, rules-based entries while avoiding false signals, the Ultimate Sniper Entry system adapts to multiple markets and timeframes.
Multipower Entry SecretMultipower Entry Secret indicator is designed to be the ultimate trading companion for traders of all skill levels—especially those who struggle with decision-making due to unclear or overwhelming signals. Unlike conventional trading systems cluttered with too many lines and confusing alerts, this indicator provides a clear, adaptive, and actionable guide for market entries and exits.
Key Points:
Clear Buy/Sell/Wait Signals:
The script dynamically analyzes price action, candle patterns, volume, trend strength, and higher time frame context. This means it gives you “Buy,” “Sell,” or “Wait” signals based on real, meaningful market information—filtering out the noise and weak trades.
Multi-Timeframe Adaptive Analysis:
It synchronizes signals between higher and current timeframes, ensuring you get the most reliable direction—reducing the risk of getting caught in fake moves or sudden reversals.
Automatic Support, Resistance & Liquidity Zones:
Key levels like support, resistance, and liquidity zones are auto-detected and displayed directly on the chart, helping you make precise decisions without manual drawing.
Real-Time Dashboard:
All relevant information, such as trend strength, market intent, volume sentiment, and the reason behind each signal, is neatly summarized in a dashboard—making monitoring effortless and intuitive.
Customizable & Beginner-Friendly:
Whether you’re a newcomer wanting straightforward guidance or a professional needing advanced customization, the indicator offers flexible options to adjust analysis depth, timeframes, sensitivity, and more.
Visual & Clutter-Free:
The design ensures that your chart remains clean and readable, showing only the most important information. This minimizes mental overload and allows for instant decision-making.
Who Will Benefit?
Beginners who want to learn trading logic, avoid common traps, and see the exact reason behind every signal.
Advanced traders who require adaptive multi-timeframe analytics, fast execution, and stress-free monitoring.
Anyone who wants to save screen time, reduce analysis paralysis, and have more confidence in every trade they take.
1. No Indicator Clutter
Intent:
Many traders get confused by charts filled with too many indicators and signals. This often leads to hesitation, missed trades, or taking random, risky trades.
In this Indicator:
You get a clean and clutter-free chart. Only the most important buy/sell/wait signals and relevant support/resistance/liquidity levels are shown. These update automatically, removing the “overload” and keeping your focus sharp, so your decision-making is faster and stress-free.
2. Exact Entry Guide
Intent:
Traders often struggle with entry timing, leading to FOMO (fear of missing out) or getting trapped in sudden market reversals.
In this Indicator:
The system uses powerful adaptive logic to filter out weak signals and only highlight the strongest market moves. This not only prevents you from entering late or on noise, but also helps avoid losses from false breakouts or whipsaws. You get actionable suggestions—when to enter, when to hold back—so your entries are high-conviction and disciplined.
3. HTF+LTF Logic: Multitimeframe Sync Analysis
Intent:
Most losing trades happen when you act only on the short-term chart, ignoring the bigger market trend.
In this Indicator:
Signals are based on both the current chart timeframe (LTF) and a higher (HTF, like hourly/daily) timeframe. The indicator synchronizes trend direction, momentum, and structure across both levels, quickly adapting to show you when both are aligned. This filtering results in “only trade with the bigger trend”—dramatically increasing your win rate and market confidence.
4. Auto Support/Resistance & Liquidity Zones
Intent:
Drawing support/resistance and liquidity zones manually is time-consuming and error-prone, especially for beginners.
In this Indicator:
The system automatically identifies and plots the most crucial support/resistance levels and liquidity zones on your chart. This is based on adaptive, real-time price and volume analysis. These zones highlight where major institutional activity, trap setups, or real breakouts/reversals are most likely, removing guesswork and giving you a clear reference for entries, exits, and stop placements.
5. Clear Action/Direction
Intent:
Traders need certainty—what does the market want right now? Most indicators are vague.
In this Indicator:
Your dashboard always displays in plain words (like “BUY”, “SELL”, or “WAIT”) what action makes sense in the current market phase. Whether it’s a bull trap, volume spike, wick reversal, or exhaustion—it’s interpreted and explained clearly. No more confusion—just direct, real-time advice.
6. For Everyone (Beginner to Pro)
Intent:
Most advanced indicators are overwhelming for new traders; simple ones lack depth for professionals.
In this Indicator:
It is simple enough for a beginner—just add it to the chart and instantly see what action to consider. At the same time, it includes advanced adaptive analysis, multi-timeframe logic, and customizable settings so professional traders can fine-tune it for their strategies.
7. Ideal Usage and User Benefits
Instant Decision Support:
Whenever you’re unsure about a trade, just look at the indicator’s suggestion for clarity.
Entry Learning:
Beginners get real-time “practice” by not only seeing signals, but also the reason behind them—improving your chart reading and market understanding.
Screen Time & Stress Reduction:
Clear, relevant information only; no noise, less fatigue, faster decisions.
Makes Trading Confident & Simple:
The smart dashboard splits actionable levels (HTF, LTF, action) so you never miss a move, avoid traps, and stay aligned with high-probability trades.
8. Advanced Input Settings (Smart Customization)
Explained with Examples:
Enable Wick Analysis:
Finds candles with strong upper/lower wicks (signs of rejection/buying/selling force), alerting you to hidden reversals and protecting from FOMO entries.
Enable Absorption:
Detects when heavy order flow from one side is “absorbed” by the other (shows where institutional buyers/sellers are likely active, helps spot fake breakouts).
Enable Unusual Breakout:
Highlights real breakouts—large volatility plus high volume—so you catch genuine moves and avoid random spikes.
Enable Range/Expansion:
Smartly flags sudden range expansions—when the market goes from quiet to volatile—so you can act at the start of real trends.
Trend Bar Lookback:
Adjusts how many bars/candles are used in trend calculations. Short (fast trades, more signals), long (more reliability, fewer whipsaws).
Bull/Bear Bars for Strong Trend Min:
Sets how many candles in a row must support a trend before calling it “strong”—prevents flipping signals, keeps you disciplined.
Volume MA Length:
Lets you adjust how many bars back volume is averaged—fine-tune for your asset and trading style for best volume signals.
Swing Lookback Bars:
Set how many bars to use for swing high/low detection—short (quick swing levels), long (stronger support/resistance).
HTF (Bias Window):
Decide which higher timeframe the indicator should use for big-picture market mood. Adjustable for any style (scalp, swing, position).
Adaptive Lookback (HTF):
Choose how much HTF history is used for detecting major extremes/zones. Quick adjust for more/less sensitivity.
Show Support/Resistance, Liquidity Zones, Trendlines:
Toggle them on/off instantly per your needs—keeps your chart relevant and tailored.
9. Live Dashboard Sections Explained
Intent HTF:
Shows if the bigger timeframe currently has a Bullish, Bearish, or Neutral (“Chop”) intent, based on strict volume/price body calculations. Instant clarity—no more guessing on trend bias.
HTF Bias:
Clear message about which side (buy/sell/sideways) controls the market on the higher timeframe, so you always trade with the “big money.”
Chart Action:
The central action for the current bar—Whether to Buy, Sell, or Wait—calculated from all indicator logic, not just one rule.
TrendScore Long/Short:
See how many candles in your chosen window were bullish or bearish, at a glance. Instantly gauge market momentum.
Reason (WHY):
Every time a signal appears, the “reason” cell tells you the primary logic (breakout, wick, strong trend, etc.) behind it. Full transparency and learning—never trade blindly.
Strong Trend:
Shows if the market is currently in a powerful trend or not—helping you avoid choppy, risky entries.
HTF Vol/Body:
Displays current higher timeframe volume and candle body %—helping spot when big players are active for higher probability trades.
Volume Sentiment:
A real-time analysis of market psychology (strong bullish/bearish, neutral)—making your decision-making much more confident.
10. Smart and User-Friendly Design
Multi-timeframe Adaptive:
All calculations can now be drawn from your choice of higher or current timeframe, ensuring signals are filtered by larger market context.
Flexible Table Position:
You can set the live dashboard/summary anywhere on the chart for best visibility.
Refined Zone Visualization:
Liquidity and order blocks are visually highlighted, auto-tuning for your settings and always cleaning up to stay clutter-free.
Multi-Lingual & Beginner Accessible:
With Hindi and simple English support, descriptions and settings are accessible for a wide audience—anyone can start using powerful trading logic with zero language barrier.
Efficient Labels & Clear Reasoning:
Signal labels and reasons are shown/removed dynamically so your chart stays informative, not messy.
Every detail of this indicator is designed to make trading both simpler and smarter—helping you avoid the common pitfalls, learn real price action, stay in sync with the market’s true mood, and act with discipline for higher consistency and confidence.
This indicator makes professional-grade market analysis accessible to everyone. It’s your trusted assistant for making smarter, faster, and more profitable trading decisions—providing not just signals, but also the “why” behind every action. With auto-adaptive logic, clear visuals, and strong focus on real trading needs, it lets you focus on capturing the moves that matter—every single time.
IFVG Extended + Entry/TPs IFVG Extended + Entry/TPs this is high winrate hands free just follow the system
EMA20 Entry with Lei Teacher Strategy_Trend_Follow_RuleEMA20 Entry with Lei Teacher Strategy Trend Follow Entry Alert
Smart PA Early Entry - Trend StartSmart PA Early Entry Indicator (MACD + FVG + Fibonacci)
This TradingView indicator helps traders spot potential trend reversals early by combining multiple technical tools:
MACD Momentum – Identifies the direction of the trend.
Volume Filter – Confirms strong market participation for reliable signals.
Fair Value Gaps (FVG) – Highlights areas where price may reverse or continue strongly.
Fibonacci Retracement Levels – Pinpoints key support/resistance zones for early entries.
ATR-based Stop Loss – Automatically calculates a dynamic stop-loss based on market volatility.
Trend Start Signals – Alerts only appear on the first candle of a potential trend change to avoid repeated signals.
Visual Labels & Plots – Shows entry price, stop-loss, FVG zones, and Fibonacci levels for easy chart reading.
Ideal for: Intraday and swing traders looking for high-probability entries near trend reversals with clear risk management.
Supertrend with TP, Entry & DCAThis script is super trend plus, horizontal lines for Take Profit, Entry Price and DCA.
EMA Pullback Entry SignalsEMA Pullback Entry Signals is a tool designed to help traders identify trend continuation opportunities by detecting price pullbacks toward a slow EMA (Exponential Moving Average) during trending conditions.
This indicator combines moving average crossovers, price interaction with EMAs, and optional filtering to improve the timing and quality of trend entries.
Core Features:
Golden Cross / Death Cross Detection
Golden Cross: Fast EMA crossing above Slow EMA
Death Cross: Fast EMA crossing below Slow EMA
Optional X-shaped markers for crossover visualization
Pullback Signal on Slow EMA
Green triangle: Price crosses up through the slow EMA during a bullish trend
Red triangle: Price crosses down through the slow EMA during a bearish trend
Designed to capture continuation entries after a trend pullback
Optional Fast EMA Signals
Green arrow: Price crosses above fast EMA in a bull trend
Red arrow: Price crosses below fast EMA in a bear trend
Helps confirm minor retracements or short-term momentum shifts
Sideways Market Filter
Suppresses signals when the fast and slow EMAs are too close
Prevents entries during low-trend or choppy price action
Cooldown Timer
Enforces a minimum bar interval between signals to reduce overtrading
Helps avoid multiple entries from clustered signals
Custom Alerts
Alerts available for all signal types
Include ticker and timeframe in each alert message
Configurable Settings:
Fast and slow EMA lengths1
Toggle individual signal types (pullbacks, fast EMA crosses, crossovers)
Enable/disable cooldown logic and set bar duration
Sideways market detection sensitivity (EMA proximity threshold)
Primary Use Case
This script is most useful for trend-following traders seeking to enter pullbacks after a trend is established. When the price retraces to the slow EMA and then resumes in the trend direction, it can offer high-quality continuation setups. Works well across timeframes and markets.