BEP BOLLINGER with Entry & TargetBEP BOLLINGER with Entry & Target Indicator
INPUT
ITM CE
ITM PE
ATM CE
ATM PE
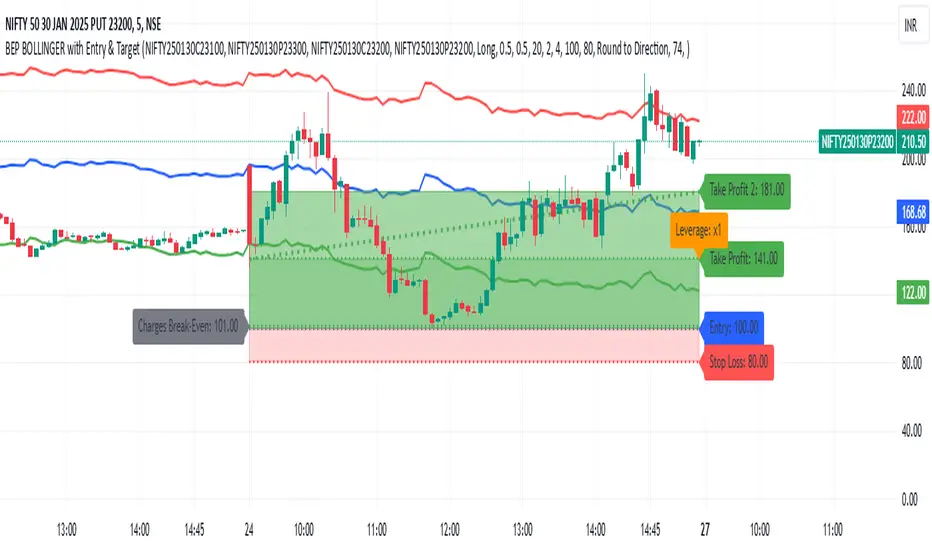
This custom Pine Script indicator provides traders with a powerful tool to analyze options trading setups, specifically for Call and Put options (CE & PE). By integrating Bollinger Bands with a set of configurable parameters, it calculates key entry, stop loss, and take profit levels, while factoring in risk and reward for each trade. Ideal for options traders, this indicator supports precise risk management and enhances your ability to plan and execute trades based on calculated entry points and profit targets.
Key Features:
CE & PE Symbol Selection: Allows users to input two pairs of Call and Put option symbols for premium calculation.
Premium Calculation: Automatically calculates and plots the average premium for each pair of options.
Risk & Reward Zones: Visualizes risk zones and reward zones based on user-defined entry price, stop loss, and risk/reward ratio.
Leverage and Stop Loss Calculation: Computes the optimal leverage and adjusts stop loss based on acceptable loss percentage.
Break-Even Point: Identifies the break-even point considering trading fees and leverage.
Take Profit Levels: Calculates and visualizes multiple take profit levels with different risk/reward ratios.
Multi-Timeframe Analysis: Incorporates higher timeframe analysis to determine entry and stop loss levels for better decision-making.
Dynamic Alerts: Provides alerts when the price hits the stop loss, take profit levels, or reaches the break-even point.
Visual Tools: Draws lines and shaded areas for entry, stop loss, take profit, and risk/reward zones to aid in visual decision-making.
Customizable Settings:
Risk Management: Adjust stop loss, leverage, and risk/reward ratios to suit your trading strategy.
Trading Direction: Choose between Long or Short positions based on market outlook.
Fee Calculations: Input your buy and sell fees to accurately calculate break-even and profit zones.
Color Customization: Personalize the color of premium lines, offset levels, and risk/reward zones.
Alerts:
Alerts can be set for Stop Loss, Take Profit, and Break-Even, ensuring you're notified in real-time when important price levels are reached.
This tool is perfect for traders looking to integrate risk management and precise trade setup analysis into their options trading strategy.
Pine Script® indicator