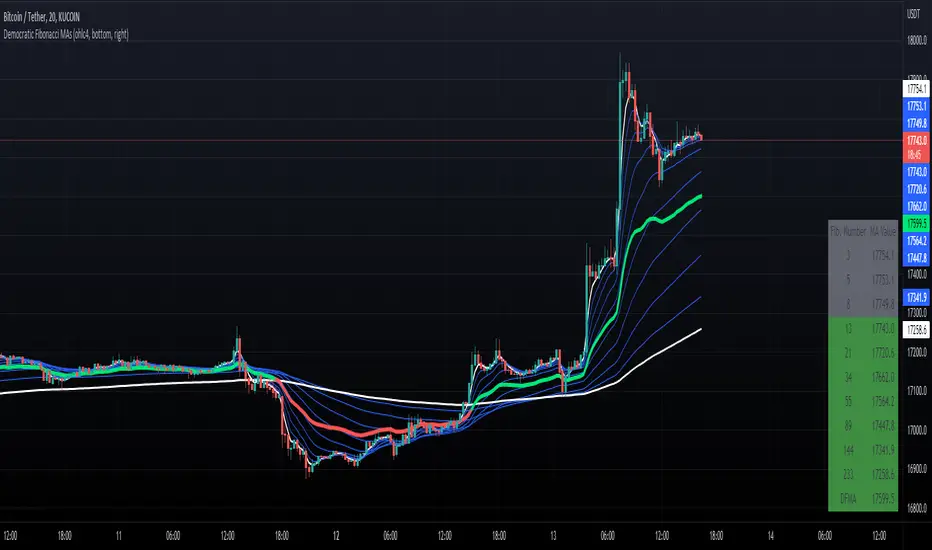
Democratic Fibonacci Moving AveragesWith this indicator, we have taken moving averages at Fibonacci lengths (3 to 233) as well as the average of these values, labeled the DFMA. Additionally, these values have been inputted into a table overlay. The cross of the FibMA(233) and the DFMA can be used as a signal for long or short.
The FibMA lengths of 3 and 233 are plotted in white by default, the FibMAs with lengths between 3 and 233 are plotted in blue by default, and the democratic line (DFMA) that averages these lines is plotted in green or red (depending on if the value is above or below the 233-length FibMA).
Search in scripts for "fib"
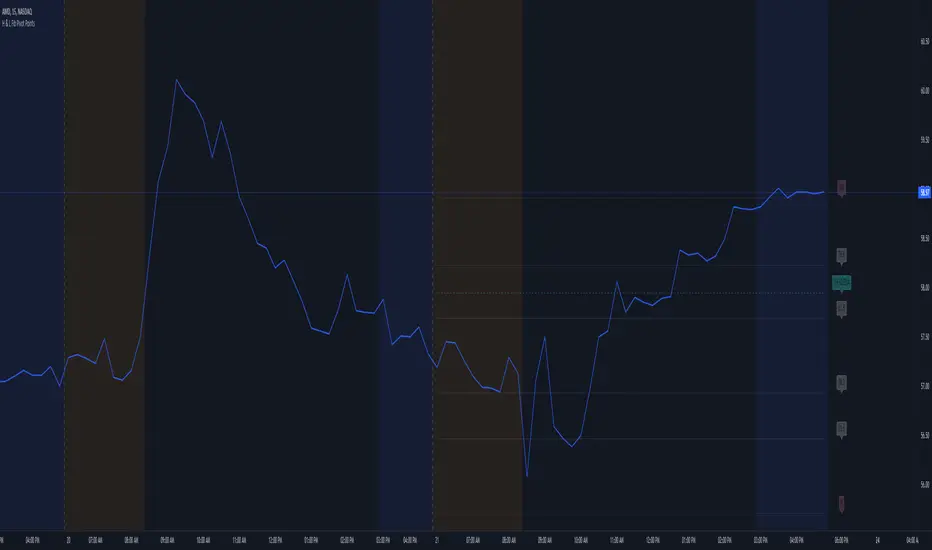
90 Min Cycles Indicator PatekFynnip (RhyDoo)This indicator is for showing 90 minute cycles. You have an option to change the number of 90 minute cycles.
Also you can change on what timeframe the cycles should be visible. You can change when the 90 minute cycles should start.
You can use the Fib Points of 0.13, 0.33, 0.47, 0.67 and 0.8 inside the cycles.
This is mainly for Forex like AUDUSD , EURUSD , GBPUSD , NZDUSD , USDCAD and USDCHF .
You can also use this for Indices like US30, US100 and US500.

Multi PivotsThis script is meant for day traders. It's based on the CPR concepts. The pivots plots based on the timeframe, means less that 15minuts it will plot daily pivots, less that daily tf, it plots weekly and then monthly. It also includes Camarillas, ADR levels, Fibonacci levels based on last 500 candles, Fib pivots, Pivot zones, developing pivot, Vwap, Dashboard shows RSI,ADX,Vwap,SuperTrend and day price difference. Options available to plot Day HighLow, Initial Balance levels as well. There is option to show running CPR which highlights virgin CPR. It can plot next day pivots as well
I dont own any of codes or ideas in the script. Codes are taken from different scripts and altered based on the requirements. Kudos to all the great pinecoders who provided their codes as public which helps everyone. Thanks

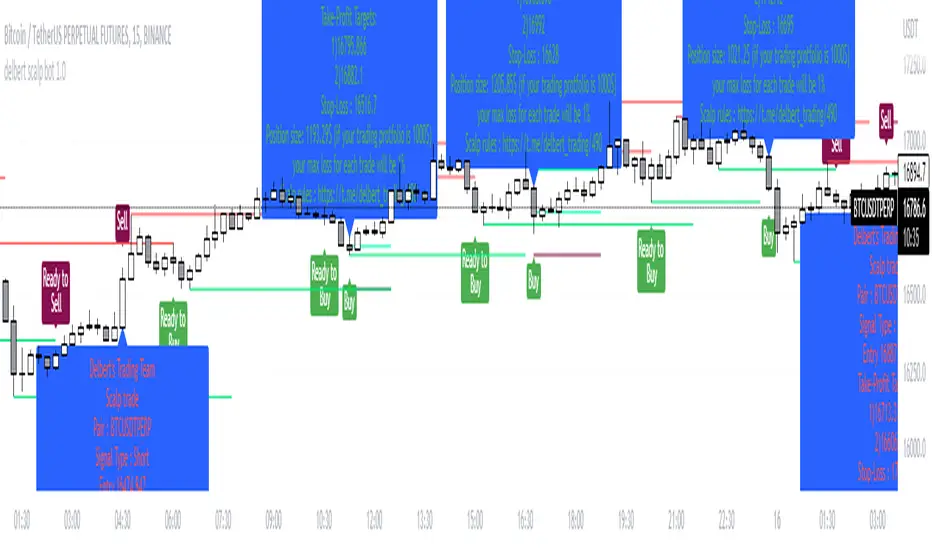
Delbert Scalpbot Indicator 1.0.1Our script will catch market trend 1st by identify Highs, Lows, higher highs, higher lows, lower highs & lower lows created on market movement.
Based on market structure it will generate buy/sell signals on golden pockets like 0.62 fib level when a market structure break , it will start prompting ready to buy or ready to sell signal . Once price comes to our level the buy/sell signal will be generated and if any user set our indicator to his/her chart with alert function call , it will start giving u notification if u have trading view premium .
Best pert of this indicator is ,it will give u a proper entry price with SL & TP with proper position size as per your account balance & risk % per trade set by u :) you no need to go for a calculation .
Your position size = leverage x margin, so if indicator says u to take 1252$ in position size, u just go for 125.2$ in 10X leverage in cross mode .
With risk management tool set by us. User can set risk per trade also can set account balance in setting of it , for an example ,if user put 100$ trading account balance and set risk per trade 2% then each trade will be executed with considering maximum loss amount in $2 , not more than that . detail calculation set on script by Devs of Delbert team , and it is tested .
Preferred time frame to use 2,5,10,15 mins .
Preferred coins BTC / ETH or any large market cap coin .
Still it's not a financial advice to anyone , feedback appreciated if u like it . We will make it more better day by day .
- Team Delbert's Trading
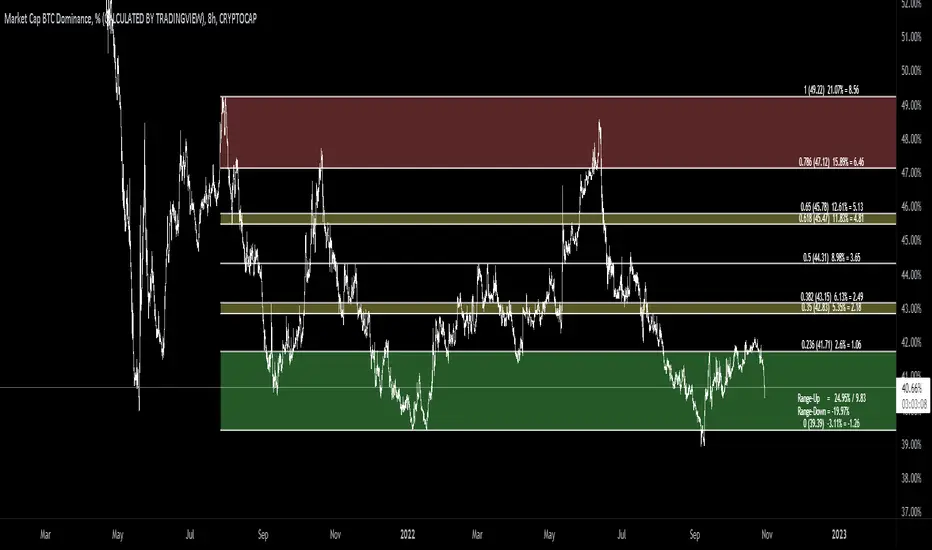
[MAD] Fibonacci retracementThis is just a Fibonacci Retracement tool with some interactive information based on the actual closing price
How to use:
add the script,
input left bottom with the 1st click,
input top with the 2nd click
Informations you can see than:
Fiblevel (Price) %till_this_point = pricedifference
additional:
Bottom of the fib
Range Up in % + Price-Range
Range Down in %
you can shift the comma with the decimal functions for trading shitcoins as example
if looking into the past, level/price will follow, liveinfo using the close is than hidden
what will follow:
reverse
log/linear
autogrow when range will be wicked
maybe alerts on levels... have to think about how to capture correctly
Support & Resistance Trendlines with PP + Fib. Channel█ Support & Resistance Trendlines with Pivot Points + Fibonacci Channel
This script automatically draw support and resistance trend lines based on pivot points and add a fibonacci channel.
It will show potential patterns with the help of support and resistance lines as well as breakout target and pullback entry with the fibonacci extension and retracement levels.
It is based on atolelole's script, I only made it more configurable so please check out his script.
I added the possibility to change values and add additional retracement and extension levels.
I also made it customizable with the possibility to change lines color, width and style.

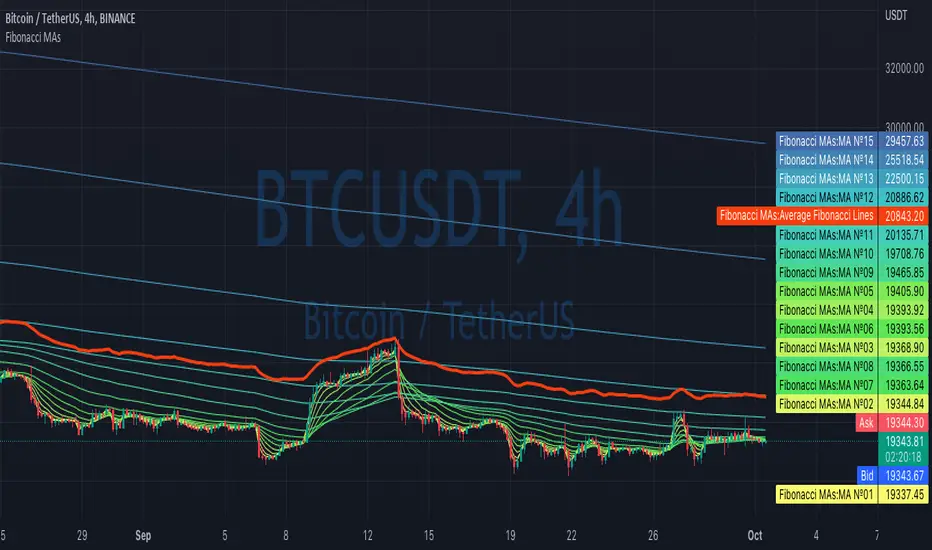
Fibonacci MAsIt's a pretty simple script. Idea is to compute MAs with the length of Fibonacci numbers and then compute an average of them all.
In the script, you can choose the type of MAs and how many Fibonacci numbers to use for it.
You can also adjust the length of these MAs manually and choose the color of every one of them.
Thanks to @MUQWISHI for helping me code it.
Disclaimer
Please remember that past performance may not be indicative of future results.
Due to various factors, including changing market conditions, the strategy may no longer perform as well as in historical backtesting.
This post and the script don’t provide any financial advice.
NEoWave Chart Free VersionAn automated wave chart for NEoWave wave analysis. This is an automated wave chart plotter that help you to find the current psychological trend and forecast the next one. This Indicator uses the concept of plotting wave charts as per the NeoWave method invented by Glenn Neely in 1990 in the “Mastering Elliott Wave” book. NEoWave is a advanced version of elliott wave theory, which solve the lots of drawback's and issues' of elliott wave theory.
The Logic and Concept used in Indicator
This indictor uses the logic of plotting wave chart as discussed in “Mastering Elliott Wave” book, According to “Mastering Elliott Wave” book to draw a wave chart draw a line from high to low or low to high in order that they occurred, and this indicator plot the line accurately from high to low or low to high in order they occurred.
Some Important Features
1. This indicator can draw wave chart from 5 Seconds to 5 Year or use any custom timeframe of your choice.
2. Use any timeframe wave chart on any timeframe cash data, like use monthly cash data to draw 2.5 years or 5 years wave chart.
3. Do the easy back testing with easy drag tool.
4. Customize wave chart settings based on your requirement.
5. Wave chart will be plotted on any type of charts like candlestick or bar chart.
6. Custom settings to hide other charts, like you can hide bar or candlestick chart, while using wave analysis.
7. Realtime plotting of wave chart from 5 seconds to 5 year.
Features to be added in future update
1. Show Monowave Counts.
2. Show Complexity levels.
3. Show Price and Time.
4. Show Starting point of patterns.
How to use this wave chart?
1. Use the log scale on wave chart. Use Alt + L to use logarithmic scale on chart.
2. Use log Fibonacci on wave chart, just open the settings of Fibonacci channel and check on "Fib channel based on log scale"
3. Find the correct starting point to mark the neowave patterns.
4. Apply the neowave rules as discussed in “Mastering Elliott Wave” book and forecast the market.
Note
If you want to check Daily or any higher timeframe wave chart use cash chart and if you want to check any other timeframe from 5 seconds to any intraday timeframe then use future's data as suggested by Mr. Glen Neely.

Price LevelsAuto plots significant Gann and Fib price levels using the all time range. Useful to quickly identify significant levels of support and resistance.


Auto Fibonacci Levels + Auto Trend Line generatorAnother indicator for you guys!!!
This indicator consists of the 5 key Fibonacci retracement levels, plotted automatically to user input settings. I also have included an auto support/resistance trend line generator.
What is a Fibonacci retracement?
'Fibonacci retracement is a method of technical analysis for determining support and resistance levels. It is named after the Fibonacci sequence of numbers, whose ratios provide price levels to which markets tend to retrace a portion of a move before a trend continues in the original direction.' - Wikipedia
How to use the Fibonacci retracement?
- The Fibonacci levels are default. These percentiles from price to the average of the high in a sample and low in a sample give you a guideline of where a bottom may be, where a top may be, and where a range is being created.
- Look for the price to reject from 61.8% and 76.4%, and also look for price to bounce from 38.2% and 23.6%. If a lower low/higher high is made, the fib levels will follow and the percentiles within will be recalculated after a 5 candle offset period.
- If you see price trending towards the lower percentiles (38&23) and using the 50% as resistance, look for a break downwards and vice versa.
-This Fibonacci set as all others is subject to fake-out, always use this with another series indicator, or don't use it as a signal for entry at all (unless you have a backdated strategy)
How to use the trend line generator?
-The trend line generator will only plot when a lower low/higher high has taken place within the input amount of candles. It is also offset by a user amount.
-The check box will give the option to have the trend line's plot or not.
- If you see a green/red dot it means that that will be your first coordinate for the trend line, and until the computations are complete it will give you an idea of which direction it will be in (resistance or support)
-When opening this indicator zoom out all the way to connect any trend lines that do not load automatically.
Let me know if you have any questions, suggestions or issues! Thank you everyone!
-Cheatcode1 :)
SP:SPX TVC:DXY BMFBOVESPA:EUR1! CME:BTC1! BINANCE:BTCUSDT

Previous Days RangesPrevious Days Ranges
Simply plots out market ranges of previous days price action, of which are the following:
Previous Day High
Previous Day Low
Previous Day Extended High
Previous Day Extended Low
Supports adjustments of timeframes, for different time zones, and style.

NEoWave ChartAn automated wave chart for NEoWave wave analysis. This is an automated wave chart plotter that help you to find the current psychological trend and forecast the next one. This Indicator uses the concept of plotting wave charts as per the NeoWave method invented by Glenn Neely in 1990 in the “Mastering Elliott Wave” book. NEoWave is a advanced version of elliott wave theory, which solve the lots of drawback's and issues' of elliott wave theory.
The Logic and Concept used in Indicator
This indictor uses the logic of plotting wave chart as discussed in “Mastering Elliott Wave” book, According to “Mastering Elliott Wave” book to draw a wave chart draw a line from high to low or low to high in order that they occurred, and this indicator plot the line accurately from high to low or low to high in order they occurred.
Some Important Features
1. This indicator can draw wave chart from 5 Seconds to 5 Year or use any custom timeframe of your choice.
2. Use any timeframe wave chart on any timeframe cash data, like use monthly cash data to draw 2.5 years or 5 years wave chart.
3. Do the easy back testing with easy drag tool.
4. Customize wave chart settings based on your requirement.
5. Wave chart will be plotted on any type of charts like candlestick or bar chart.
6. Custom settings to hide other charts, like you can hide bar or candlestick chart, while using wave analysis.
7. Realtime plotting of wave chart from 5 seconds to 5 year.
Features to be added in future update
1. Show Monowave Counts.
2. Show Complexity levels.
3. Show Price and Time.
4. Show Starting point of patterns.
How to use this wave chart?
1. Use the log scale on wave chart. Use Alt + L to use logarithmic scale on chart.
2. Use log Fibonacci on wave chart, just open the settings of Fibonacci channel and check on "Fib channel based on log scale"
3. Find the correct starting point to mark the neowave patterns.
4. Apply the neowave rules as discussed in “Mastering Elliott Wave” book and forecast the market.
Note
If you want to check Daily or any higher timeframe wave chart use cash chart and if you want to check any other timeframe from 5 seconds to any intraday timeframe then use future's data as suggested by Mr. Glen Neely.

Commodity Channel Relative StrengthNew concept(I think atleast) I've joined the Standard RSI and CCI at the hip with another plotcandle, which gives a picture of a larger candle With more interesting movement imo. Includes Fib Retracement Levels, High/Low and a couple of coppock curves for more confirmation. Broadening candles seem to indicate a weakening of trend strength (from what i've seen atleast) although exceptions do occur. Vice versa for tapering to a lesser degree I imagine. RSI has been shifted down to 0 to align the center point with the CCI , so the usual 30/70 RSI Levels are now -20/20 (although I have 30/-30 instead for the hlines).

High and Low Fibonacci Pivot PointsThis is a standard fibonacci retracement level indicator and free to use for all. I couldn't find any decent retracement levels that works for me (and definitely wasted money on paid script access that didn't work so well for my trading style), so I created this for my own use and now sharing it with the TradingView community. Fibonacci retracement levels help traders predict key areas where a stock/security may find support or resistance. The common ratios are available, such as 23.6, 38.2, 61.8 and so forth. You can choose from Day, Week or Month for your fibonacci retracement lines. In order to keep in sync with my particular style of keeping charts nice and clean, I've created this indicator with defaults to use friendly color schemes. You can of course, choose another color, etc... that fits your own taste. All of my published scripts utilize TradingView's version 5 scripting.
Main Features:
- Show or hide pre-market high and lows (the pre-market high & lows are hidden by default)
- Show or hide the 1-hour 20 EMA line (hidden by default, as this is more uncommon than the 1-hour 50 EMA line for potential support or resistance)
- Show or hide the 1-hour 50 EMA line
- Show or hide the fibonacci retracement lines (the 50% line is hidden by default)
- Option to allow the fibonacci retracement lines to start out the first few minutes of market open to use the pre-market high & low. Once the stock/security price breaks either the pre-market high or pre-market low, it reverts to using the day's high and low. This only works on chart timeframes under the daily time frame.
FYI:
All customizable settings have a help/info window. Please refer to the help/info window, if you're unsure of what a setting does what. Also, note that I wrote and published this script after market close, so I haven't had the chance to check/test if everything works, which can only be fully verified during market open hours (for non-crypto securities).
* Please note that this script is in its early beta stage and there could be bugs. This is being provided as is and the information provided by this script is meant for informational/entertainment purposes only.
God Number Channel v2(GNC v2)GNC got a little update:
1) Logic changed a bit.
I tried to calculate MAs based on the power(high - low of previous bars).You can see it the M-variables, as new statements were added in calculation section of MAs. I don't really know if I did right, because I didn't go too much in Pine Script. I just wanted to make a Bollinger-bands-like bands, which could predict the levels at which might reverse, using legendary fibonacci and Tesla's harmonic number 432. It's might sound as a joke, but as you can see, it works pretty good.
2) Customization :
No need to change Fibonacci ratios in code. Now you can do it in the GNC settings. Also MAs' names were made obvious, just check it out. Time of million similar "MA n1" has passed :)
3) Trade-entry advices :
I didn't tell you exactly the trade-entry advices, as I haven't explored this script fully yet :) But you probably understood something intuitively, when added GNC on the chart. Now I made things way more obvious:
1. Zones between Fib ratios show you how aware you should be of price movements. Basically, here are the rules, but you probably understand them already:
1.1 Red zone(RZ) : high awareness, very likly for price to be reversed, but if there is a clear trend and you know, than it might be a time for price to shoot up/down.
1.2 Orange zone(OZ) : medium awareness, not so obvious, as price might go between boundaries of OZ and continue the trend movement if such followed before entering the OZ. If price go below lower boundary of OZ and the next bar opens below this boundary, it might be a signal for SHORY, BUT(!) please consider confirmation of any sort to be more sure. Think of going beyond the upper boundary by analogy.
1.3 Green Zone(GZ) : if the price hits any boundary of green zone, it is usually a good oppurtunity to open a position against the movement(hit lower boundary -> open LONG, hit upper boundary -> open SHORT).
1.4 Middle Zone(Harmonic Zone)(MZ) : same rules from Green Zone.
IMPORTANT RECCOMENDATION : Use trend indicator to trend all signals from zones to follow the trend, 'cause counter-trending with this thing without stop loss might very quickly wipe you out , might if you will counter-trend strategy with GNC, I will be glad if you share it with the community :)
Reccomendation for better entries :
1) if the price hits the lower(or high) boundaries(LB or HB) zone after zone(hit LB or HB of RZ, then of OZ, then of GZ), it is a very good signal to either LONG, if price was hitting LBs , or SHORT, if hitting HBs .
2) Consider NOT to place trades when in MZ, as price in this zone gets tricky often enough. By the way, if you dont the see the harmonic MAs(which go with plot(ma1+(0.432*avg1)) ), then set the transparency of zone to 20% or a bit more and then it will be ok.
I will continue to develop the GNC and any help or feedback from you, guys, will be very helpful for me, so you welcome for any of those, but please be precise in your critics.
Thank you for using my stuff, hope you found it usefull. Good luck :)

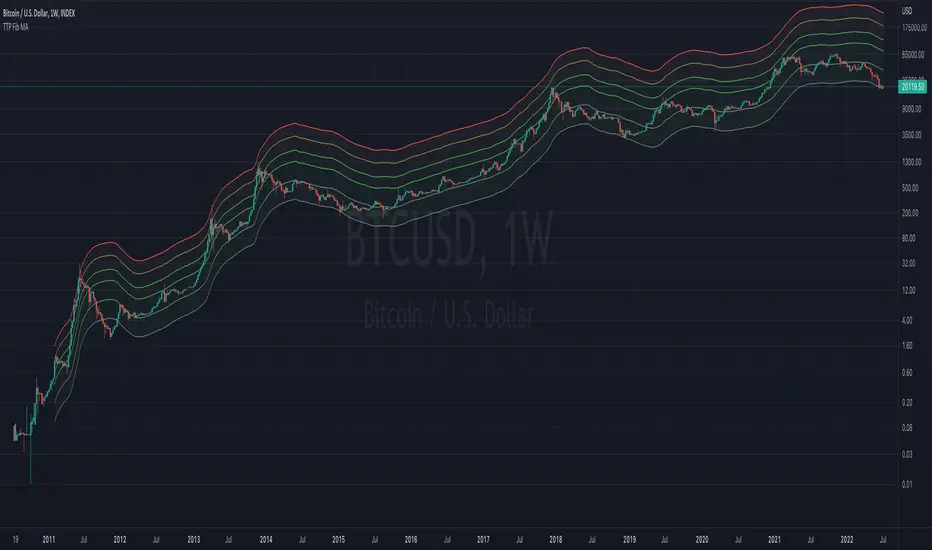
TTP Fibonacci MAThis indicator offers a fibonacci rainbow of moving averages.
Recommended instructions:
- timeframe: daily or weekly
- logarithmic scale
- default MA length for smoother curve
- fib levels used are 0.5,1,2,3,5 and 8, but you can also try with 1,2,3,5,8,13 or 0.33,05,1,2,3 depending on which range you want to cover
- you can render in weekly timeframe and still set the indicator settings timeframe to daily to get more reactive levels
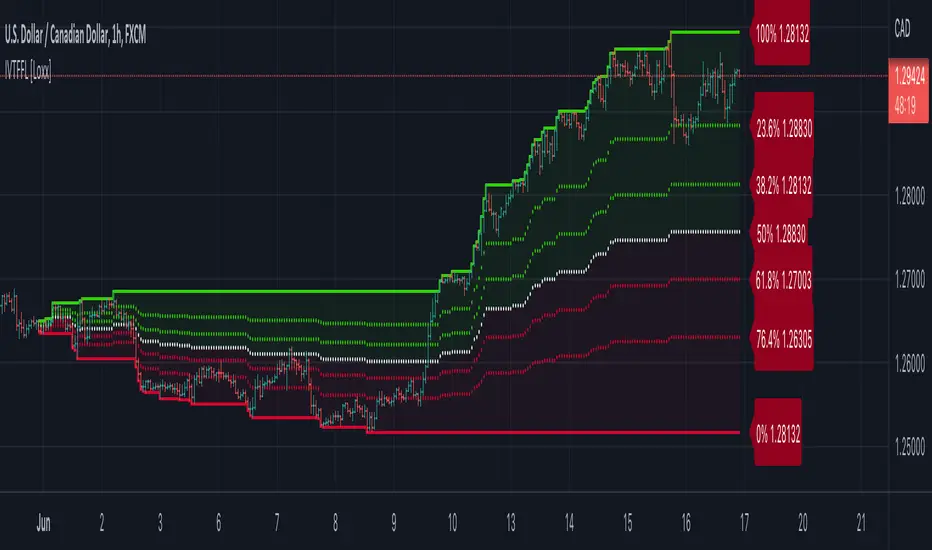
Intra-variety Timeframe Floating Fibonacci Levels [Loxx]Intra-variety Timeframe Floating Fibonacci Levels is an intraday, intraweek, and intramonth indicator to be used for scalping on lower timeframes. The indicator paints the developing fibonacci retracement levels as they change overtime over the selected intra-variety timeframe chosen. This indicator acts as another way to gauge support and resistance levels.
What Are Fibonacci Retracement Levels?
Fibonacci retracement levels—stemming from the Fibonacci sequence—are horizontal lines that indicate where support and resistance are likely to occur.
Each level is associated with a percentage. The percentage is how much of a prior move the price has retraced. The Fibonacci retracement levels are 23.6%, 38.2%, 61.8%, and 78.6%. While not officially a Fibonacci ratio, 50% is also used.
The indicator is useful because it can be drawn between any two significant price points, such as a high and a low. The indicator will then create the levels between those two points.
Suppose the price of a stock rises $10 and then drops $2.36. In that case, it has retraced 23.6%, which is a Fibonacci number. Fibonacci numbers are found throughout nature. Therefore, many traders believe that these numbers also have relevance in financial markets.
Fibonacci retracement levels were named after Italian mathemetician Leonardo Pisano Bigollo, who was famously known as Leonardo Fibonacci. However, Fibonacci did not create the Fibonacci sequence. Fibonacci, instead, introduced these numbers to western Europe after learning about them from Indian merchants. Fibonacci retracement levels were formulated in Ancient India between 450 and 200 BCE.
Details
-Change Fibonacci levels
-Select day, week, or month timeframe
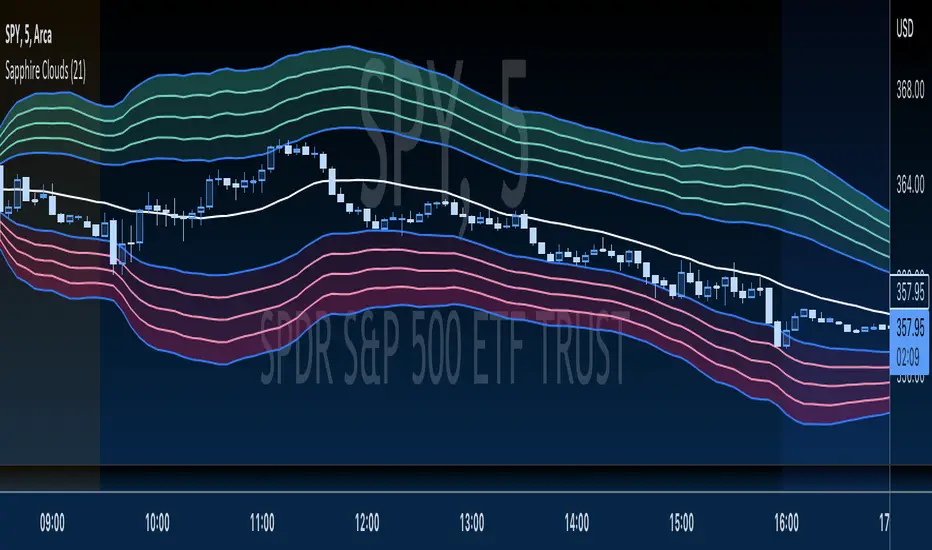
GBTT Sapphire CloudsOverview:
These clouds are built using an SMA, ATR, and Fibs to create a potential high and low type of channel system. The SMA length is customizable via a user input, but the default value is 5.
Intended use:
To provide educational content about the short term movement of an asset. Can be used on any time frame.
Disclaimer:
NOT intended to be a sole source of Technical Analysis or anything more than an educational tool!
1-gg702gg fib + 3ema 50+100+200=+10
heikin ashi trand
set with hem ind...
wolfpack and draw trend line or auto trend line
green = bay
red = sell
and set the bar heikin ashi from the sting
goooood lock

Multifib by Dan DormondThis multiple fibonacci allows you to calculate 2 fibonacci retracements at the same time, the one on the right uses the traditional method for an autofibonacci and the one on the left will use a higher point, so you can find areas of confluence where the price has a good possibility of reversing.
Fibonacci retracement levels—stemming from the Fibonacci sequence—are horizontal lines that indicate where support and resistance are likely to occur.
Each level is associated with a percentage. The percentage is how much of a prior move the price has retraced. The Fibonacci retracement levels are 23.6%, 38.2%, 61.8%, and 78.6%. While not officially a Fibonacci ratio, 50% is also used.
The indicator is useful because it can be drawn between any two significant price points, such as a high and a low. The indicator will then create the levels between those two points.
How to use it: Only the important fib levels are marked, to find areas of confluence just look for the places where the lines from the left side fibonacci match with the lines from the right side fibonacci retracement.
If you need the code you can message me.

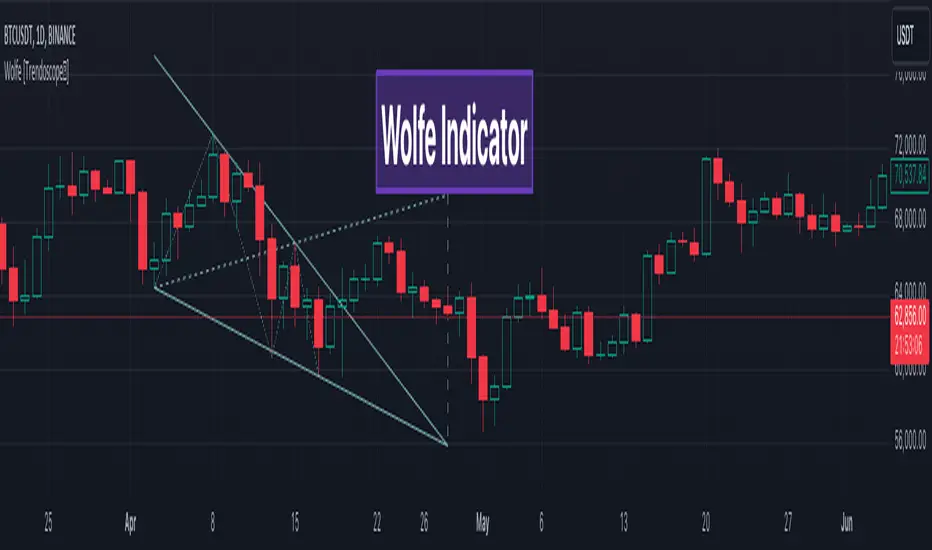
Wolfe Scanner (Multi - zigzag) [HeWhoMustNotBeNamed]Before getting into the script, I would like to explain bit of history around this project. Wolfe was in the back of my mind for some time and I had several attempts so far.
🎯Initial Attempt
When I first developed harmonic patterns, I got many requests from users to develop script to automatically detect Wolfe formation. I thought it would be easy and started boasting everywhere that I am going to attempt this next. However I miserably failed that time and started realising it is not as simple as I thought it would be. I started with Wolfe in mind. But, ran into issues with loops. Soon figured out that finding and drawing wedge is more trickier. I decided will explore trendline first so that it can help find wedge better. Soon, the project turned into something else and resulted in Auto-TrendLines-HeWhoMustNotBeNamed and Wolfe left forgotten.
🎯Using predefined ratios
Wolfe also has predefined fib ratios which we can use to calculate the formation. But, upon initial development, it did not convince me that it matches visual inspection of Wolfe all the time. Hence, I decided to fall back on finding wedge first.
🎯 Further exploration in finding wedge
This attempt was not too bad. I did not try to jump into Wolfe and nor I bragged anywhere about attempting anything of this sort. My target this time was to find how to derive wedge. I knew then that if I manage to calculate wedge in efficient way, it can help further in finding Wolfe. While doing that, ended up deriving Wedge-and-Flag-Finder-Multi-zigzag - which is not a bad outcome. I got few reminders on Wolfe after this both in comments and in PM.
🎯You never fail until you stop trying!!
After 2 back to back hectic 50hr work weeks + other commitments, I thought I will spend some time on this. Took less than half weekend and here we are. I was surprised how much little time it took in this attempt. But, the plan was running in my subconscious for several weeks or even months. Last two days were just putting these plans into an action.
Now, let's discuss about the script.
🎲 Wolfe Concept
Wolfe concept is simple. Whenever a wedge is formed, draw a line joining pivot 1 and 4 as shown in the chart below:
Converging trendline forms the stop loss whereas line joining pivots 1 and 4 form the profit taking points.
🎲 Settings
Settings are pretty straightforward. Explained in the chart below.
Ebb N Flo Trend [Signals]Ebb n Flo Trend is a trend indicator that makes use of higher time frame High - Low pivots to determine when a trend has changed
In order to reduce over trading, and to reduce fake outs, the script relies on a clever combination of Fib ratio expansions and an averaged candle close
By combining the above strategies, the trend indicator forms a trailing trend indicator
The script determines when the current market condition has crossed over or under the trailing trend, and based on the closing conditions will change the trend of the script signaling a change. If the trend indicator is below the current market and green, the trend is bullish. If the trend is above the market and red, the trend is bearish
The indicator does not repaint, as such, once a signal has been received, the condition has been met on a previous candle and is final
Trend indicator can be used on any markets, for both Long and Short swings, however is best suited for long term trading on certain crypto markets (based on backtesting results). Be on the lookout for pairs with decent volume on reputable exchanges. It is not a holy grail type script for all markets. The key is to find enough to diversify your trades.
As can be seen in the backtester results, the script performs exceptionally well when trading using the 1W higher time frame (selection in the script settings), in the 1D current time frame (selecting the chart time frame)
The script is ideal for the beginner trader that cannot spend hours everyday looking at charts.
The backtesting results are based on allocating 10% of your portfolio to a single trade - this should be determined by your risk appetite.
There are risks associated with any form of investing. Never invest more than you are willing to lose. Past performance is not a guarantee or predictor of future performance. Do your own due diligence before making any investment decisions.
Configuration:
The dropdown in the script selects the time frame for Highs and Lows that the script must consider, and the chart time frame is the time frame of which closing conditions the script should use
Alerts:
The indicator comes with 2 off alerts: open_LONG and open_SHORT, which in itself is self explanatory, however, due to the slow trading nature of the script, alerts are generally not needed
Once you receive access to the trial version, you will also receive a link to a video that will show you exactly how to set up the script
Happy trading
