Channel Based Zigzag [HeWhoMustNotBeNamed]🎲 Concept
Zigzag is built based on the price and number of offset bars. But, in this experiment, we build zigzag based on different bands such as Bollinger Band, Keltner Channel and Donchian Channel. The process is simple:
🎯 Derive bands based on input parameters
🎯 High of a bar is considered as pivot high only if the high price is above or equal to upper band.
🎯 Similarly low of a bar is considered as pivot low only if low price is below or equal to lower band.
🎯 Adding the pivot high/low follows same logic as that of regular zigzag where pivot high is always followed by pivot low and vice versa.
🎯 If the new pivot added is of same direction as that of last pivot, then both pivots are compared with each other and only the extreme one is kept. (Highest in case of pivot high and lowest in case of pivot low)
🎯 If a bar has both pivot high and pivot low - pivot with same direction as previous pivot is added to the list first before adding the pivot with opposite direction.
🎲 Use Cases
Can be used for pattern recognition algorithms instead of standard zigzag. This will help derive patterns which are relative to bands and channels.
Example: John Bollinger explains how to manually scan double tap using Bollinger Bands in this video: www.youtube.com This modified zigzag base can be used to achieve the same using algorithmic means.
🎲 Settings
Few simple configurations which will let you select the band properties. Notice that there is no zigzag length here. All the calculations depend on the bands.
With bands display, indicator looks something like this
Note that pivots do not always represent highest/lowest prices. They represent highest/lowest price relative to bands.
As mentioned many times, application of zigzag is not for buying at lower price and selling at higher price. It is mainly used for pattern recognition either manually or via algorithms. Lets build new Harmonic, Chart patterns, Trend Lines using the new zigzag?
Search in scripts for "high low"

HH-LL ZZAnother ZigZag, yes...
I believe though this concerns another angle/principle, therefore I wanted to share
How does it work?
Given:
source for level breach -> close
X breaches -> 3
Let's say this is the latest found 'lower low' (LL - blue dot under bar):
This bar has been triggered because 3 bars closed under low of previous 'trigger bar' (TB )
The high and low of this new TB will act as triggers
(aqua blue lines, seen in image above)
Then there are 2 options:
- again 3 bars closes under the latest TB , in that case the TB moves to that new LL.
- 3 bars closes higher than the high of previous TB
The high and low of this new TB act again as trigger
If a new TB LL/HH is found, the script checks previous LL/HH
and searches the highest/lowest point in between.
If necessary, the temporary highest/lowest will be adjusted:
Another example:
The last 2 points can change (repaint).
Yellow coloured lines/labels are set and won't change anymore.
Concluded:
In case of these settings:
source for level breach -> close
X breaches -> 3
once a new TB is found, the high and low act as trigger lines
- when 3 bars closes under that low , a new LL is found, this will be the new TB
- when 3 bars closes above that high , a new HH is found, this will be the new TB
and so on...
Settings:
source for level breach -> close or high/low - H/L
X breaches -> 1 -> 10
line style -> solid, dotted, dashed
show level breaches -> new found TB (blue/lime coloured)
show Support/Resistance (lines at the right)
repaint warning can be removed
show labels / lines
This ZZ can be used for Harmonic patterns, Trend evaluation, support/resistance,...
In this script, I also used new features
- text_font_family = font.family_monospace -> link
- display=display.pane -> link
Cheers!
lib_Indicators_v2_DTULibrary "lib_Indicators_v2_DTU"
This library functions returns included Moving averages, indicators with factorization, functions candles, function heikinashi and more.
Created it to feed as backend of my indicator/strategy "Indicators & Combinations Framework Advanced v2 " that will be released ASAP.
This is replacement of my previous indicator (lib_indicators_DT)
I will add an indicator example which will use this indicator named as "lib_indicators_v2_DTU example" to help the usage of this library
Additionally library will be updated with more indicators in the future
NOTES:
Indicator functions returns only one series :-(
plotcandle function returns candle series
INDICATOR LIST:
hide = 'DONT DISPLAY', //Dont display & calculate the indicator. (For my framework usage)
alma = 'alma(src,len,offset=0.85,sigma=6)', //Arnaud Legoux Moving Average
ama = 'ama(src,len,fast=14,slow=100)', //Adjusted Moving Average
acdst = 'accdist()', //Accumulation/distribution index.
cma = 'cma(src,len)', //Corrective Moving average
dema = 'dema(src,len)', //Double EMA (Same as EMA with 2 factor)
ema = 'ema(src,len)', //Exponential Moving Average
gmma = 'gmma(src,len)', //Geometric Mean Moving Average
hghst = 'highest(src,len)', //Highest value for a given number of bars back.
hl2ma = 'hl2ma(src,len)', //higest lowest moving average
hma = 'hma(src,len)', //Hull Moving Average.
lgAdt = 'lagAdapt(src,len,perclen=5,fperc=50)', //Ehler's Adaptive Laguerre filter
lgAdV = 'lagAdaptV(src,len,perclen=5,fperc=50)', //Ehler's Adaptive Laguerre filter variation
lguer = 'laguerre(src,len)', //Ehler's Laguerre filter
lsrcp = 'lesrcp(src,len)', //lowest exponential esrcpanding moving line
lexp = 'lexp(src,len)', //lowest exponential expanding moving line
linrg = 'linreg(src,len,loffset=1)', //Linear regression
lowst = 'lowest(src,len)', //Lovest value for a given number of bars back.
pcnl = 'percntl(src,len)', //percentile nearest rank. Calculates percentile using method of Nearest Rank.
pcnli = 'percntli(src,len)', //percentile linear interpolation. Calculates percentile using method of linear interpolation between the two nearest ranks.
rema = 'rema(src,len)', //Range EMA (REMA)
rma = 'rma(src,len)', //Moving average used in RSI. It is the exponentially weighted moving average with alpha = 1 / length.
sma = 'sma(src,len)', //Smoothed Moving Average
smma = 'smma(src,len)', //Smoothed Moving Average
supr2 = 'super2(src,len)', //Ehler's super smoother, 2 pole
supr3 = 'super3(src,len)', //Ehler's super smoother, 3 pole
strnd = 'supertrend(src,len,period=3)', //Supertrend indicator
swma = 'swma(src,len)', //Sine-Weighted Moving Average
tema = 'tema(src,len)', //Triple EMA (Same as EMA with 3 factor)
tma = 'tma(src,len)', //Triangular Moving Average
vida = 'vida(src,len)', //Variable Index Dynamic Average
vwma = 'vwma(src,len)', //Volume Weigted Moving Average
wma = 'wma(src,len)', //Weigted Moving Average
angle = 'angle(src,len)', //angle of the series (Use its Input as another indicator output)
atr = 'atr(src,len)', //average true range. RMA of true range.
bbr = 'bbr(src,len,mult=1)', //bollinger %%
bbw = 'bbw(src,len,mult=2)', //Bollinger Bands Width. The Bollinger Band Width is the difference between the upper and the lower Bollinger Bands divided by the middle band.
cci = 'cci(src,len)', //commodity channel index
cctbb = 'cctbbo(src,len)', //CCT Bollinger Band Oscilator
chng = 'change(src,len)', //Difference between current value and previous, source - source .
cmo = 'cmo(src,len)', //Chande Momentum Oscillator. Calculates the difference between the sum of recent gains and the sum of recent losses and then divides the result by the sum of all price movement over the same period.
cog = 'cog(src,len)', //The cog (center of gravity) is an indicator based on statistics and the Fibonacci golden ratio.
cpcrv = 'copcurve(src,len)', //Coppock Curve. was originally developed by Edwin "Sedge" Coppock (Barron's Magazine, October 1962).
corrl = 'correl(src,len)', //Correlation coefficient. Describes the degree to which two series tend to deviate from their ta.sma values.
count = 'count(src,len)', //green avg - red avg
dev = 'dev(src,len)', //ta.dev() Measure of difference between the series and it's ta.sma
fall = 'falling(src,len)', //ta.falling() Test if the `source` series is now falling for `length` bars long. (Use its Input as another indicator output)
kcr = 'kcr(src,len,mult=2)', //Keltner Channels Range
kcw = 'kcw(src,len,mult=2)', //ta.kcw(). Keltner Channels Width. The Keltner Channels Width is the difference between the upper and the lower Keltner Channels divided by the middle channel.
macd = 'macd(src,len)', //macd
mfi = 'mfi(src,len)', //Money Flow Index
nvi = 'nvi()', //Negative Volume Index
obv = 'obv()', //On Balance Volume
pvi = 'pvi()', //Positive Volume Index
pvt = 'pvt()', //Price Volume Trend
rise = 'rising(src,len)', //ta.rising() Test if the `source` series is now rising for `length` bars long. (Use its Input as another indicator output)
roc = 'roc(src,len)', //Rate of Change
rsi = 'rsi(src,len)', //Relative strength Index
smosc = 'smi_osc(src,len,fast=5, slow=34)', //smi Oscillator
smsig = 'smi_sig(src,len,fast=5, slow=34)', //smi Signal
stdev = 'stdev(src,len)', //Standart deviation
trix = 'trix(src,len)' , //the rate of change of a triple exponentially smoothed moving average.
tsi = 'tsi(src,len)', //True Strength Index
vari = 'variance(src,len)', //ta.variance(). Variance is the expectation of the squared deviation of a series from its mean (ta.sma), and it informally measures how far a set of numbers are spread out from their mean.
wilpc = 'willprc(src,len)', //Williams %R
wad = 'wad()', //Williams Accumulation/Distribution.
wvad = 'wvad()' //Williams Variable Accumulation/Distribution.
}
f_func(string, float, simple, float, float, float, simple) f_func Return selected indicator value with different parameters. New version. Use extra parameters for available indicators
Parameters:
string : FuncType_ indicator from the indicator list
float : src_ close, open, high, low,hl2, hlc3, ohlc4 or any
simple : int length_ indicator length
float : p1 extra parameter-1. active on Version 2 for defining multi arguments indicator input value. ex: lagAdapt(src_, length_,LAPercLen_=p1,FPerc_=p2)
float : p2 extra parameter-2. active on Version 2 for defining multi arguments indicator input value. ex: lagAdapt(src_, length_,LAPercLen_=p1,FPerc_=p2)
float : p3 extra parameter-3. active on Version 2 for defining multi arguments indicator input value. ex: lagAdapt(src_, length_,LAPercLen_=p1,FPerc_=p2)
simple : int version_ indicator version for backward compatibility. V1:dont use extra parameters p1,p2,p3 and use default values. V2: use extra parameters for available indicators
Returns: float Return calculated indicator value
fn_heikin(float, float, float, float) fn_heikin Return given src data (open, high,low,close) as heikin ashi candle values
Parameters:
float : o_ open value
float : h_ high value
float : l_ low value
float : c_ close value
Returns: float heikin ashi open, high,low,close vlues that will be used with plotcandle
fn_plotFunction(float, string, simple, bool) fn_plotFunction Return input src data with different plotting options
Parameters:
float : src_ indicator src_data or any other series.....
string : plotingType Ploting type of the function on the screen
simple : int stochlen_ length for plotingType for stochastic and PercentRank options
bool : plotSWMA Use SWMA for smoothing Ploting
Returns: float
fn_funcPlotV2(string, float, simple, float, float, float, simple, string, simple, bool, bool) fn_funcPlotV2 Return selected indicator value with different parameters. New version. Use extra parameters fora available indicators
Parameters:
string : FuncType_ indicator from the indicator list
float : src_data_ close, open, high, low,hl2, hlc3, ohlc4 or any
simple : int length_ indicator length
float : p1 extra parameter-1. active on Version 2 for defining multi arguments indicator input value. ex: lagAdapt(src_, length_,LAPercLen_=p1,FPerc_=p2)
float : p2 extra parameter-2. active on Version 2 for defining multi arguments indicator input value. ex: lagAdapt(src_, length_,LAPercLen_=p1,FPerc_=p2)
float : p3 extra parameter-3. active on Version 2 for defining multi arguments indicator input value. ex: lagAdapt(src_, length_,LAPercLen_=p1,FPerc_=p2)
simple : int version_ indicator version for backward compatibility. V1:dont use extra parameters p1,p2,p3 and use default values. V2: use extra parameters for available indicators
string : plotingType Ploting type of the function on the screen
simple : int stochlen_ length for plotingType for stochastic and PercentRank options
bool : plotSWMA Use SWMA for smoothing Ploting
bool : log_ Use log on function entries
Returns: float Return calculated indicator value
fn_factor(string, float, simple, float, float, float, simple, simple, string, simple, bool, bool) fn_factor Return selected indicator's factorization with given arguments
Parameters:
string : FuncType_ indicator from the indicator list
float : src_data_ close, open, high, low,hl2, hlc3, ohlc4 or any
simple : int length_ indicator length
float : p1 parameter-1. active on Version 2 for defining multi arguments indicator input value. ex: lagAdapt(src_, length_,LAPercLen_=p1,FPerc_=p2)
float : p2 parameter-2. active on Version 2 for defining multi arguments indicator input value. ex: lagAdapt(src_, length_,LAPercLen_=p1,FPerc_=p2)
float : p3 parameter-3. active on Version 2 for defining multi arguments indicator input value. ex: lagAdapt(src_, length_,LAPercLen_=p1,FPerc_=p2)
simple : int version_ indicator version for backward compatibility. V1:dont use extra parameters p1,p2,p3 and use default values. V2: use extra parameters for available indicators
simple : int fact_ Add double triple, Quatr factor to selected indicator (like converting EMA to 2-DEMA, 3-TEMA, 4-QEMA...)
string : plotingType Ploting type of the function on the screen
simple : int stochlen_ length for plotingType for stochastic and PercentRank options
bool : plotSWMA Use SWMA for smoothing Ploting
bool : log_ Use log on function entries
Returns: float Return result of the function
fn_plotCandles(string, simple, float, float, float, simple, string, simple, bool, bool, bool) fn_plotCandles Return selected indicator's candle values with different parameters also heikinashi is available
Parameters:
string : FuncType_ indicator from the indicator list
simple : int length_ indicator length
float : p1 parameter-1. active on Version 2 for defining multi arguments indicator input value. ex: lagAdapt(src_, length_,LAPercLen_=p1,FPerc_=p2)
float : p2 parameter-2. active on Version 2 for defining multi arguments indicator input value. ex: lagAdapt(src_, length_,LAPercLen_=p1,FPerc_=p2)
float : p3 parameter-3. active on Version 2 for defining multi arguments indicator input value. ex: lagAdapt(src_, length_,LAPercLen_=p1,FPerc_=p2)
simple : int version_ indicator version for backward compatibility. V1:dont use extra parameters p1,p2,p3 and use default values. V2: use extra parameters for available indicators
string : plotingType Ploting type of the function on the screen
simple : int stochlen_ length for plotingType for stochastic and PercentRank options
bool : plotSWMA Use SWMA for smoothing Ploting
bool : log_ Use log on function entries
bool : plotheikin_ Use Heikin Ashi on Plot
Returns: float

[MF] Auto Fibonacci LevelsDescription:
Automatically draw Fibonacci Pivot levels based on the previous (day's, week's or month's)
Range ( High-Low ). The HLC3 is used as the default Pivot level.
Unlike the "Auto Fibonacci Levels", this variation does not update
Levels on current day even if the price goes past the R3/S3 levels.
Timeframes: 1D, 1W, 1M
Range = (High - Low) - From previous Day, Week or month.
FIB LEVELS:
- Yellow = Pivot and Pivot Zone (HLC3 by default)
- red = R1,S1 Levels 0.236 * Range
- Green = R2,S2 Levels 0.368 * Range
- Lime = R3,S3 Levels 0.618 * Range
- Blue = R4,S4 Levels 0.786 * Range
- Gray = R5,S5 Levels 1.000 * Range
- Lime = R6,S6 Levels 1.236 * Range
- Red = R7,S7 Levels 1.382 * Range
- Blue = R8,S8 Levels 1.618 * Range
- Green = R9,S9 Levels 2.000 * Range
CLASSIC LEVELS:
- Yellow = Pivot and Pivot Zone (HLC3)
- Green = R1,S1 Levels (Pivot*2 - Low), (Pivot*2 - High)
- Lime = R2,S2 Levels ( Pivot + Range), ( Pivot - Range)
- Lime = R3,S3 Levels (High + 2*( Pivot - Low)), (Low - 2*(High - Pivot ))
- Blue = R4,S4 Levels (High + 3*( Pivot - Low)), (Low - 3*(High - Pivot ))
Refrences:
- Auto Daily Fib Levels R3.0 by JustUncleL
- Auto Fib by TheYangGuizi
- Monthly Dynamic Range Levels (Fibonaci) V0 by RicardoSantos
Modifications:
- Added next FIB Levels. (changes during the current cycle)
- Added FIB 0.236 Levels
- Added Option to change the colors of the Fib Levels
- Changed Default colors to the colors of Tradingview
- Upgraded to Version4 Pinescript

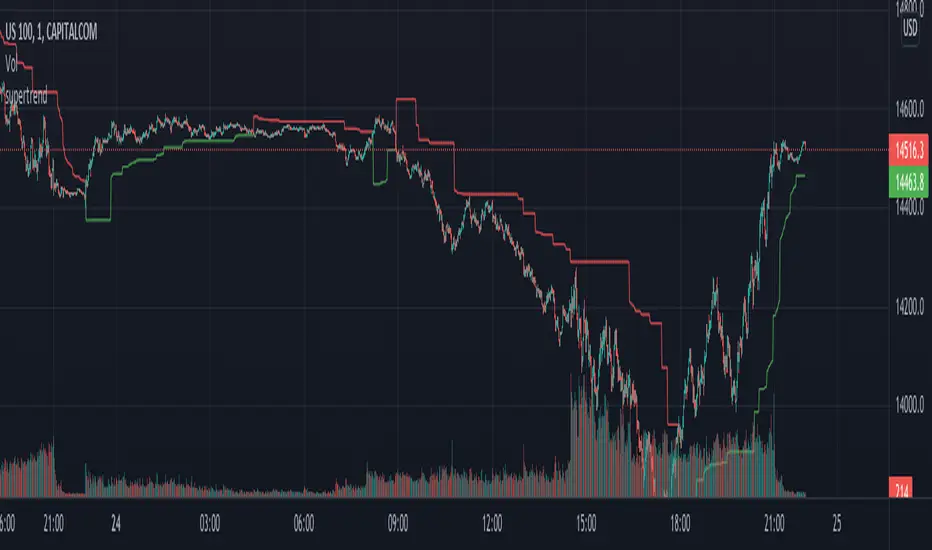
supertrendHere is an extensive library on different variations of supertrend.
Library "supertrend"
supertrend : Library dedicated to different variations of supertrend
supertrend_atr(length, multiplier, atrMaType, source, highSource, lowSource, waitForClose, delayed) supertrend_atr: Simple supertrend based on atr but also takes into consideration of custom MA Type, sources
Parameters:
length : : ATR Length
multiplier : : ATR Multiplier
atrMaType : : Moving Average type for ATR calculation. This can be sma, ema, hma, rma, wma, vwma, swma
source : : Default is close. Can Chose custom source
highSource : : Default is high. Can also use close price for both high and low source
lowSource : : Default is low. Can also use close price for both high and low source
waitForClose : : Considers source for direction change crossover if checked. Else, uses highSource and lowSource.
delayed : : if set to true lags supertrend atr stop based on target levels.
Returns: dir : Supertrend direction
supertrend : BuyStop if direction is 1 else SellStop
supertrend_bands(bandType, maType, length, multiplier, source, highSource, lowSource, waitForClose, useTrueRange, useAlternateSource, alternateSource, sticky) supertrend_bands: Simple supertrend based on atr but also takes into consideration of custom MA Type, sources
Parameters:
bandType : : Type of band used - can be bb, kc or dc
maType : : Moving Average type for Bands. This can be sma, ema, hma, rma, wma, vwma, swma
length : : Band Length
multiplier : : Std deviation or ATR multiplier for Bollinger Bands and Keltner Channel
source : : Default is close. Can Chose custom source
highSource : : Default is high. Can also use close price for both high and low source
lowSource : : Default is low. Can also use close price for both high and low source
waitForClose : : Considers source for direction change crossover if checked. Else, uses highSource and lowSource.
useTrueRange : : Used for Keltner channel. If set to false, then high-low is used as range instead of true range
useAlternateSource : - Custom source is used for Donchian Chanbel only if useAlternateSource is set to true
alternateSource : - Custom source for Donchian channel
sticky : : if set to true borders change only when price is beyond borders.
Returns: dir : Supertrend direction
supertrend : BuyStop if direction is 1 else SellStop
supertrend_zigzag(length, history, useAlternateSource, alternateSource, source, highSource, lowSource, waitForClose, atrlength, multiplier, atrMaType) supertrend_zigzag: Zigzag pivot based supertrend
Parameters:
length : : Zigzag Length
history : : number of historical pivots to consider
useAlternateSource : - Custom source is used for Zigzag only if useAlternateSource is set to true
alternateSource : - Custom source for Zigzag
source : : Default is close. Can Chose custom source
highSource : : Default is high. Can also use close price for both high and low source
lowSource : : Default is low. Can also use close price for both high and low source
waitForClose : : Considers source for direction change crossover if checked. Else, uses highSource and lowSource.
atrlength : : ATR Length
multiplier : : ATR Multiplier
atrMaType : : Moving Average type for ATR calculation. This can be sma, ema, hma, rma, wma, vwma, swma
Returns: dir : Supertrend direction
supertrend : BuyStop if direction is 1 else SellStop
taLibrary "ta"
█ OVERVIEW
This library holds technical analysis functions calculating values for which no Pine built-in exists.
Look first. Then leap.
█ FUNCTIONS
cagr(entryTime, entryPrice, exitTime, exitPrice)
It calculates the "Compound Annual Growth Rate" between two points in time. The CAGR is a notional, annualized growth rate that assumes all profits are reinvested. It only takes into account the prices of the two end points — not drawdowns, so it does not calculate risk. It can be used as a yardstick to compare the performance of two instruments. Because it annualizes values, the function requires a minimum of one day between the two end points (annualizing returns over smaller periods of times doesn't produce very meaningful figures).
Parameters:
entryTime : The starting timestamp.
entryPrice : The starting point's price.
exitTime : The ending timestamp.
exitPrice : The ending point's price.
Returns: CAGR in % (50 is 50%). Returns `na` if there is not >=1D between `entryTime` and `exitTime`, or until the two time points have not been reached by the script.
█ v2, Mar. 8, 2022
Added functions `allTimeHigh()` and `allTimeLow()` to find the highest or lowest value of a source from the first historical bar to the current bar. These functions will not look ahead; they will only return new highs/lows on the bar where they occur.
allTimeHigh(src)
Tracks the highest value of `src` from the first historical bar to the current bar.
Parameters:
src : (series int/float) Series to track. Optional. The default is `high`.
Returns: (float) The highest value tracked.
allTimeLow(src)
Tracks the lowest value of `src` from the first historical bar to the current bar.
Parameters:
src : (series int/float) Series to track. Optional. The default is `low`.
Returns: (float) The lowest value tracked.
█ v3, Sept. 27, 2022
This version includes the following new functions:
aroon(length)
Calculates the values of the Aroon indicator.
Parameters:
length (simple int) : (simple int) Number of bars (length).
Returns: ( [float, float ]) A tuple of the Aroon-Up and Aroon-Down values.
coppock(source, longLength, shortLength, smoothLength)
Calculates the value of the Coppock Curve indicator.
Parameters:
source (float) : (series int/float) Series of values to process.
longLength (simple int) : (simple int) Number of bars for the fast ROC value (length).
shortLength (simple int) : (simple int) Number of bars for the slow ROC value (length).
smoothLength (simple int) : (simple int) Number of bars for the weigted moving average value (length).
Returns: (float) The oscillator value.
dema(source, length)
Calculates the value of the Double Exponential Moving Average (DEMA).
Parameters:
source (float) : (series int/float) Series of values to process.
length (simple int) : (simple int) Length for the smoothing parameter calculation.
Returns: (float) The double exponentially weighted moving average of the `source`.
dema2(src, length)
An alternate Double Exponential Moving Average (Dema) function to `dema()`, which allows a "series float" length argument.
Parameters:
src : (series int/float) Series of values to process.
length : (series int/float) Length for the smoothing parameter calculation.
Returns: (float) The double exponentially weighted moving average of the `src`.
dm(length)
Calculates the value of the "Demarker" indicator.
Parameters:
length (simple int) : (simple int) Number of bars (length).
Returns: (float) The oscillator value.
donchian(length)
Calculates the values of a Donchian Channel using `high` and `low` over a given `length`.
Parameters:
length (int) : (series int) Number of bars (length).
Returns: ( [float, float, float ]) A tuple containing the channel high, low, and median, respectively.
ema2(src, length)
An alternate ema function to the `ta.ema()` built-in, which allows a "series float" length argument.
Parameters:
src : (series int/float) Series of values to process.
length : (series int/float) Number of bars (length).
Returns: (float) The exponentially weighted moving average of the `src`.
eom(length, div)
Calculates the value of the Ease of Movement indicator.
Parameters:
length (simple int) : (simple int) Number of bars (length).
div (simple int) : (simple int) Divisor used for normalzing values. Optional. The default is 10000.
Returns: (float) The oscillator value.
frama(source, length)
The Fractal Adaptive Moving Average (FRAMA), developed by John Ehlers, is an adaptive moving average that dynamically adjusts its lookback period based on fractal geometry.
Parameters:
source (float) : (series int/float) Series of values to process.
length (int) : (series int) Number of bars (length).
Returns: (float) The fractal adaptive moving average of the `source`.
ft(source, length)
Calculates the value of the Fisher Transform indicator.
Parameters:
source (float) : (series int/float) Series of values to process.
length (simple int) : (simple int) Number of bars (length).
Returns: (float) The oscillator value.
ht(source)
Calculates the value of the Hilbert Transform indicator.
Parameters:
source (float) : (series int/float) Series of values to process.
Returns: (float) The oscillator value.
ichimoku(conLength, baseLength, senkouLength)
Calculates values of the Ichimoku Cloud indicator, including tenkan, kijun, senkouSpan1, senkouSpan2, and chikou. NOTE: offsets forward or backward can be done using the `offset` argument in `plot()`.
Parameters:
conLength (int) : (series int) Length for the Conversion Line (Tenkan). The default is 9 periods, which returns the mid-point of the 9 period Donchian Channel.
baseLength (int) : (series int) Length for the Base Line (Kijun-sen). The default is 26 periods, which returns the mid-point of the 26 period Donchian Channel.
senkouLength (int) : (series int) Length for the Senkou Span 2 (Leading Span B). The default is 52 periods, which returns the mid-point of the 52 period Donchian Channel.
Returns: ( [float, float, float, float, float ]) A tuple of the Tenkan, Kijun, Senkou Span 1, Senkou Span 2, and Chikou Span values. NOTE: by default, the senkouSpan1 and senkouSpan2 should be plotted 26 periods in the future, and the Chikou Span plotted 26 days in the past.
ift(source)
Calculates the value of the Inverse Fisher Transform indicator.
Parameters:
source (float) : (series int/float) Series of values to process.
Returns: (float) The oscillator value.
kvo(fastLen, slowLen, trigLen)
Calculates the values of the Klinger Volume Oscillator.
Parameters:
fastLen (simple int) : (simple int) Length for the fast moving average smoothing parameter calculation.
slowLen (simple int) : (simple int) Length for the slow moving average smoothing parameter calculation.
trigLen (simple int) : (simple int) Length for the trigger moving average smoothing parameter calculation.
Returns: ( [float, float ]) A tuple of the KVO value, and the trigger value.
pzo(length)
Calculates the value of the Price Zone Oscillator.
Parameters:
length (simple int) : (simple int) Length for the smoothing parameter calculation.
Returns: (float) The oscillator value.
rms(source, length)
Calculates the Root Mean Square of the `source` over the `length`.
Parameters:
source (float) : (series int/float) Series of values to process.
length (int) : (series int) Number of bars (length).
Returns: (float) The RMS value.
rwi(length)
Calculates the values of the Random Walk Index.
Parameters:
length (simple int) : (simple int) Lookback and ATR smoothing parameter length.
Returns: ( [float, float ]) A tuple of the `rwiHigh` and `rwiLow` values.
stc(source, fast, slow, cycle, d1, d2)
Calculates the value of the Schaff Trend Cycle indicator.
Parameters:
source (float) : (series int/float) Series of values to process.
fast (simple int) : (simple int) Length for the MACD fast smoothing parameter calculation.
slow (simple int) : (simple int) Length for the MACD slow smoothing parameter calculation.
cycle (simple int) : (simple int) Number of bars for the Stochastic values (length).
d1 (simple int) : (simple int) Length for the initial %D smoothing parameter calculation.
d2 (simple int) : (simple int) Length for the final %D smoothing parameter calculation.
Returns: (float) The oscillator value.
stochFull(periodK, smoothK, periodD)
Calculates the %K and %D values of the Full Stochastic indicator.
Parameters:
periodK (simple int) : (simple int) Number of bars for Stochastic calculation. (length).
smoothK (simple int) : (simple int) Number of bars for smoothing of the %K value (length).
periodD (simple int) : (simple int) Number of bars for smoothing of the %D value (length).
Returns: ( [float, float ]) A tuple of the slow %K and the %D moving average values.
stochRsi(lengthRsi, periodK, smoothK, periodD, source)
Calculates the %K and %D values of the Stochastic RSI indicator.
Parameters:
lengthRsi (simple int) : (simple int) Length for the RSI smoothing parameter calculation.
periodK (simple int) : (simple int) Number of bars for Stochastic calculation. (length).
smoothK (simple int) : (simple int) Number of bars for smoothing of the %K value (length).
periodD (simple int) : (simple int) Number of bars for smoothing of the %D value (length).
source (float) : (series int/float) Series of values to process. Optional. The default is `close`.
Returns: ( [float, float ]) A tuple of the slow %K and the %D moving average values.
supertrend(factor, atrLength, wicks)
Calculates the values of the SuperTrend indicator with the ability to take candle wicks into account, rather than only the closing price.
Parameters:
factor (float) : (series int/float) Multiplier for the ATR value.
atrLength (simple int) : (simple int) Length for the ATR smoothing parameter calculation.
wicks (simple bool) : (simple bool) Condition to determine whether to take candle wicks into account when reversing trend, or to use the close price. Optional. Default is false.
Returns: ( [float, int ]) A tuple of the superTrend value and trend direction.
szo(source, length)
Calculates the value of the Sentiment Zone Oscillator.
Parameters:
source (float) : (series int/float) Series of values to process.
length (simple int) : (simple int) Length for the smoothing parameter calculation.
Returns: (float) The oscillator value.
t3(source, length, vf)
Calculates the value of the Tilson Moving Average (T3).
Parameters:
source (float) : (series int/float) Series of values to process.
length (simple int) : (simple int) Length for the smoothing parameter calculation.
vf (simple float) : (simple float) Volume factor. Affects the responsiveness.
Returns: (float) The Tilson moving average of the `source`.
t3Alt(source, length, vf)
An alternate Tilson Moving Average (T3) function to `t3()`, which allows a "series float" `length` argument.
Parameters:
source (float) : (series int/float) Series of values to process.
length (float) : (series int/float) Length for the smoothing parameter calculation.
vf (simple float) : (simple float) Volume factor. Affects the responsiveness.
Returns: (float) The Tilson moving average of the `source`.
tema(source, length)
Calculates the value of the Triple Exponential Moving Average (TEMA).
Parameters:
source (float) : (series int/float) Series of values to process.
length (simple int) : (simple int) Length for the smoothing parameter calculation.
Returns: (float) The triple exponentially weighted moving average of the `source`.
tema2(source, length)
An alternate Triple Exponential Moving Average (TEMA) function to `tema()`, which allows a "series float" `length` argument.
Parameters:
source (float) : (series int/float) Series of values to process.
length (float) : (series int/float) Length for the smoothing parameter calculation.
Returns: (float) The triple exponentially weighted moving average of the `source`.
trima(source, length)
Calculates the value of the Triangular Moving Average (TRIMA).
Parameters:
source (float) : (series int/float) Series of values to process.
length (int) : (series int) Number of bars (length).
Returns: (float) The triangular moving average of the `source`.
trima2(src, length)
An alternate Triangular Moving Average (TRIMA) function to `trima()`, which allows a "series int" length argument.
Parameters:
src : (series int/float) Series of values to process.
length : (series int) Number of bars (length).
Returns: (float) The triangular moving average of the `src`.
trix(source, length, signalLength, exponential)
Calculates the values of the TRIX indicator.
Parameters:
source (float) : (series int/float) Series of values to process.
length (simple int) : (simple int) Length for the smoothing parameter calculation.
signalLength (simple int) : (simple int) Length for smoothing the signal line.
exponential (simple bool) : (simple bool) Condition to determine whether exponential or simple smoothing is used. Optional. The default is `true` (exponential smoothing).
Returns: ( [float, float, float ]) A tuple of the TRIX value, the signal value, and the histogram.
uo(fastLen, midLen, slowLen)
Calculates the value of the Ultimate Oscillator.
Parameters:
fastLen (simple int) : (series int) Number of bars for the fast smoothing average (length).
midLen (simple int) : (series int) Number of bars for the middle smoothing average (length).
slowLen (simple int) : (series int) Number of bars for the slow smoothing average (length).
Returns: (float) The oscillator value.
vhf(source, length)
Calculates the value of the Vertical Horizontal Filter.
Parameters:
source (float) : (series int/float) Series of values to process.
length (simple int) : (simple int) Number of bars (length).
Returns: (float) The oscillator value.
vi(length)
Calculates the values of the Vortex Indicator.
Parameters:
length (simple int) : (simple int) Number of bars (length).
Returns: ( [float, float ]) A tuple of the viPlus and viMinus values.
vzo(length)
Calculates the value of the Volume Zone Oscillator.
Parameters:
length (simple int) : (simple int) Length for the smoothing parameter calculation.
Returns: (float) The oscillator value.
williamsFractal(period)
Detects Williams Fractals.
Parameters:
period (int) : (series int) Number of bars (length).
Returns: ( [bool, bool ]) A tuple of an up fractal and down fractal. Variables are true when detected.
wpo(length)
Calculates the value of the Wave Period Oscillator.
Parameters:
length (simple int) : (simple int) Length for the smoothing parameter calculation.
Returns: (float) The oscillator value.
█ v7, Nov. 2, 2023
This version includes the following new and updated functions:
atr2(length)
An alternate ATR function to the `ta.atr()` built-in, which allows a "series float" `length` argument.
Parameters:
length (float) : (series int/float) Length for the smoothing parameter calculation.
Returns: (float) The ATR value.
changePercent(newValue, oldValue)
Calculates the percentage difference between two distinct values.
Parameters:
newValue (float) : (series int/float) The current value.
oldValue (float) : (series int/float) The previous value.
Returns: (float) The percentage change from the `oldValue` to the `newValue`.
donchian(length)
Calculates the values of a Donchian Channel using `high` and `low` over a given `length`.
Parameters:
length (int) : (series int) Number of bars (length).
Returns: ( [float, float, float ]) A tuple containing the channel high, low, and median, respectively.
highestSince(cond, source)
Tracks the highest value of a series since the last occurrence of a condition.
Parameters:
cond (bool) : (series bool) A condition which, when `true`, resets the tracking of the highest `source`.
source (float) : (series int/float) Series of values to process. Optional. The default is `high`.
Returns: (float) The highest `source` value since the last time the `cond` was `true`.
lowestSince(cond, source)
Tracks the lowest value of a series since the last occurrence of a condition.
Parameters:
cond (bool) : (series bool) A condition which, when `true`, resets the tracking of the lowest `source`.
source (float) : (series int/float) Series of values to process. Optional. The default is `low`.
Returns: (float) The lowest `source` value since the last time the `cond` was `true`.
relativeVolume(length, anchorTimeframe, isCumulative, adjustRealtime)
Calculates the volume since the last change in the time value from the `anchorTimeframe`, the historical average volume using bars from past periods that have the same relative time offset as the current bar from the start of its period, and the ratio of these volumes. The volume values are cumulative by default, but can be adjusted to non-accumulated with the `isCumulative` parameter.
Parameters:
length (simple int) : (simple int) The number of periods to use for the historical average calculation.
anchorTimeframe (simple string) : (simple string) The anchor timeframe used in the calculation. Optional. Default is "D".
isCumulative (simple bool) : (simple bool) If `true`, the volume values will be accumulated since the start of the last `anchorTimeframe`. If `false`, values will be used without accumulation. Optional. The default is `true`.
adjustRealtime (simple bool) : (simple bool) If `true`, estimates the cumulative value on unclosed bars based on the data since the last `anchor` condition. Optional. The default is `false`.
Returns: ( [float, float, float ]) A tuple of three float values. The first element is the current volume. The second is the average of volumes at equivalent time offsets from past anchors over the specified number of periods. The third is the ratio of the current volume to the historical average volume.
rma2(source, length)
An alternate RMA function to the `ta.rma()` built-in, which allows a "series float" `length` argument.
Parameters:
source (float) : (series int/float) Series of values to process.
length (float) : (series int/float) Length for the smoothing parameter calculation.
Returns: (float) The rolling moving average of the `source`.
supertrend2(factor, atrLength, wicks)
An alternate SuperTrend function to `supertrend()`, which allows a "series float" `atrLength` argument.
Parameters:
factor (float) : (series int/float) Multiplier for the ATR value.
atrLength (float) : (series int/float) Length for the ATR smoothing parameter calculation.
wicks (simple bool) : (simple bool) Condition to determine whether to take candle wicks into account when reversing trend, or to use the close price. Optional. Default is `false`.
Returns: ( [float, int ]) A tuple of the superTrend value and trend direction.
vStop(source, atrLength, atrFactor)
Calculates an ATR-based stop value that trails behind the `source`. Can serve as a possible stop-loss guide and trend identifier.
Parameters:
source (float) : (series int/float) Series of values that the stop trails behind.
atrLength (simple int) : (simple int) Length for the ATR smoothing parameter calculation.
atrFactor (float) : (series int/float) The multiplier of the ATR value. Affects the maximum distance between the stop and the `source` value. A value of 1 means the maximum distance is 100% of the ATR value. Optional. The default is 1.
Returns: ( [float, bool ]) A tuple of the volatility stop value and the trend direction as a "bool".
vStop2(source, atrLength, atrFactor)
An alternate Volatility Stop function to `vStop()`, which allows a "series float" `atrLength` argument.
Parameters:
source (float) : (series int/float) Series of values that the stop trails behind.
atrLength (float) : (series int/float) Length for the ATR smoothing parameter calculation.
atrFactor (float) : (series int/float) The multiplier of the ATR value. Affects the maximum distance between the stop and the `source` value. A value of 1 means the maximum distance is 100% of the ATR value. Optional. The default is 1.
Returns: ( [float, bool ]) A tuple of the volatility stop value and the trend direction as a "bool".
Removed Functions:
allTimeHigh(src)
Tracks the highest value of `src` from the first historical bar to the current bar.
allTimeLow(src)
Tracks the lowest value of `src` from the first historical bar to the current bar.
trima2(src, length)
An alternate Triangular Moving Average (TRIMA) function to `trima()`, which allows a
"series int" length argument.

My:HTF O/H/L/C█ MY Higher Time Frame Open / High / Low / Close
This indicator shows one line per Higher Time Frame Price of Interest.
We are interested to know whether we are currently seeing support or resistance at previous daily / weekly / monthly price of interest.
Each price of interest can be displayed or hidden in the configuration. Each line has a label attached to it with the (short) label on it to help identifying what is this line.
Price of interest with (short) label :
Current Daily Open (CDO)
Current Daily High (CDH)
Current Daily Low (CDL)
Previous Daily Open (PDO)
Previous Daily High (PDH)
Previous Daily Low (PDL)
Previous Daily Close (PDC)
Current Weekly Open (CWO)
Current Weekly High (CWH)
Current Weekly Low (CWL)
Previous Weekly Open (PWO)
Previous Weekly High (PWH)
Previous Weekly Low (PWL)
Previous Weekly Close (PWC)
Current Monthly Open (CMO)
Current Monthly High (CMH)
Current Monthly Low (CML)
Previous Monthly Open (PMO)
Previous Monthly High (PMH)
Previous Monthly Low (PML)
Previous Monthly Close (PMC)

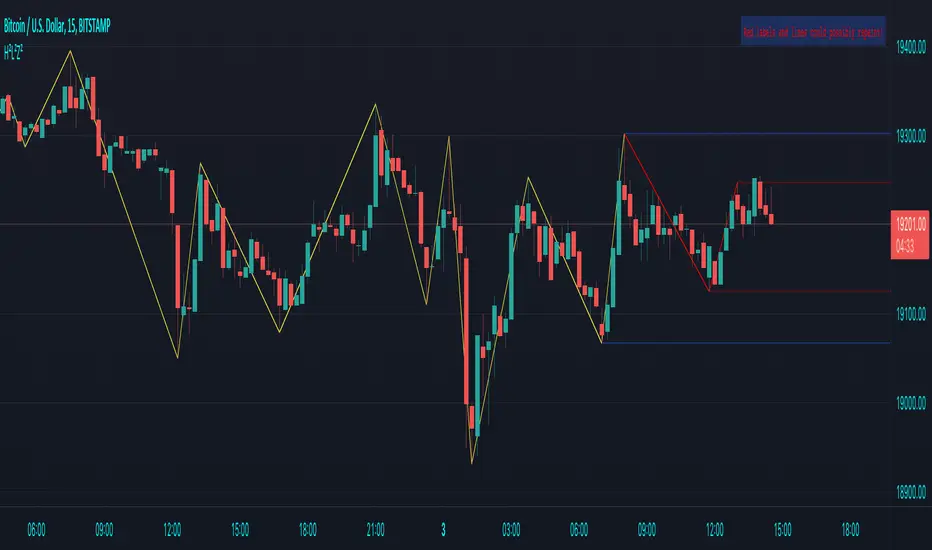
Volume EffectivenessI have been trying to work with volume as an indicator for quite some time, as it holds qualities as a 'leading indicator'.
However, please note that any indicator which to some extent predict a future trend has its issues as it can be misleading.
But, in some datasets in a selected timeframe the leading properties of volume as an indicator are useful.
So this script is not too complicated. It shows a numeric which resembles the 'effectiveness of volume' in moving price.
For example, if a small volume creates a large price change - the Volume Effectiveness indicator will be high and show a spike
Whereas, if a large volume creates a small price change - the Volume Effectiveness indicator will be low
I used 3 metrics to represent Volume Effectiveness (these are different colors on the bar chart)
One price difference is the absolute(high - low) for each bar
Another is the absolute(open - close)
The 'open-close' is smaller than the 'high-low', so note this when viewing the bar charts
The final metric depends on if the open is greater than the close or vice-versa
But it considers the 'absolute(high-low)' and the difference between the open and the high (or low) and the close and the low (or high)
So the final metric is the largest of the 3 metrics and is generally the most useful of the 3 however, the other 2 are displayed to provide a better understanding of what 'Volume Effectiveness' displays
Note, I use absolute values so they are only positive, i.e. there are no negative values to represent a price drop within a bar
So, why is this indicator useful - its because volume is a leading indicator
A decreasing volume tends to suggest a price change is coming
Also, when the volume within a bar is very small, its Volume Effectiveness tends to go very high
That means a small trade volume creates a relatively large change in price
This is ideal conditions for a big pump (or big dump - although this indicator seems to work better before pumps)
A large spike in the Volume Effectiveness is commonly/sometimes preceding a big pump
So watch this indicator - and if there is a big spike - evaluate other market conditions to consider getting into position
Large spikes in the Volume Effectiveness can precede big price changes and therefore can provide a leading indication before a pump or dump
Timeframe is important - I found on the daily timeframe this indicator did not provide sufficient lead to be useful. Similarly on the <15min timeframe the spikes were not highly correlated with pumps/dumps
However, in medium timeframes (15mins, 1hour, 4hours) this indicator can be useful for predicting sizeable price changes.

HhLl-OscilatorSimple oscillator which checks how many highs and how many lows the price is making. Parameters are as explained below:
lookback - Checks how many highs and lows it is making in these many bars. Sum of all highs and lows are taken for plotting.
periods - Initial period to check high and lows
multiples - Number of multiples on initial period for which highs and lows are checked
colorCandles - CandleColor based on the oscillator
If periods is 20 and multiples is 5 and loopback is 10
Indicator checks for last 10 bars how many highs/lows are made for 20, 40, 60, 80 and 100 periods. Sum of all highs and lows are plotted on the oscillator overlay

Expanded Floor PivotsHello Everyone,
The Expanded Floor Pivots is introduced in the book "Secrets of a Pivot Boss: Revealing Proven Methods for Profiting in the Market " by Franklin Ochoa. He added four new levels: S4, R4, BC and TC. There are many great ideas in the book, such using these levels, following trend, time price opportunity and much more. (Thanks to @tonyjab for pushing me to read this book)
The definition/formula of the levels defined in the book:
r1 = 2 * pivot - Low
r2 = pivot + (High - Low)
r3 = r1 + (High - Low)
r4 = r3 + (r2 - r1)
tc = (pivot - bc) + pivot
pivot = (High + Low + Close) / 3
bc = (High + Low) / 2
s1 = 2 * pivot - High
s2 = pivot - (High - Low)
s3 = s1 - (High - Low)
s4 = s3 - (s1 - s2)
The area between TC and BC is used as Pivot Channel, (blue area in the chart). you can see how it helps on identifying the trend.
Options:
By default the script decides Higher Time Frame but if you want you can set HTF as you wish.
You can choose line style as: Solid, Circles or Cross
and also you have option to show only last period or all historical levels.
Enjoy!

Volume Profile Free Ultra SLI (100 Levels Value Area VWAP) - RRBVolume Profile Free Ultra SLI by RagingRocketBull 2019
Version 1.0
This indicator calculates Volume Profile for a given range and shows it as a histogram consisting of 100 horizontal bars.
This is basically the MAX SLI version with +50 more Pinescript v4 line objects added as levels.
It can also show Point of Control (POC), Developing POC, Value Area/VWAP StdDev High/Low as dynamically moving levels.
Free accounts can't access Standard TradingView Volume Profile, hence this indicator.
There are several versions: Free Pro, Free MAX SLI, Free Ultra SLI, Free History. This is the Free Ultra SLI version. The Differences are listed below:
- Free Pro: 25 levels, +Developing POC, Value Area/VWAP High/Low Levels, Above/Below Area Dimming
- Free MAX SLI: 50 levels, 2x SLI modes for Buy/Sell or even higher res 150 levels
- Free Ultra SLI: 100 levels, packed to the limit, 2x SLI modes for Buy/Sell or even higher res 300 levels
- Free History: auto highest/lowest, historic poc/va levels for each session
Features:
- High-Res Volume Profile with up to 100 levels (line implementation)
- 2x SLI modes for even higher res: 300 levels with 3x vertical SLI, 100 buy/sell levels with 2x horiz SLI
- Calculate Volume Profile on full history
- POC, Developing POC Levels
- Buy/Sell/Total volume modes
- Side Cover
- Value Area, VAH/VAL dynamic levels
- VWAP High/Low dynamic levels with Source, Length, StdDev as params
- Show/Hide all levels
- Dim Non Value Area Zones
- Custom Range with Highlighting
- 3 Anchor points for Volume Profile
- Flip Levels Horizontally
- Adjustable width, offset and spacing of levels
- Custom Color for POC/VA/VWAP levels, Transparency for buy/sell levels
WARNING:
- Compilation Time: 1 min 20 sec
Usage:
- specify max_level/min_level/spacing (required)
- select range (start_bar, range length), confirm with range highlighting
- select volume type: Buy/Sell/Total
- select mode Value Area/VWAP to show corresponding levels
- flip/select anchor point to position the buy/sell levels
- use Horiz Buy/Sell SLI mode with 100 or Vertical SLI with 300 levels if needed
- use POC/Developing POC/VA/VWAP High/Low as S/R levels. Usually daily values from 1-3 days back are used as levels for the current day.
SLI:
use SLI modes to extend the functionality of the indicator:
- Horiz Buy/Sell 2x SLI lets you view 100 Buy/Sell Levels at the same time
- Vertical Max_Vol 3x SLI lets you increase the resolution to 300 levels
- you need at least 2 instances of the indicator attached to the same chart for SLI to work
1) Enable Horiz SLI:
- attach 2 indicator instances to the chart
- make sure all instances have the same min_level/max_level/range/spacing settings
- select volume type for each instance: you can have a buy/sell or buy/total or sell/total SLI. Make sure your buy volume instance is the last attached to be displayed on top of sell/total instances without overlapping.
- set buy_sell_sli_mode to true for indicator instances with volume_type = buy/sell, for type total this is optional.
- this basically tells the script to calculate % lengths based on total volume instead of individual buy/sell volumes and use ext offset for sell levels
- Sell Offset is calculated relative to Buy Offset to stack/extend sell after buy. Buy Offset = Zero - Buy Length. Sell Offset = Buy Offset - Sell Length = Zero - Buy Length - Sell Length
- there are no master/slave instances in this mode, all indicators are equal, poc/va levels are not affected and can work independently, i.e. one instance can show va levels, another - vwap.
2) Enable Vertical SLI:
- attach the first instance and evaluate the full range to roughly determine where is the highest max_vol/poc level i.e. 0..20000, poc is in the bottom half (third, middle etc) or
- add more instances and split the full vertical range between them, i.e. set min_level/max_level of each corresponding instance to 0..10000, 10000..20000 etc
- make sure all instances have the same range/spacing settings
- an instance with a subrange containing the poc level of the full range is now your master instance (bottom half). All other instances are slaves, their levels will be calculated based on the max_vol/poc of the master instance instead of local values
- set show_max_vol_sli to true for the master instance. for slave instances this is optional and can be used to check if master/slave max_vol values match and slave can read the master's value. This simply plots the max_vol value
- you can also attach all instances and set show_max_vol_sli to true in all of them - the instance with the largest max_vol should become the master
Auto/Manual Ext Max_Vol Modes:
- for auto vertical max_vol SLI mode set max_vol_sli_src in all slave instances to the max_vol of the master indicator: "VolumeProfileFree_MAX_RRB: Max Volume for Vertical SLI Mode". It can be tricky with 2+ instances
- in case auto SLI mode doesn't work - assign max_vol_sli_ext in all slave instances the max_vol value of the master indicator manually and repeat on each change
- manual override max_vol_sli_ext has higher priority than auto max_vol_sli_src when both values are assigned, when they are 0 and close respectively - SLI is disabled
- master/slave max_vol values must match on each bar at all times to maintain proper level scale, otherwise slave's levels will look larger than they should relative to the master's levels.
- Max_vol (red) is the last param in the long list of indicator outputs
- the only true max_vol/poc in this SLI mode is the master's max_vol/poc. All poc/va levels in slaves will be irrelevant and are disabled automatically. Slaves can only show VWAP levels.
- VA Levels of the master instance in this SLI mode are calculated based on the subrange, not the whole range and may be inaccurate. Cross check with the full range.
WARNING!
- auto mode max_vol_sli_src is experimental and may not work as expected
- you can only assign auto mode max_vol_sli_src = max_vol once due to some bug with unhandled exception/buffer overflow in Tradingview. Seems that you can clear the value only by removing the indicator instance
- sometimes you may see a "study in error state" error when attempting to set it back to close. Remove indicator/Reload chart and start from scratch
- volume profile may not finish to redraw and freeze in an ugly shape after an UI parameter change when max_vol_sli_src is assigned a max_vol value. Assign it to close - VP should redraw properly, but it may not clear the assigned max_vol value
- you can't seem to be able to assign a proper auto max_vol value to the 3rd slave instance
- 2x Vertical SLI works and tested in both auto/manual, 3x SLI - only manual seems to work (you can have a mixed mode: 2nd instance - auto, 3rd - manual)
Notes:
- This code uses Pinescript v3 compatibility framework
- This code is 20x-30x faster (main for cycle is removed) especially on lower tfs with long history - only 4-5 sec load/redraw time vs 30-60 sec of the old Pro versions
- Instead of repeatedly calculating the total sum of volumes for the whole range on each bar, vol sums are now increased on each bar and passed to the next in the range making it a per range vs per bar calculation that reduces time dramatically
- 100 levels consist of 50 main plot levels and 50 line objects used as alternate levels, differences are:
- line objects are always shown on top of other objects, such as plot levels, zero line and side cover, it's not possible to cover/move them below.
- all line objects have variable lengths, use actual x,y coords and don't need side cover, while all plot levels have a fixed length of 100 bars, use offset and require cover.
- all key properties of line objects, such as x,y coords, color can be modified, objects can be moved/deleted, while this is not possible for static plot levels.
- large width values cause line objects to expand only up/down from center while their length remains the same and stays within the level's start/end points similar to an area style.
- large width values make plot levels expand in all directions (both h/v), beyond level start/end points, sometimes overlapping zero line, making them an inaccurate % length representation, as opposed to line objects/plot levels with area style.
- large width values translate into different widths on screen for line objects and plot levels.
- you can't compensate for this unwanted horiz width expansion of plot levels because width uses its own units, that don't translate into bars/pixels.
- line objects are visible only when num_levels > 50, plot levels are used otherwise
- Since line objects are lines, plot levels also use style line because other style implementations will break the symmetry/spacing between levels.
- if you don't see a volume profile check range settings: min_level/max_level and spacing, set spacing to 0 (or adjust accordingly based on the symbol's precision, i.e. 0.00001)
- you can view either of Buy/Sell/Total volumes, but you can't display Buy/Sell levels at the same time using a single instance (this would 2x reduce the number of levels). Use 2 indicator instances in horiz buy/sell sli mode for that.
- Volume Profile/Value Area are calculated for a given range and updated on each bar. Each level has a fixed length. Offsets control visible level parts. Side Cover hides the invisible parts.
- Custom Color for POC/VA/VWAP levels - UI Style color/transparency can only change shape's color and doesn't affect textcolor, hence this additional option
- Custom Width - UI Style supports only width <= 4, hence this additional option
- POC is visible in both modes. In VWAP mode Developing POC becomes VWAP, VA High and Low => VWAP High and Low correspondingly to minimize the number of plot outputs
- You can't change buy/sell level colors from input (only transparency) - this requires 2x plot outputs => 2x reduces the number of levels to fit the max 64 limit. That's why 2 additional plots are used to dim the non Value Area zones
- You can change level transparency of line objects. Due to Pinescript limitations, only discrete values are supported.
- Inverse transp correlation creates the necessary illusion of "covered" line objects, although they are shown on top of the cover all the time
- If custom lines_transp is set the illusion will break because transp range can't be skewed easily (i.e. transp 0..100 is always mapped to 100..0 and can't be mapped to 50..0)
- transparency can applied to lines dynamically but nva top zone can't be completely removed because plot/mixed type of levels are still used when num_levels < 50 and require cover
- transparency can't be applied to plot levels dynamically from script this can be done only once from UI, and you can't change plot color for the past length bars
- All buy/sell volume lengths are calculated as % of a fixed base width = 100 bars (100%). You can't set show_last from input to change it
- Range selection/Anchoring is not accurate on charts with time gaps since you can only anchor from a point in the future and measure distance in time periods, not actual bars, and there's no way of knowing the number of future gaps in advance.
- Adjust Width for Log Scale mode now also works on high precision charts with small prices (i.e. 0.00001)
- in Adjust Width for Log Scale mode Level1 width extremes can be capped using max deviation (when level1 = 0, shift = 0 width becomes infinite)
- There's no such thing as buy/sell volume, there's just volume, but for the purposes of the Volume Profile method, assume: bull candle = buy volume, bear candle = sell volume
P.S. I am your grandfather, Luke! Now, join the Dark Side in your father's steps or be destroyed! Once more the Sith will rule the Galaxy, and we shall have peace...

PivotBoss Outside Reversal SetupPATTERN SUMMARY
1. The engulfing bar of a bullish outside reversal setup has a low that is below the prior bar's low (L < L ) and a
close that is above the prior bar's high (C > H ).
2. The engulfing bar of a bearish outside reversal setup has a high that is above the prior bar's high (H > H )
and a close that is below the prior bar's low (C < L ).
3. The engulfing bar is usually 5 to 25 percent larger than the size of the average bar in the lookback period.
PATTERN PSYCHOLOGY
The power behind this pattern lies in the psychology behind the traders involved in this setup. If you have
ever participated in a breakout at support or resistance only to have the market reverse sharply against you, then
you are familiar with the market dynamics of this setup. What exactly is going on at these levels? To understand
this concept is to understand the outside reversal pattern. Basically, market participants are testing the waters
above resistance or below support to make sure there is no new business to be done at these levels. When no
initiative buyers or sellers participate in range extension, responsive participants have all the information they
need to reverse price back toward a new area of perceived value.
As you look at a bullish outside reversal pattern, you will notice that the current bar's low is lower than the
prior bar's low. Essentially, the market is testing the waters below recently established lows to see if a downside
follow-through will occur. When no additional selling pressure enters the market, the result is a flood of buying
pressure that causes a springboard effect, thereby shooting price above the prior bar's highs and creating the
beginning of a bullish advance.
If you recall the child on the trampoline for a moment, you'll realize that the child had to force the bounce
mat down before he could spring into the air. Also, remember Jennifer the cake baker? She initially pushed price
to $20 per cake, which sent a flood of orders into her shop. The flood of buying pressure eventually sent the price
of her cakes to $35 apiece. Basically, price had to test the $20 level before it could rise to $35.
Let's analyze the outside reversal setup in a different light for a moment. One of the reasons I like this setup
is because the two-bar pattern reduces into the wick reversal setup, which we covered earlier in the chapter. If
you are not familiar with candlestick reduction, the idea is simple. You are taking the price data over two or more
candlesticks and combining them to create a single candlestick. Therefore, you will be taking the open, high, low,
and close prices of the bars in question to create a single composite candlestick.
Take a look at Figure 2.13, which illustrates the candlestick reduction of the outside reversal setup.
Essentially, taking the highest high and the lowest low over the two-bar period gives you the range of the
composite candlestick. Then, taking the opening price of the first candle and the closing price of the last candle
will finish off the composite candlestick. Depending on the structure of the bars of the outside reversal setup, the
result of the candlestick reduction will usually be the transformation into a wick reversal setup, which we know to
be quite powerful. Therefore, in many cases the physiology of the outside reversal pattern basically demonstrates
the inherent psychological traits of the wick reversal pattern. This is just another level of analysis that reinforces
my belief in the outside reversal setup.

Session Fibonacci Tracker with Dynamic Range FreezeSession Fibonacci Tracker with Dynamic Range Freeze
This indicator plots Fibonacci retracement and extension levels based on session high/low ranges with a unique "freeze" mechanism that locks levels during volatility and recalculates only when price returns to the established range.
How It Works:
The indicator uses a three-stage process to maintain stable Fibonacci levels:
Range Establishment: At the start of each session (default 1800 ET), the indicator tracks the session high and low. Fibonacci levels are calculated with dynamic anchoring - when price is above the session open, 0 anchors at the high with 1 at the low; when below, 0 anchors at the low with 1 at the high.
Freeze Mechanism: Once the range is established, it immediately freezes. If a candle closes outside this range, the Fibonacci levels remain locked at their current values even as new session highs or lows form. This prevents levels from constantly recalculating during trending moves.
Recalculation: The frozen range only updates when price action (high or low) touches back inside the established range. At this point, levels recalculate based on the current session high/low, then freeze again.
Key Features:
Customizable Fibonacci levels: All retracement (0.236, 0.382, 0.500, 0.618, 0.786) and extension levels (-1.0, -0.618, -0.272, 1.272, 1.618, 2.0) can be enabled/disabled and adjusted to custom values
Time-based line extension prevents historical buffer overflow errors
Works across all timeframes
Session start time fully customizable
Visual status indicator shows whether levels are frozen or active
All lines and labels are fully customizable (colors, width, labels, prices)
Use Cases:
This indicator is particularly useful for traders who want stable reference levels during volatile periods. Traditional Fibonacci tools recalculate with every new extreme, making them difficult to use as support/resistance during trends. This implementation keeps levels stable until price returns to consolidation, providing consistent reference points for entries, exits, and stop placement.
Settings:
Session Settings: Configure session start time (default 1800 ET)
Fibonacci Levels: Enable/disable and customize each retracement level value
Extension Levels: Enable/disable and customize each extension level value
Visual Settings: Adjust line extension, width, labels, and price display
Colors: Customize colors for open line, 0 level, 1 level, retracements, and extensions

FVG PilotWhat it does
Automatically detects and draws Fair Value Gaps (FVGs) on the chart.
Removes an FVG as soon as it’s invalidated (bullish FVG invalid if price closes below its lower bound; bearish FVG invalid if price closes above its upper bound).
Triggers alerts only during Silver Bullet (SB) sessions in Europe/Berlin time when a new FVG is created.
Optionally draws two thin vertical lines at the start and end of each SB session so you can see the windows at a glance.
Runs on confirmed bars to avoid repainting.
How FVGs are detected
Wick mode (default):
Bullish FVG when low > high → gap [high , low]
Bearish FVG when high < low → gap [high, low ]
Body mode (optional): uses candle bodies instead of wicks:
Bullish FVG when current body low > prior body high
Bearish FVG when current body high < prior body low
Silver Bullet sessions (Europe/Berlin)
Three configurable session windows (default examples):
SB1: 10:00–11:00
SB2: 02:00–03:00
SB3: 07:00–08:00
Alerts for new FVGs fire only inside these windows.
Session lines: a thin vertical line is drawn on the first bar inside a session (start) and on the first bar after a session (end).
Inputs
Show Bullish / Bearish FVGs
Use Bodies (instead of wicks)
Minimum FVG size (in ticks)
Box opacity
SB sessions: enable/disable each window and set times (Europe/Berlin)
Session line toggle + color/width
Alerts included
SB (Berlin): Bullish FVG created – fires only during SB sessions
SB (Berlin): Bearish FVG created – fires only during SB sessions
Bullish FVG invalidated – fires when a bullish FVG is invalidated (no time filter)
Bearish FVG invalidated – fires when a bearish FVG is invalidated (no time filter)
How to set alerts (TradingView)
Click Create Alert.
Condition: choose this indicator, then pick one of the alert conditions above.
Select your alert options (once per bar close is recommended), then Create.
Tips
If you don’t see boxes, reduce Minimum FVG size or lower opacity (e.g., 70–85).
Body mode is stricter; start with wicks if you want more signals.
SB windows use Europe/Berlin and automatically account for DST.
The script respects platform limits for drawings; if your chart is cluttered, zoom in or reduce active sessions.

Smart Money Concepts [MHA Finverse]A comprehensive Smart Money Concepts (SMC) indicator designed to identify institutional trading behavior and market structure shifts. This tool helps traders align with "smart money" by detecting key supply and demand zones, structural breaks, and liquidity patterns.
Core Features
Market Structure Analysis
- Real-time Internal Structure: Detects short-term BOS (Break of Structure) and CHoCH (Change of Character) with customizable filters
- Swing Structure: Identifies major trend shifts and structural breaks on higher timeframes
- Adjustable pivot detection with customizable swing point visualization
- Strong/Weak High/Low identification for bias confirmation
Order Blocks (OB)
- Internal and Swing Order Blocks with independent control
- Volume-based metrics showing OB strength and percentage contribution
- Two filtering methods: ATR-based and Cumulative Mean Range
- Flexible mitigation options (Close or High/Low)
- Display up to 20 order blocks per type with auto-cleanup on mitigation
- Color-coded zones with transparency control
Liquidity Detection
- Equal Highs (EQH) and Equal Lows (EQL) identification
- Threshold-based detection using ATR calculation
- Visual confirmation lines connecting equal levels
- Adjustable sensitivity and bar confirmation settings
Fair Value Gaps (FVG)
- Multi-timeframe FVG detection
- Auto-threshold calculation based on price momentum
- Bullish and Bearish gap visualization
- Extendable gap boxes for tracking unfilled imbalances
Premium & Discount Zones
- Automated premium, equilibrium, and discount zone plotting
- Based on current swing range extremes
- Visual representation of optimal entry zones
- Helps identify potential reversal and continuation areas
Multi-Timeframe Levels
- Previous Daily, Weekly, and Monthly High/Low levels
- Customizable line styles (solid, dashed, dotted)
- Independent color controls for each timeframe
- Auto-adjusted labels (PDH, PDL, PWH, PWL, PMH, PML)
Display Modes
- Historical Mode: Shows all past structures and maintains drawing history
- Present Mode: Displays only current active structures for cleaner charts
Visual Themes
- Colored: Full color customization for all elements
- Monochrome: Clean grey-scale design for minimal distraction
Smart Features
- Confluence filter for internal structure to reduce noise
- Automatic candle coloring based on market bias
- 16 pre-configured alert conditions for all major signals
- Efficient rendering with automatic cleanup of broken structures
- Independent control over each feature for modular usage
Use Cases
- Identify institutional entry and exit points through order blocks
- Spot potential reversals at premium/discount zones
- Confirm trend direction with BOS and CHoCH signals
- Find liquidity grabs at equal highs and lows
- Trade imbalances at fair value gaps
- Align entries with multi-timeframe key levels
Settings Organization
All features are neatly organized into logical groups:
- Smart Money Concepts (general settings)
- Real Time Internal Structure
- Real Time Swing Structure
- Order Blocks
- EQH/EQL
- Fair Value Gaps
- Highs & Lows MTF
- Premium & Discount Zones
Note: This indicator works on all timeframes and instruments. For optimal results, combine multiple SMC concepts together to find high-probability setups with confluence.
Credits
Special thanks to Dau_tu_hieu_goc and BigBeluga for their code examples and inspiration that contributed to the development of this indicator.
Disclaimer
This indicator is for educational purposes only and does not constitute financial advice. Trading involves substantial risk of loss. Past performance does not guarantee future results. Always use proper risk management and conduct your own analysis before making trading decisions. The developer is not responsible for any trading losses incurred.
Happy Trading

Session Sweep System – WarRoomXYZ V1WarRoom Session Sweep System v1 is a open-source institutional trading framework built to identify liquidity behavior across Asia, London, and New York sessions.
It combines session-based liquidity mapping, sweep detection, daily expansion modeling, and trend confirmation into a unified, timing-driven system optimized for XAUUSD, FX pairs, indices, and any instrument with session-dependent volatility.
This tool does not attempt to predict direction with arbitrary oscillators.
Instead, it focuses on the underlying market mechanisms that drive price:
liquidity, timing, expansion, and trend alignment.
Below is a detailed explanation of what the script does, how its components work, and how traders can use it effectively.
🔹 1. Session Liquidity Mapping
The script automatically identifies the Asia (00:00–06:00 GMT), London (07:00–12:00 GMT), and New York (13:00–17:00 GMT) sessions and builds real-time session ranges.
Each session creates a liquidity pool.
Trading institutions frequently sweep the high or low of one session before delivering the real move in the next session.
This script captures that behavior by:
►Drawing session range boxes
►Tracking previous session highs/lows
►Highlighting high-probability sweep locations
These ranges are essential reference points for timing entries and exits.
🔹 2. Liquidity Sweep Detection (Buy & Sell Sweeps)
The indicator identifies when price runs a previous session high/low and rejects back inside the range, which is commonly interpreted as a liquidity sweep.
The following sweep types are monitored:
►London sweeping Asia
►New York sweeping London
►Asia sweeping New York
►Daily sweep of PDH/PDL
Sweeps signal that liquidity has been collected and that a potential reversal or continuation is likely.
These are marked clearly on the chart for real-time decision-making.
🔹 3. Killzone Timing Model (GMT Time)
Market manipulation and expansion often occur during specific time windows.
The script highlights these institutional killzones:
►London Killzone: 07:00–10:00 GMT
►New York Killzone: 13:30–15:30 GMT
►NY PM Session: 19:00–21:00 GMT
Sweeps occurring inside these windows carry a significantly higher probability.
The timing layer helps filter out low-quality setups.
🔹 4. Daily Range & ADR Expansion Engine
A dedicated panel displays:
►Current day range
►ADR (Average Daily Range)
►Expansion stage (Early / Developed / Extended)
►PDH/PDL swept or intact
►Overall session bias
This allows traders to understand whether the daily move is likely to continue or reverse.
For example:
►Early expansion → trend continuation likely
►Extended expansion → reversal setups become more probable
This is useful for intraday targets and risk management.
🔹 5. MA Cloud Trend Model (Fast/Slow Structure)
To align liquidity behavior with directional conviction, the script includes a configurable MA engine:
►Fast & slow MA
►MA cloud
►Slope-based trend coloring
►Trend background
►MA cross alerts
The cloud provides trend confirmation without relying on oscillators.
Trades are higher quality when the sweep direction aligns with the MA trend.
🔹 6. How the Components Work Together
The script integrates several institutional concepts into one coherent model:
►Sessions define liquidity pools
►Sweeps identify stop-hunts and reversals
►Killzones define optimal timing
►MA Cloud confirms directional bias
►ADR engine indicates expansion potential
This creates a structured framework:
Sweep → Timing → Trend → Expansion → Execution
Each component strengthens the others, forming a robust decision-making model.
🔹 7. How to Use the Indicator (Practical Guide)
✔ Look for a sweep of a previous session level
When price runs a session high/low and closes back inside, liquidity has likely been collected.
✔ Confirm timing
Sweeps inside London or NY killzones tend to produce the strongest moves.
✔ Confirm trend
Use MA cloud direction and slope:
►Cloud green → long setups preferred
►Cloud red → short setups preferred
✔ Check ADR panel
If the day has already expanded significantly, reversal setups are more likely.
If expansion is still early, continuation setups are favored.
✔ Plan your trade
Common targets include:
►Opposite side of session range
►ADR High/Low
►PDH/PDL
Stops are typically placed beyond the sweep wick.
This creates a repeatable, rule-based approach to intraday liquidity trading.
🔹 8. Why This Script Is Original
This is not a mashup of existing open-source indicators.
It introduces:
►A custom session-linked liquidity sweep engine
►A structured daily expansion model
►Integrated killzone timing aligned with GMT
►A unified bias panel merging sweeps, ADR, and session manipulation
►A trend confirmation layer designed around session behavior
While it uses known institutional concepts, their integration, execution, and timing framework are unique, purpose-built, and not directly found in open-source scripts.
🔹 9. Suitable Markets
This indicator works best on:
►XAUUSD
►Major FX pairs
►US indices
►Synthetic markets with session cycles
Ideal timeframes: 1m, 5m, 15m, 30m
🔹 10. Limitations / Notes
This is an analytical tool, not a buy/sell signal generator
All sweeps are confirmed at candle close (non-repaint)
The tool assumes GMT session windows unless chart time differs
Users must practice risk management and entry triggers manually
Disclaimer
This script is provided for informational and educational purposes only. It does not provide financial, investment, or trading advice, and it does not guarantee profits or future performance. All decisions made based on this script are solely the responsibility of the user.
This script does not execute trades, manage risk, or replace the need for trader discretion. Market behavior can change quickly, and past behavior detected by the script does not ensure similar future outcomes.
Users should test the script on demo or simulation environments before applying it to live markets and must maintain full responsibility for their own risk management, position sizing, and trade execution.
Trading involves risk, and losses can exceed deposits. By using this script, you acknowledge that you understand and accept all associated risks.

Box TheoryBox Theory – Description
This indicator is based on the popular “Box Theory” concept, where the previous session’s High–Low range acts as the most important structure for the next session.
Traders use this because the market often reacts to the same areas where liquidity, orders, and imbalances were created in the prior session.
At every new session open, the indicator automatically records:
Previous High
Previous Low
Middle (50% level)
These three levels form a box, which becomes your roadmap for the new session.
This method is widely used because it highlights where most reversals, sweeps, and reactions occur—without needing any extra indicators.
How the Zones Are Calculated
Previous High
The highest price of the last session.
This forms the top edge, which acts as resistance and the basis for the Sell Zone.
Previous Low
The lowest price of the last session.
This forms the bottom edge, acting as support and the basis for the Buy Zone.
Middle Line (50% Level)
The exact midpoint between High and Low.
This is the fair-value zone, where price often consolidates and becomes directionless.
No signals are triggered near the middle, because trades taken here historically have low accuracy.
Buy Zone (Green Area)
The lower part of the box.
Price often reacts here because this area held buyers in the previous session.
When price enters this green zone inside the box, the indicator can show a Buy Zone label.
Sell Zone (Red Area)
The upper part of the box.
Price commonly rejects here because this area acted as resistance previously.
When price enters this red zone inside the box, the indicator can show a Sell Zone label.
How Zone Size Is Set (Sensitivity %)
You can adjust how big the Buy/Sell zones are using the Sensitivity (%) input.
Lower % → Smaller zones → More precise signals
Higher % → Larger zones → Signals appear earlier and from farther away
Formula:
Zone Size = (Previous High − Previous Low) × (Sensitivity % ÷ 100)
This lets you customize how tight or how early your signals appear.
Inside-Box Only Logic
The indicator only works inside the previous session’s range.
If price breaks above the previous High → No sell signal
If price breaks below the previous Low → No buy signal
This avoids false signals during breakouts or trending markets.
Alerts
The indicator includes two alerts:
Buy Zone Alert → Triggers when price enters the Buy Zone
Sell Zone Alert → Triggers when price enters the Sell Zone
Just enable them in TradingView’s alert panel.
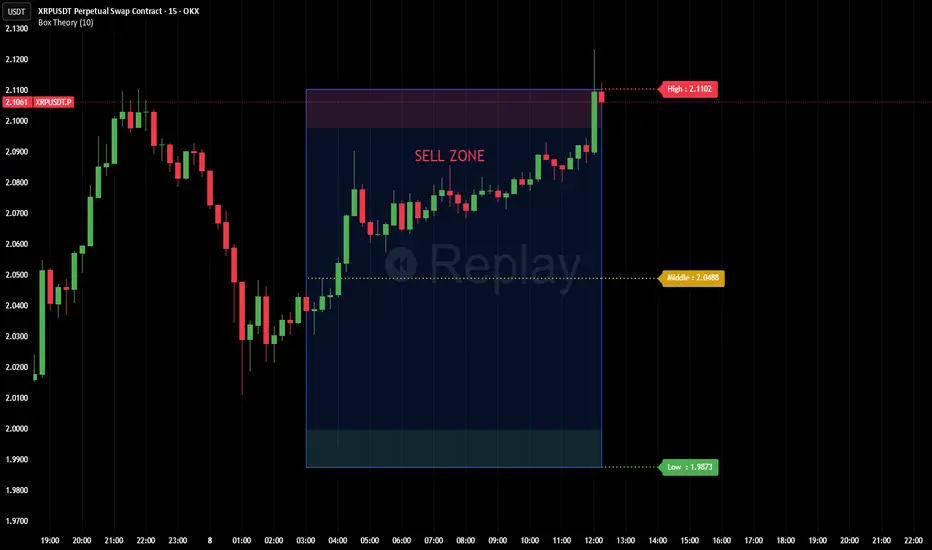
52 Week High LowPurpose
This indicator plots the rolling **52-week high and low price levels** to highlight long-term breakout zones, major support/resistance bands, and trend structure used by position and swing traders.
## How It Works
The script dynamically calculates:
- The highest high over the last ~260 trading sessions (52-week high)
- The lowest low over the last ~260 trading sessions (52-week low)
- Visual bands that update in real time as price evolves
## Best Timeframe
Optimized for **daily charts** to reflect true yearly price ranges.
Can be adapted to other timeframes using the bar-count inputs.
## Trading Applications
✅ Breakout confirmation tool
✅ Long-term trend validation
✅ Relative strength filter alignment
✅ RRG and momentum cross-checks
✅ Swing trade zone identification
## How To Use
1. Apply to daily charts.
2. Track price interaction with the 52-week bands.
3. Look for:
- Breakouts above the high band for trend continuation
- Pullbacks toward the high band for retest entries
- Rejections at the low band as breakdown confirmation
⚠️ This indicator maps key price structure — it does **not predict directional outcomes**.
Always combine with volume or momentum confirmation.
---
## Mathematical Basis
Rolling extreme calculations based on:
- **Highest high over N bars**
- **Lowest low over N bars**
N defaults to **52 weeks × 5 sessions = 260 bars** for daily charts.
---
Developed for professional retail traders seeking institutional-grade structural tools.

Session, Weekly, Daily LevelsScroll down for hungarian description!
Magyar leíráshoz görgess lejjebb!
Overview
This script provides a unified market structure mapping tool that automatically identifies and visualizes key intraday, daily, and weekly reference levels. It helps traders contextualize price action throughout the trading week by marking true session opens, previous day highs/lows, weekly highs/lows, and weekday opens, all with accurate historical anchoring and correct timezone handling.
What This Script Does
1. Intraday Session Opens (Tokyo, London, New York)
- Detects the exact candle where each session opens.
- Draws horizontal rays with labels.
- Automatically clears lines at the start of each new day.
- Uses a custom local-to-exchange timezone conversion system.
2. Weekly Levels
- Last week high and low (precise bar anchoring, not HTF aggregation)
- Current week open (also Monday open)
- Auto-reset on new week
- Levels are always drawn from the true candle where they formed.
3. Previous Day High & Low
- Continuously tracks intraday highs and lows.
- On a new day, stores yesterday’s values and anchors rays to the exact bars.
- Levels remain visible for the full current day and reset the next day.
4. Weekday Opens (Tue–Fri)
- Captures the exact opening price of Tuesday–Friday.
- Monday open = Week open, so it is not shown separately.
- Auto-reset on new week.
Timezone Logic (Original Feature)
The script converts:
local session times → exchange timezone → chart timestamps
It works correctly regardless of chart timezone or instrument exchange location.
Line Drawing Logic
- Finds the exact bar_index where each level forms.
- Draws rays extending to the right.
- Labels are placed ahead of price.
- Safe updating prevents “bar index too far” errors.
How to Use
- Identify daily/weekly structure.
- Track bias relative to session opens.
- Observe reactions around weekday opens.
- Compare price action to last week's range.
Originality
- Custom timezone conversion engine.
- True historical bar anchoring.
- Fully automated weekly/daily structural resets.
- Independent styling for each level type.
- Not a mashup; all components follow one unified logic.
Limitations
- Does not predict trend or direction.
- Structural tool only.
Summary
A precise and reliable market structure tool that unifies weekly, daily, and intraday reference levels with full timezone automation and true-candle anchoring.
MAGYAR LEÍRÁS
--------------
Áttekintés
Ez az indikátor egy összetett piaci szerkezet-feltérképező eszköz, amely automatikusan megjeleníti a legfontosabb intraday, napi és heti referenciaértékeket. A célja, hogy a kereskedő tisztán lássa a piac aktuális környezetét: hol nyíltak a főbb devizapiaci szekciók, hogyan alakult a tegnapi tartomány, hol volt a múlt heti csúcs/mélypont, és hogyan nyitottak az egyes hétköznapok.
Mit tud a script?
1. Szekciónyitások (Tokyo, London, New York)
- Megkeresi a pontos gyertyát, amely a szekciónyitáskori árat tartalmazza.
- Vízszintes vonalat és címkét rajzol.
- Minden nap elején automatikusan törli a korábbi nap szintjeit.
- Egyedi időzóna-konverziós rendszerrel működik (helyi idő → tőzsdei idő → chart idő).
2. Heti szintek
- Múlt heti maximum és minimum (pontos gyertyapontra horgonyozva)
- Aktuális heti nyitóár (egyben a hétfői nyitó is)
- Új hét kezdetekor automatikusan frissül.
- A múlt heti high/low nem fix időpontra, hanem a valódi gyertyára kerül.
3. Előző napi High és Low
- Folyamatosan követi a napi maximumot és minimumot.
- Napváltáskor elmenti és pontos gyertyáról indítja a ray-t.
- A szintek a teljes nap folyamán megmaradnak, majd a következő nap törlődnek.
4. Hétköznapok nyitóárai (Kedd–Péntek)
- A kedd, szerda, csütörtök és péntek nyitóárát rögzíti és megjeleníti.
- A hétfői nyitó a Week Open, ezért külön nem jelenik meg.
- Heti váltáskor automatikusan törlődnek.
Időzóna-kezelés (egyedi megoldás)
A script a felhasználó helyi idejét átszámítja az instrumentum tőzsdei időzónájára, majd a chartra vetíti.
Ez biztosítja, hogy minden szekciónyitás helyesen jelenik meg, bármely chart vagy instrumentum esetén.
Vonalrajzolási logika
- A szintek a valódi bar_index alapján kerülnek rögzítésre.
- Jobbra nyúló ray-eket rajzol.
- A címkék mindig a jobb oldalon, előre helyezve jelennek meg.
- Biztonságos frissítési rendszer akadályozza meg a hibákat (pl. “bar index too far”).
Használat
- Napi/heti szerkezet meghatározása.
- Bias követése a session openekhez viszonyítva.
- Reakciók figyelése a hétköznapok nyitóárai körül.
- Összevetés a múlt heti tartománnyal.
Eredetiség
- Egyedi időzóna-kezelő motor.
- Igazi gyertyapont-alapú horgonyzás.
- Automatikus napi/heti reset.
- Minden szint külön stílusban konfigurálható.
- Nem mashup; egységes rendszer.
Összegzés
Professzionális, pontos eszköz a piaci szerkezet feltérképezésére, amely egyesíti a heti, napi és intraday szinteket, teljes időzóna-automatizálással és gyertyapontra horgonyzott kijelölésekkel.

Kaufman Adaptive Moving Average + ART**Kaufman Adaptive Moving Average (fixed TF) + ATR Volatility Bands**
This script is a Pine Script v5 extension of the original *Kaufman Adaptive Moving Average* by Alex Orekhov (everget).
It adds:
* a **fixed timeframe option** for KAMA
* a separate **ATR panel under the chart**
* **configurable ATR volatility levels** with dynamic coloring.
KAMA adapts its smoothing to market conditions: it speeds up in strong trends and slows down in choppy phases. Here, KAMA can be calculated on any timeframe (e.g. 1D) and overlaid on a lower-timeframe chart (e.g. 1H), so you can track higher-TF trend structure while trading intraday.
The ATR panel visualizes volatility in the same or a separate timeframe and highlights phases of high/low volatility based on user-defined thresholds.
---
### Features
**KAMA (on chart)**
* Standard KAMA parameters: `Length`, `Fast EMA Length`, `Slow EMA Length`, `Source`
* Input: **KAMA Timeframe**
* empty → uses chart timeframe
* any value (e.g. `60`, `240`, `D`, `W`) → calculates KAMA on that fixed TF and maps it to the chart
* Color-changing KAMA line:
* **green** when the selected-TF KAMA is rising
* **red** when it is falling
* Optional *Await Bar Confirmation* to avoid reacting to still-forming bars
* Built-in alert when the KAMA color changes (potential trend shift).
**ATR panel (separate window under the chart)**
* Own inputs: `Show ATR`, `ATR Length`
* **ATR Timeframe** input:
* empty → ATR uses the same TF as KAMA
* custom value → fully independent ATR timeframe
* Two user-defined volatility levels:
* `ATR High Vol Level` – threshold for **high volatility**
* `ATR Low Vol Level` – threshold for **low volatility**
* ATR line coloring:
* **red** when ATR > High Vol Level (high volatility regime)
* **green** when ATR < Low Vol Level (quiet market)
* **blue** in the normal range between the two levels.
---
### How to use
1. Add the script to your chart.
2. Choose a **KAMA Timeframe** (leave empty for chart TF, or set to a higher TF for multi-timeframe trend following).
3. Optionally set a different **ATR Timeframe** to monitor volatility on yet another TF.
4. Adjust `ATR High Vol Level` and `ATR Low Vol Level` to match the instrument and timeframe you trade.
5. Use:
* the **KAMA color changes** as trend / regime signals, and
* the **ATR colors & levels** to quickly see whether you’re trading in a low-, normal- or high-volatility environment.
This combination is designed to keep the chart itself clean (only KAMA on price) while giving you a dedicated volatility dashboard directly underneath.

Fibonacci Degree System This Pine Script creates a sophisticated technical analysis tool that combines Fibonacci retracements with a degree-based cycle system. Here's a comprehensive breakdown:
Core Concept
The indicator maps price movements onto a 360-degree circular framework, treating market cycles like geometric angles. It creates a visual "mesh" where Fibonacci ratios intersect in both price (horizontal) and time (vertical) dimensions.
How It Works
1. Finding Reference Points
The script looks back over a specified period (default 100 bars) to identify:
Highest High: The peak price point
Lowest Low: The trough price point
Time Locations: Exactly which bars these extremes occurred on
These two points form the boundaries of your analysis window.
2. Creating the Fibonacci Grid
Horizontal Lines (Price Levels):
The script divides the price range between high and low into seven key Fibonacci ratios:
0% (Low) - Bottom boundary in red
23.6% - Minor retracement in orange
38.2% - Shallow retracement in yellow
50% - Midpoint in lime green
61.8% - Golden ratio in aqua (most significant)
78.6% - Deep retracement in blue
100% (High) - Top boundary in purple
Each line represents a potential support/resistance level where price might react.
Vertical Lines (Time Cycles):
The same Fibonacci ratios are applied to the time dimension between the high and low bars. If your high and low are 50 bars apart, vertical lines appear at:
Bar 0 (0%)
Bar 12 (23.6%)
Bar 19 (38.2%)
Bar 25 (50%)
Bar 31 (61.8%)
Bar 39 (78.6%)
Bar 50 (100%)
These suggest when price might make significant moves.
3. The Degree Mapping System
The innovative feature maps the time progression to degrees:
0° = Start point (0% time)
85° = 23.6% through the cycle
138° = 38.2% through the cycle
180° = Midpoint (50%)
222° = 61.8% through the cycle (golden angle)
283° = 78.6% through the cycle
360° = Complete cycle (100%)
This treats market movements as circular patterns, similar to how planets orbit or pendulums swing.
Visual Output
When you apply this indicator, you'll see:
A rectangular mesh extending beyond your high-low range (by 150% default)
Color-coded horizontal lines showing price Fibonacci levels
Matching vertical lines showing time Fibonacci intervals
Price labels on the right showing percentage levels
Degree labels at the bottom showing the angular position in the cycle
Intersection points creating a grid of potentially significant price-time coordinates
Trading Application
Traders use this to identify:
Support/Resistance Zones: Where horizontal and vertical lines intersect
Time Targets: When price might reverse (at vertical Fibonacci times)
Cycle Completion: When approaching 360°, a new cycle may begin
Harmonic Patterns: Geometric relationships between price and time
Customization Features
The script offers extensive control:
Lookback period: Adjust cycle length (10-500 bars)
Mesh extension: How far to project the grid forward
Visual toggles: Show/hide horizontal lines, vertical lines, labels
Styling: Line thickness, style (solid/dashed/dotted), colors
Label positioning: Fine-tune text placement for readability
The intersection at 61.8% time and 61.8% price at 222° becomes a key target zone.
This tool essentially converts the abstract concept of market cycles into a concrete, visual geometric framework that traders can analyze and act upon.
DISCLAIMER: This information is provided for educational purposes only and should not be considered financial, investment, or trading advice.
No guarantee of profits: Past performance and theoretical models do not guarantee future results. Trading and investing involve substantial risk of loss.
Not a recommendation: This script illustration does not constitute a recommendation to buy, sell, or hold any financial instrument.
Do your own research: Always conduct thorough independent research and consider consulting with a qualified financial advisor before making any trading decisions.

Float Rotation TrackerFloat Rotation Tracker - Quick Reference Guide
What is Float Rotation?
Float Rotation = Cumulative Daily Volume ÷ Float
Example:
Float = 5,000,000 shares
Day Volume = 7,500,000 shares
Rotation = 7.5M ÷ 5M = 1.5x (150%)
When rotation hits 1x (100%), every available share has theoretically changed hands at least once during the trading day.
Why It Matters
RotationMeaningImplication0.5x50% of float tradedInterest building1.0x 🔥Full rotationExtreme interest confirmed2.0x 🔥🔥Double rotationVery high volatility3.0x 🔥🔥🔥Triple rotationRare - maximum volatility
Key insight: High rotation on a low-float stock = explosive potential
Float Classification
Float SizeClassificationRotation Impact≤ 2M🔥 MICROExtremely volatile, fast rotation≤ 5M🔥 VERY LOWExcellent momentum potential≤ 10MLOWGood for rotation plays> 10MNORMALNeeds massive volume to rotate
Rule of thumb: Focus on stocks with float under 10M for meaningful rotation signals.
Reading the Indicator
Rotation Line (Yellow)
Shows current rotation level
Rises throughout the day as volume accumulates
Crosses horizontal level lines at milestones
Level Lines
LineColorMeaning0.5Gray dotted50% rotation1.0Orange solidFull rotation2.0Red solidDouble rotation3.0Fuchsia solidTriple rotation
Volume Bars (Bottom)
ColorMeaningGrayBelow average volumeBlueNormal volume (1-2x avg)GreenHigh volume (2-5x avg)LimeExtreme volume (5x+ avg)
Milestone Markers
Circles appear when rotation crosses key levels
Labels show "50%", "1x", "2x", "3x🔥"
Background Color
Changes as rotation increases
Darker = higher rotation level
Info Table Explained
FieldDescriptionFloatShare count + classification (MICRO/LOW/NORMAL)SourceAuto ✓ = TradingView data / Manual = user enteredRotationCurrent rotation with emoji indicatorRotation %Same as rotation × 100Day VolumeCumulative volume todayTo XxVolume needed to reach next milestoneBar RVolCurrent bar's relative volumeMilestonesWhich levels have been hit todayPer RotationShares equal to one full rotationEst. TimeBars until next milestone (at current pace)
Trading with Float Rotation
Entry Signals
Early Entry (Higher Risk, Higher Reward)
Rotation approaching 0.5x
Strong price action (bull flag, breakout)
Rising relative volume bars
Confirmation Entry (Lower Risk)
Rotation at or above 1x
Price holding above VWAP
Continuous green/lime volume bars
Late Entry (Highest Risk)
Rotation above 2x
Only enter on clear pullback pattern
Tight stop required
Exit Signals
Warning Signs:
Rotation very high (2x+) with declining volume bars
Reversal candle after milestone
Price breaking below key support
Volume bars turning gray/blue after being green/lime
Take Profits:
Partial profit at each rotation milestone
Trail stop as rotation increases
Full exit on reversal pattern after 2x+ rotation
Best Setups
Ideal Float Rotation Play
✓ Float under 10M (preferably under 5M)
✓ Stock up 5%+ on the day
✓ News catalyst driving interest
✓ Rotation approaching or exceeding 1x
✓ Price above VWAP
✓ Volume bars green or lime
✓ Clear chart pattern (bull flag, flat top)
Red Flags to Avoid
✗ Float over 50M (hard to rotate meaningfully)
✗ Rotation high but price declining
✗ Volume bars turning gray after spike
✗ No clear catalyst
✗ Price below VWAP with high rotation
✗ Late in day (3pm+) after 2x rotation
Float Data Sources
If auto-detect doesn't work, get float from:
SourceHow to FindFinvizfinviz.com → ticker → "Shs Float"Yahoo FinanceFinance.yahoo.com → Statistics → "Float"MarketWatchMarketwatch.com → ticker → ProfileYour BrokerUsually in stock details/fundamentals
Note: Float can change due to offerings, buybacks, lockup expirations. Check recent data.
Settings Guide
Conservative Settings
Alert Level 1: 0.75 (75%)
Alert Level 2: 1.0 (100%)
Alert Level 3: 2.0 (200%)
Alert Level 4: 3.0 (300%)
High Vol Multiplier: 2.0
Extreme Vol Multiplier: 5.0
Aggressive Settings
Alert Level 1: 0.3 (30%)
Alert Level 2: 0.5 (50%)
Alert Level 3: 1.0 (100%)
Alert Level 4: 2.0 (200%)
High Vol Multiplier: 1.5
Extreme Vol Multiplier: 3.0
Alert Setup
Recommended Alerts
100% Rotation (1x) - Primary signal
Most important milestone
Confirms extreme interest
High Rotation + Extreme Volume
Combined condition
Very high probability signal
How to Set
Right-click chart → Add Alert
Condition: Float Rotation Tracker
Select desired milestone
Set notification (popup/email/phone)
Set expiration
Common Questions
Q: Why is my float showing "Manual (no data)"?
A: TradingView doesn't have float data for this stock. Enter the float manually in settings after looking it up on Finviz or Yahoo Finance.
Q: The rotation seems too high/low - is the float wrong?
A: Possibly. Cross-check float on Finviz. Recent offerings or share structure changes may not be reflected in TradingView's data.
Q: What if float rotates early in the day?
A: Early 1x rotation (within first hour) is very bullish - indicates massive interest. Watch for continuation patterns.
Q: High rotation but price is dropping?
A: This is distribution - large holders are selling into demand. High rotation doesn't guarantee price direction, just volatility.
Q: Can I use this for swing trading?
A: The indicator resets daily, so it's designed for intraday use. You could note multi-day rotation patterns manually.
Quick Decision Matrix
RotationPrice ActionVolumeDecision<0.5xStrong upHighWatch, early stage0.5-1xConsolidatingSteadyPrepare entry1x+Breaking outIncreasingEntry on pattern1x+DroppingHighAvoid - distribution2x+Strong upExtremePartial profit, trail stop2x+Reversal candleDecliningExit or avoid
Workflow Integration
MORNING ROUTINE:
1. Scan for gappers (5%+, high volume)
2. Check float on each candidate
3. Apply Float Rotation Tracker
4. Prioritize lowest float with building rotation
DURING SESSION:
5. Watch rotation levels on active trades
6. Enter on patterns when rotation confirms (0.5-1x)
7. Scale out as rotation increases
8. Exit or trail after 2x rotation
END OF DAY:
9. Note which stocks hit 2x+ rotation
10. Review rotation vs price action
11. Learn patterns for future trades
Combining with Other Indicators
IndicatorHow to Use Together5 PillarsScreen for low-float stocks firstGap & GoCheck rotation on gappersBull FlagEnter bull flags with 1x+ rotationVWAPOnly trade rotation plays above VWAPRSIWatch for divergence at high rotation
Key Takeaways
Float size matters - Lower float = faster rotation = more volatility
1x is the key level - Full rotation confirms extreme interest
Volume quality matters - Green/lime bars better than gray
Combine with price action - Rotation confirms, patterns trigger
Know when you're late - 2x+ rotation is late stage
Check your float data - Wrong float = wrong rotation calculation
Happy Trading! 🔥

Gap & Go Day Trading Tool - Key Levels, Alerts & Setup GradingVisualizes Gap & Go setups with automatic gap detection, pre-market levels, and breakout signals. Shows: ✅ Gap % with quality rating (5%/10%/20%+) ✅ Pre-market high/low ✅ First candle range ✅ 50% gap fill target ✅ VWAP ✅ Relative volume. Includes setup grading system (A+ to C), entry signals on PM high breakouts, and 6 customizable alerts. Perfect for momentum day traders focusing on gapping stocks.
Full Description
█ OVERVIEW
The Gap & Go indicator automatically identifies and visualizes gap trading setups - one of the most popular momentum day trading strategies. When a stock gaps up significantly from the prior close, it often signals strong buying interest and potential for continuation moves.
This indicator displays all the key levels you need to trade gaps effectively, grades setup quality, and alerts you to breakout opportunities.
█ HOW IT WORKS
The indicator calculates the gap percentage between yesterday's close and today's open, then displays critical support/resistance levels that gap traders watch:
Gap Zone → The price range between prior close and gap open
Pre-Market High/Low → Key breakout and support levels from extended hours
First Candle Range → Opening range that often defines intraday direction
50% Gap Fill → Common retracement target and support level
VWAP → Institutional reference point
█ GAP CLASSIFICATION
Gaps are automatically classified by magnitude:
🔥 Qualifying Gap (5%+) → Meets minimum threshold for gap trading
🔥🔥 Strong Gap (10%+) → Ideal gap size for momentum plays
🔥🔥🔥 Monster Gap (20%+) → Exceptional move requiring extra attention
Background color changes based on gap quality for instant visual identification.
█ SETUP GRADING SYSTEM
The indicator grades each setup from A+ to C based on multiple factors:
- Gap magnitude (qualifying vs strong)
- Relative volume (2x+ vs 5x+ average)
- Price position relative to VWAP
A+ Setup (4-5 points) → High probability
A Setup (3 points) → Good setup
B Setup (2 points) → Moderate
C Setup (0-1 points) → Weak/avoid
█ ENTRY SIGNALS
Triangle signals appear when price breaks above key levels:
▲ Lime Triangle → Breaking above Pre-Market High
▲ Aqua Triangle → Breaking above First Candle High
Signals require volume confirmation by default (configurable).
█ KEY LEVELS DISPLAYED
- Prior Close (Orange) → Gap reference point
- Pre-Market High (Lime) → Primary breakout level
- Pre-Market Low (Red) → Support if gap fails
- First Candle Range (Aqua box) → Opening range breakout levels
- 50% Gap Fill (Yellow dotted) → Common support/target
- VWAP (Purple) → Institutional pivot
█ INFO TABLE
Real-time dashboard showing:
- Gap % with quality emoji
- Relative Volume with status
- All key price levels
- Breakout status (✓ if broken)
- Distance from PM High
- Setup Grade
█ ALERTS INCLUDED
6 customizable alerts:
1. Qualifying Gap Detected (5%+)
2. Strong Gap Detected (10%+)
3. Monster Gap Detected (20%+)
4. Pre-Market High Breakout
5. First Candle High Breakout
6. 50% Gap Fill Test
7. Full Gap Fill (setup invalidated)
█ SETTINGS
Gap Settings
- Minimum gap % threshold
- Strong gap % threshold
- Monster gap % threshold
Volume Settings
- Enable/disable relative volume filter
- Minimum RVol requirement
- Strong RVol threshold
- RVol calculation period
Level Settings
- Toggle each level type on/off
- Show/hide gap zone
- Show/hide VWAP
Signal Settings
- Breakout signal type (PM High, First Candle, Both)
- Volume confirmation requirement
Visual Settings
- Info table position
- Color customization for all levels
█ HOW TO USE
1. Scan for gapping stocks pre-market (use a scanner or watchlist)
2. Apply this indicator to candidates
3. Check the Setup Grade in the info table
4. Wait for price to consolidate near pre-market high
5. Enter on breakout above PM High with volume confirmation
6. Use 50% gap fill or PM Low as stop loss reference
7. Monitor VWAP - staying above is bullish
█ BEST PRACTICES
✓ Focus on A and A+ setups
✓ Require strong relative volume (5x+)
✓ Trade in the direction of the gap (long for gap ups)
✓ Watch for gap fill as potential support
✓ Be cautious if price falls below VWAP
✓ First 30-60 minutes typically have best momentum
█ TIMEFRAME RECOMMENDATIONS
- 1-minute: Scalping, precise entries
- 5-minute: Most common for gap trading (recommended)
- 15-minute: Swing entries, less noise
█ NOTES
- Pre-market levels require extended hours data enabled
- First candle range is based on the first regular market candle
- Works on stocks, ETFs, and futures
- Gaps down are detected but focus is on gap-up setups
█ DISCLAIMER
This indicator is for educational purposes only. Gap trading involves significant risk. Past performance does not guarantee future results. Always use proper risk management and never risk more than you can afford to lose.
