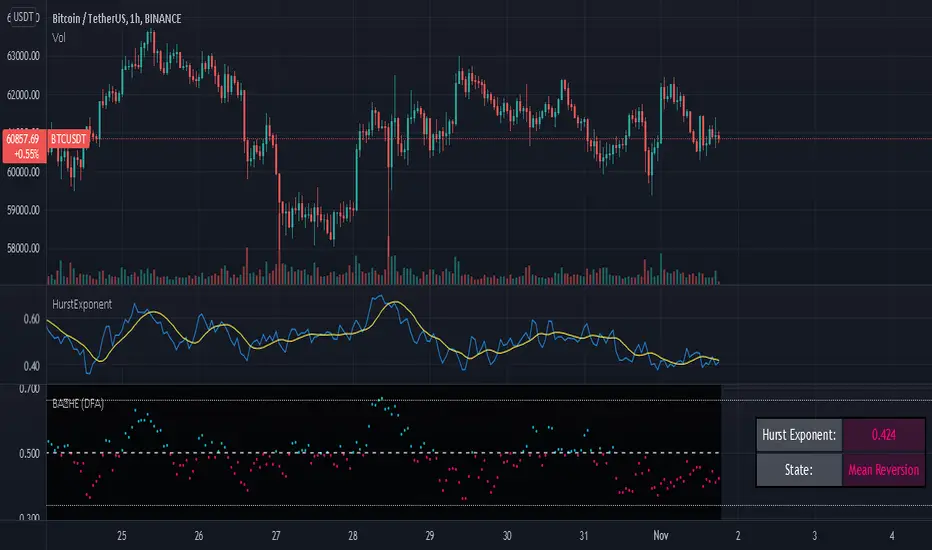
Hurst-Optimized Adaptive Channel [Kodexius]Hurst-Optimized Adaptive Channel (HOAC) is a regime-aware channel indicator that continuously adapts its centerline and volatility bands based on the market’s current behavior. Instead of using a single fixed channel model, HOAC evaluates whether price action is behaving more like a trend-following environment or a mean-reverting environment, then automatically selects the most suitable channel structure.
At the core of the engine is a robust Hurst Exponent estimation using R/S (Rescaled Range) analysis. The Hurst value is smoothed and compared against user-defined thresholds to classify the market regime. In trending regimes, the script emphasizes stability by favoring a slower, smoother channel when it proves more accurate over time. In mean-reversion regimes, it deliberately prioritizes a faster model to react sooner to reversion opportunities, similar in spirit to how traders use Bollinger-style behavior.
The result is a clean, professional adaptive channel with inner and outer bands, dynamic gradient fills, and an optional mean-reversion signal layer. A minimalist dashboard summarizes the detected regime, the current Hurst reading, and which internal model is currently preferred.
🔹 Features
🔸 Robust Regime Detection via Hurst Exponent (R/S Analysis)
HOAC uses a robust Hurst Exponent estimate derived from log returns and Rescaled Range analysis. The Hurst value acts as a behavioral filter:
- H > Trend Start threshold suggests trend persistence and directional continuation.
- H < Mean Reversion threshold suggests anti-persistence and a higher likelihood of reverting toward a central value.
Values between thresholds are treated as Neutral, allowing the channel to remain adaptive without forcing a hard bias.
This regime framework is designed to make the channel selection context-aware rather than purely reactive to recent volatility.
🔸 Dual Channel Engine (Fast vs Slow Models)
Instead of relying on one fixed channel, HOAC computes two independent channel candidates:
Fast model: shorter WMA basis and standard deviation window, intended to respond quickly and fit more reactive environments.
Slow model: longer WMA basis and standard deviation window, intended to reduce noise and better represent sustained directional flow.
Each model produces:
- A midline (basis)
- Outer bands (wider deviation)
- Inner bands (tighter deviation)
This structure gives you a clear core zone and an outer envelope that better represents volatility expansion.
🔸 Rolling Optimization Memory (Model Selection by Error)
HOAC includes an internal optimization layer that continuously measures how well each model fits current price action. On every bar, each model’s absolute deviation from the basis is recorded into a rolling memory window. The script then compares total accumulated error between fast and slow models and prefers the one with lower recent error.
This approach does not attempt curve fitting on multiple parameters. It focuses on a simple, interpretable metric: “Which model has tracked price more accurately over the last X bars?”
Additionally:
If the regime is Mean Reversion, the script explicitly prioritizes the fast model, ensuring responsiveness when reversals matter most.
🔸 Optional Output Smoothing (User-Selectable)
The final selected channel can be smoothed using your choice of:
- SMA
- EMA
- HMA
- RMA
This affects the plotted midline and all band outputs, allowing you to tune visual stability and responsiveness without changing the underlying decision engine.
🔸 Premium Visualization Layer (Inner Core + Outer Fade)
HOAC uses a layered band design:
- Inner bands define the core equilibrium zone around the midline.
- Outer bands define an extended volatility envelope for extremes.
Gradient fills and line styling help separate the core from the extremes while staying visually clean. The midline includes a subtle glow effect for clarity.
🔸 Adaptive Bar Tinting Strength (Regime Intensity)
Bar coloring dynamically adjusts transparency based on how far the Hurst value is from 0.5. When market behavior is more decisively trending or mean-reverting, the tint becomes more pronounced. When behavior is closer to random, the tint becomes more subtle.
🔸 Mean-Reversion Signal Layer
Mean-reversion signals are enabled when the environment is not classified as Trending:
- Buy when price crosses back above the lower outer band
- Sell when price crosses back below the upper outer band
This is intentionally a “return to channel” logic rather than a breakout logic, aligning signals with mean-reversion behavior and avoiding signals in strongly trending regimes by default.
🔸 Minimalist Dashboard (HUD)
A compact table displays:
- Current regime classification
- Smoothed Hurst value
- Which model is currently preferred (Fast or Slow)
- Trend flow direction (based on midline slope)
🔹 Calculations
1) Robust Hurst Exponent (R/S Analysis)
The script estimates Hurst using a Rescaled Range approach on log returns. It builds a returns array, computes mean, cumulative deviation range (R), standard deviation (S), then converts RS into a Hurst exponent.
calc_robust_hurst(int length) =>
float r = math.log(close / close )
float returns = array.new_float(length)
for i = 0 to length - 1
array.set(returns, i, r )
float mean = array.avg(returns)
float cumDev = 0.0
float maxCD = -1.0e10
float minCD = 1.0e10
float sumSqDiff = 0.0
for i = 0 to length - 1
float val = array.get(returns, i)
sumSqDiff += math.pow(val - mean, 2)
cumDev += (val - mean)
if cumDev > maxCD
maxCD := cumDev
if cumDev < minCD
minCD := cumDev
float R = maxCD - minCD
float S = math.sqrt(sumSqDiff / length)
float RS = (S == 0) ? 0.0 : (R / S)
float hurst = (RS > 0) ? (math.log10(RS) / math.log10(length)) : 0.5
hurst
This design avoids simplistic proxies and attempts to reflect persistence (trend tendency) vs anti-persistence (mean reversion tendency) from the underlying return structure.
2) Hurst Smoothing
Raw Hurst values can be noisy, so the script applies EMA smoothing before regime decisions.
float rawHurst = calc_robust_hurst(i_hurstLen)
float hVal = ta.ema(rawHurst, i_smoothHurst)
This stabilized hVal is the value used across regime classification, dynamic visuals, and the HUD display.
3) Regime Classification
The smoothed Hurst reading is compared to user thresholds to label the environment.
string regime = "NEUTRAL"
if hVal > i_trendZone
regime := "TRENDING"
else if hVal < i_chopZone
regime := "MEAN REV"
Higher Hurst implies more persistence, so the indicator treats it as a trend environment.
Lower Hurst implies more mean-reverting behavior, so the indicator enables MR logic and emphasizes faster adaptation.
4) Dual Channel Models (Fast and Slow)
HOAC computes two candidate channel structures in parallel. Each model is a WMA basis with volatility envelopes derived from standard deviation. Inner and outer bands are created using different multipliers.
Fast model (more reactive):
float fastBasis = ta.wma(close, 20)
float fastDev = ta.stdev(close, 20)
ChannelObj fastM = ChannelObj.new(fastBasis, fastBasis + fastDev * 2.0, fastBasis - fastDev * 2.0, fastBasis + fastDev * 1.0, fastBasis - fastDev * 1.0, math.abs(close - fastBasis))
Slow model (more stable):
float slowBasis = ta.wma(close, 50)
float slowDev = ta.stdev(close, 50)
ChannelObj slowM = ChannelObj.new(slowBasis, slowBasis + slowDev * 2.5, slowBasis - slowDev * 2.5, slowBasis + slowDev * 1.25, slowBasis - slowDev * 1.25, math.abs(close - slowBasis))
Both models store their structure in a ChannelObj type, including the instantaneous tracking error (abs(close - basis)).
5) Rolling Error Memory and Model Preference
To decide which model fits current conditions better, the script stores recent errors into rolling arrays and compares cumulative error totals.
var float errFast = array.new_float()
var float errSlow = array.new_float()
update_error(float errArr, float error, int maxLen) =>
errArr.unshift(error)
if errArr.size() > maxLen
errArr.pop()
Each bar updates both error histories and computes which model has lower recent accumulated error.
update_error(errFast, fastM.error, i_optLookback)
update_error(errSlow, slowM.error, i_optLookback)
bool preferFast = errFast.sum() < errSlow.sum()
This is an interpretable optimization approach: it does not attempt to brute-force parameters, it simply prefers the model that has tracked price more closely over the last i_optLookback bars.
6) Winner Selection Logic (Regime-Aware Hybrid)
The final model selection uses both regime and rolling error performance.
ChannelObj winner = regime == "MEAN REV" ? fastM : (preferFast ? fastM : slowM)
rawMid := winner.mid
rawUp := winner.upper
rawDn := winner.lower
rawUpInner := winner.upper_inner
rawDnInner := winner.lower_inner
In Mean Reversion, the script forces the fast model to ensure responsiveness.
Otherwise, it selects the lowest-error model between fast and slow.
7) Optional Output Smoothing
After the winner is selected, the script optionally smooths the final channel outputs using the chosen moving average type.
smooth(float src, string type, int len) =>
switch type
"SMA" => ta.sma(src, len)
"EMA" => ta.ema(src, len)
"HMA" => ta.hma(src, len)
"RMA" => ta.rma(src, len)
=> src
float finalMid = i_enableSmooth ? smooth(rawMid, i_smoothType, i_smoothLen) : rawMid
float finalUp = i_enableSmooth ? smooth(rawUp, i_smoothType, i_smoothLen) : rawUp
float finalDn = i_enableSmooth ? smooth(rawDn, i_smoothType, i_smoothLen) : rawDn
float finalUpInner = i_enableSmooth ? smooth(rawUpInner, i_smoothType, i_smoothLen) : rawUpInner
float finalDnInner = i_enableSmooth ? smooth(rawDnInner, i_smoothType, i_smoothLen) : rawDnInner
This preserves decision integrity since smoothing happens after model selection, not before.
8) Dynamic Visual Intensity From Hurst
Transparency is derived from the distance of hVal to 0.5, so stronger behavioral regimes appear with clearer tints.
int dynTrans = int(math.max(20, math.min(80, 100 - (math.abs(hVal - 0.5) * 200))))
Search in scripts for "hurst"

HurstExponentLibrary "HurstExponent"
Library to calculate Hurst Exponent refactored from Hurst Exponent - Detrended Fluctuation Analysis
demean(src) Calculates a series subtracted from the series mean.
Parameters:
src : The series used to calculate the difference from the mean (e.g. log returns).
Returns: The series subtracted from the series mean
cumsum(src, length) Calculates a cumulated sum from the series.
Parameters:
src : The series used to calculate the cumulative sum (e.g. demeaned log returns).
length : The length used to calculate the cumulative sum (e.g. 100).
Returns: The cumulative sum of the series as an array
aproximateLogScale(scale, length) Calculates an aproximated log scale. Used to save sample size
Parameters:
scale : The scale to aproximate.
length : The length used to aproximate the expected scale.
Returns: The aproximated log scale of the value
rootMeanSum(cumulativeSum, barId, numberOfSegments) Calculates linear trend to determine error between linear trend and cumulative sum
Parameters:
cumulativeSum : The cumulative sum array to regress.
barId : The barId for the slice
numberOfSegments : The total number of segments used for the regression calculation
Returns: The error between linear trend and cumulative sum
averageRootMeanSum(cumulativeSum, barId, length) Calculates the Root Mean Sum Measured for each block (e.g the aproximated log scale)
Parameters:
cumulativeSum : The cumulative sum array to regress and determine the average of.
barId : The barId for the slice
length : The length used for finding the average
Returns: The average root mean sum error of the cumulativeSum
criticalValues(length) Calculates the critical values for a hurst exponent for a given length
Parameters:
length : The length used for finding the average
Returns: The critical value, upper critical value and lower critical value for a hurst exponent
slope(cumulativeSum, length) Calculates the hurst exponent slope measured from root mean sum, scaled to log log plot using linear regression
Parameters:
cumulativeSum : The cumulative sum array to regress and determine the average of.
length : The length used for the hurst exponent sample size
Returns: The slope of the hurst exponent
smooth(src, length) Smooths input using advanced linear regression
Parameters:
src : The series to smooth (e.g. hurst exponent slope)
length : The length used to smooth
Returns: The src smoothed according to the given length
exponent(src, hurstLength) Wrapper function to calculate the hurst exponent slope
Parameters:
src : The series used for returns calculation (e.g. close)
hurstLength : The length used to calculate the hurst exponent (should be greater than 50)
Returns: The src smoothed according to the given length
Hurst ExponentMy first try to implement Full Hurst Exponent.
The Hurst exponent is used as a measure of long-term memory of time series. It relates to the autocorrelations of the time series and the rate at which these decrease as the lag between pairs of values increases
The Hurst exponent is referred to as the "index of dependence" or "index of long-range dependence". It quantifies the relative tendency of a time series either to regress strongly to the mean or to cluster in a direction.
In short, depending on the value you can spot the trending / reversing market.
Values 0.5 to 1 - market trending
Values 0 to 0.5 - market tend to mean revert
Hurst Exponent is computed using Rescaled range (R/S) analysis.
I split the lookback period (N) in the number of shorter samples (for ex. N/2, N/4, N/8, etc.). Then I calculate rescaled range for each sample size.
The Hurst exponent is estimated by fitting the power law. Basically finding the slope of log(samples_size) to log(RS).
You can choose lookback and sample sizes yourself. Max 8 possible at the moment, if you want to use less use 0 in inputs.
It's pretty computational intensive, so I added an input so you can limit from what date you want it to be calculated. If you hit the time limit in PineScript - limit the history you're using for calculations.
####################
Disclaimer
Please remember that past performance may not be indicative of future results.
Due to various factors, including changing market conditions, the strategy may no longer perform as good as in historical backtesting.
This post and the script don’t provide any financial advice.

Hurst Exponent Oscillator [PhenLabs]📊 Hurst Exponent Oscillator -
Version: PineScript™ v5
📌 Description
The Hurst Exponent Oscillator (HEO) by PhenLabs is a powerful tool developed for traders who want to distinguish between trending, mean-reverting, and random market behaviors with clarity and precision. By estimating the Hurst Exponent—a statistical measure of long-term memory in financial time series—this indicator helps users make sense of underlying market dynamics that are often not visible through traditional moving averages or oscillators.
Traders can quickly know if the market is likely to continue its current direction (trending), revert to the mean, or behave randomly, allowing for more strategic timing of entries and exits. With customizable smoothing and clear visual cues, the HEO enhances decision-making in a wide range of trading environments.
🚀 Points of Innovation
Integrates advanced Hurst Exponent calculation via Rescaled Range (R/S) analysis, providing unique market character insights.
Offers real-time visual cues for trending, mean-reverting, or random price action zones.
User-controllable EMA smoothing reduces noise for clearer interpretation.
Dynamic coloring and fill for immediate visual categorization of market regime.
Configurable visual thresholds for critical Hurst levels (e.g., 0.4, 0.5, 0.6).
Fully customizable appearance settings to fit different charting preferences.
🔧 Core Components
Log Returns Calculation: Computes log returns of the selected price source to feed into the Hurst calculation, ensuring robust and scale-independent analysis.
Rescaled Range (R/S) Analysis: Assesses the dispersion and cumulative deviation over a rolling window, forming the core statistical basis for the Hurst exponent estimate.
Smoothing Engine: Applies Exponential Moving Average (EMA) smoothing to the raw Hurst value for enhanced clarity.
Dynamic Rolling Windows: Utilizes arrays to maintain efficient, real-time calculations over user-defined lengths.
Adaptive Color Logic: Assigns different highlight and fill colors based on the current Hurst value zone.
🔥 Key Features
Visually differentiates between trending, mean-reverting, and random market modes.
User-adjustable lookback and smoothing periods for tailored sensitivity.
Distinct fill and line styles for each regime to avoid ambiguity.
On-chart reference lines for strong trending and mean-reverting thresholds.
Works with any price series (close, open, HL2, etc.) for versatile application.
🎨 Visualization
Hurst Exponent Curve: Primary plotted line (smoothed if EMA is used) reflects the ongoing estimate of the Hurst exponent.
Colored Zone Filling: The area between the Hurst line and the 0.5 reference line is filled, with color and opacity dynamically indicating the current market regime.
Reference Lines: Dash/dot lines mark standard Hurst thresholds (0.4, 0.5, 0.6) to contextualize the current regime.
All visual elements can be customized for thickness, color intensity, and opacity for user preference.
📖 Usage Guidelines
Data Settings
Hurst Calculation Length
Default: 100
Range: 10-300
Description: Number of bars used in Hurst calculation; higher values mean longer-term analysis, lower values for quicker reaction.
Data Source
Default: close
Description: Select which data series to analyze (e.g., Close, Open, HL2).
Smoothing Length (EMA)
Default: 5
Range: 1-50
Description: Length for smoothing the Hurst value; higher settings yield smoother but less responsive results.
Style Settings
Trending Color (Hurst > 0.5)
Default: Blue tone
Description: Color used when trending regime is detected.
Mean-Reverting Color (Hurst < 0.5)
Default: Orange tone
Description: Color used when mean-reverting regime is detected.
Neutral/Random Color
Default: Soft blue
Description: Color when market behavior is indeterminate or shifting.
Fill Opacity
Default: 70-80
Range: 0-100
Description: Transparency of area fills—higher opacity for stronger visual effect.
Line Width
Default: 2
Range: 1-5
Description: Thickness of the main indicator curve.
✅ Best Use Cases
Identifying if a market is regime-shifting from trending to mean-reverting (or vice versa).
Filtering signals in automated or systematic trading strategies.
Spotting periods of randomness where trading signals should be deprioritized.
Enhancing mean-reversion or trend-following models with regime-awareness.
⚠️ Limitations
Not predictive: Reflects current and recent market state, not future direction.
Sensitive to input parameters—overfitting may occur if settings are changed too frequently.
Smoothing can introduce lag in regime recognition.
May not work optimally in markets with structural breaks or extreme volatility.
💡 What Makes This Unique
Employs advanced statistical market analysis (Hurst exponent) rarely found in standard toolkits.
Offers immediate regime visualization through smart dynamic coloring and zone fills.
🔬 How It Works
Rolling Log Return Calculation:
Each new price creates a log return, forming the basis for robust, non-linear analysis. This ensures all price differences are treated proportionally.
Rescaled Range Analysis:
A rolling window maintains cumulative deviations and computes the statistical “range” (max-min of deviations). This is compared against the standard deviation to estimate “memory”.
Exponent Calculation & Smoothing:
The raw Hurst value is translated from the log of the rescaled range ratio, and then optionally smoothed via EMA to dampen noise and false signals.
Regime Detection Logic:
The smoothed value is checked against 0.5. Values above = trending; below = mean-reverting; near 0.5 = random. These control plot/fill color and zone display.
💡 Note:
Use longer calculation lengths for major market character study, and shorter ones for tactical, short-term adaptation. Smoothing balances noise vs. lag—find a best fit for your trading style. Always combine regime awareness with broader technical/fundamental context for best results.

Hurst Exponent Adaptive Filter (HEAF) [PhenLabs]📊 PhenLabs - Hurst Exponent Adaptive Filter (HEAF)
Version: PineScript™ v6
📌 Description
The Hurst Exponent Adaptive Filter (HEAF) is an advanced Pine Script indicator designed to dynamically adjust moving average calculations based on real time market regimes detected through the Hurst Exponent. The intention behind the creation of this indicator was not a buy/sell indicator but rather a tool to help sharpen traders ability to distinguish regimes in the market mathematically rather than guessing. By analyzing price persistence, it identifies whether the market is trending, mean-reverting, or exhibiting random walk behavior, automatically adapting the MA length to provide more responsive alerts in volatile conditions and smoother outputs in stable ones. This helps traders avoid false signals in choppy markets and capitalize on strong trends, making it ideal for adaptive trading strategies across various timeframes and assets.
Unlike traditional moving averages, HEAF incorporates fractal dimension analysis via the Hurst Exponent to create a self-tuning filter that evolves with market conditions. Traders benefit from visual cues like color coded regimes, adaptive bands for volatility channels, and an information panel that suggests appropriate strategies, enhancing decision making without constant manual adjustments by the user.
🚀 Points of Innovation
Dynamic MA length adjustment using Hurst Exponent for regime-aware filtering, reducing lag in trends and noise in ranges.
Integrated market regime classification (trending, mean-reverting, random) with visual and alert-based notifications.
Customizable color themes and adaptive bands that incorporate ATR for volatility-adjusted channels.
Built-in information panel providing real-time strategy recommendations based on detected regimes.
Power sensitivity parameter to fine-tune adaptation aggressiveness, allowing personalization for different trading styles.
Support for multiple MA types (EMA, SMA, WMA) within an adaptive framework.
🔧 Core Components
Hurst Exponent Calculation: Computes the fractal dimension of price series over a user-defined lookback to detect market persistence or anti-persistence.
Adaptive Length Mechanism: Maps Hurst values to MA lengths between minimum and maximum bounds, using a power function for sensitivity control.
Moving Average Engine: Applies the chosen MA type (EMA, SMA, or WMA) to the adaptive length for the core filter line.
Adaptive Bands: Creates upper and lower channels using ATR multiplied by a band factor, scaled to the current adaptive length.
Regime Detection: Classifies market state with thresholds (e.g., >0.55 for trending) and triggers alerts on regime changes.
Visualization System: Includes gradient fills, regime-colored MA lines, and an info panel for at-a-glance insights.
🔥 Key Features
Regime-Adaptive Filtering: Automatically shortens MA in mean-reverting markets for quick responses and lengthens it in trends for smoother signals, helping traders stay aligned with market dynamics.
Custom Alerts: Notifies on regime shifts and band breakouts, enabling timely strategy adjustments like switching to trend-following in bullish regimes.
Visual Enhancements: Color-coded MA lines, gradient band fills, and an optional info panel that displays market state and trading tips, improving chart readability.
Flexible Settings: Adjustable lookback, min/max lengths, sensitivity power, MA type, and themes to suit various assets and timeframes.
Band Breakout Signals: Highlights potential overbought/oversold conditions via ATR-based channels, useful for entry/exit timing.
🎨 Visualization
Main Adaptive MA Line: Plotted with regime-based colors (e.g., green for trending) to visually indicate market state and filter position relative to price.
Adaptive Bands: Upper and lower lines with gradient fills between them, showing volatility channels that widen in random regimes and tighten in trends.
Price vs. MA Fills: Color-coded areas between price and MA (e.g., bullish green above MA in trending modes) for quick trend strength assessment.
Information Panel: Top-right table displaying current regime (e.g., "Trending Market") and strategy suggestions like "Follow trends" or "Trade ranges."
📖 Usage Guidelines
Core Settings
Hurst Lookback Period
Default: 100
Range: 20-500
Description: Sets the period for Hurst Exponent calculation; longer values provide more stable regime detection but may lag, while shorter ones are more responsive to recent changes.
Minimum MA Length
Default: 10
Range: 5-50
Description: Defines the shortest possible adaptive MA length, ideal for fast responses in mean-reverting conditions.
Maximum MA Length
Default: 200
Range: 50-500
Description: Sets the longest adaptive MA length for smoothing in strong trends; adjust based on asset volatility.
Sensitivity Power
Default: 2.0
Range: 1.0-5.0
Description: Controls how aggressively the length adapts to Hurst changes; higher values make it more sensitive to regime shifts.
MA Type
Default: EMA
Options: EMA, SMA, WMA
Description: Chooses the moving average calculation method; EMA is more responsive, while SMA/WMA offer different weighting.
🖼️ Visual Settings
Show Adaptive Bands
Default: True
Description: Toggles visibility of upper/lower bands for volatility channels.
Band Multiplier
Default: 1.5
Range: 0.5-3.0
Description: Scales band width using ATR; higher values create wider channels for conservative signals.
Show Information Panel
Default: True
Description: Displays regime info and strategy tips in a top-right panel.
MA Line Width
Default: 2
Range: 1-5
Description: Adjusts thickness of the main MA line for better visibility.
Color Theme
Default: Blue
Options: Blue, Classic, Dark Purple, Vibrant
Description: Selects color scheme for MA, bands, and fills to match user preferences.
🚨 Alert Settings
Enable Alerts
Default: True
Description: Activates notifications for regime changes and band breakouts.
✅ Best Use Cases
Trend-Following Strategies: In detected trending regimes, use the adaptive MA as a trailing stop or entry filter for momentum trades.
Range Trading: During mean-reverting periods, monitor band breakouts for buying dips or selling rallies within channels.
Risk Management in Random Markets: Reduce exposure when random walk is detected, using tight stops suggested in the info panel.
Multi-Timeframe Analysis: Apply on higher timeframes for regime confirmation, then drill down to lower ones for entries.
Volatility-Based Entries: Use upper/lower band crossovers as signals in adaptive channels for overbought/oversold trades.
⚠️ Limitations
Lagging in Transitions: Regime detection may delay during rapid market shifts, requiring confirmation from other tools.
Not a Standalone System: Best used in conjunction with other indicators; random regimes can lead to whipsaws if traded aggressively.
Parameter Sensitivity: Optimal settings vary by asset and timeframe, necessitating backtesting.
💡 What Makes This Unique
Hurst-Driven Adaptation: Unlike static MAs, it uses fractal analysis to self-tune, providing regime-specific filtering that's rare in standard indicators.
Integrated Strategy Guidance: The info panel offers actionable tips tied to regimes, bridging analysis and execution.
Multi-Regime Visualization: Combines adaptive bands, colored fills, and alerts in one tool for comprehensive market state awareness.
🔬 How It Works
Hurst Exponent Computation:
Calculates log returns over the lookback period to derive the rescaled range (R/S) ratio.
Normalizes to a 0-1 value, where >0.55 indicates trending, <0.45 mean-reverting, and in-between random.
Length Adaptation:
Maps normalized Hurst to an MA length via a power function, clamping between min and max.
Applies the selected MA type to close prices using this dynamic length.
Visualization and Signals:
Plots the MA with regime colors, adds ATR-based bands, and fills areas for trend strength.
Triggers alerts on regime changes or band crosses, with the info panel suggesting strategies like momentum riding in trends.
💡 Note:
For optimal results, backtest settings on your preferred assets and combine with volume or momentum indicators. Remember, no indicator guarantees profits—use with proper risk management. Access premium features and support at PhenLabs.

Hurst Exponent (Dubuc's variation method)Library "Hurst"
hurst(length, samples, hi, lo)
Estimate the Hurst Exponent using Dubuc's variation method
Parameters:
length : The length of the history window to use. Large values do not cause lag.
samples : The number of scale samples to take within the window. These samples are then used for regression. The minimum value is 2 but 3+ is recommended. Large values give more accurate results but suffer from a performance penalty.
hi : The high value of the series to analyze.
lo : The low value of the series to analyze.
The Hurst Exponent is a measure of fractal dimension, and in the context of time series it may be interpreted as indicating a mean-reverting market if the value is below 0.5 or a trending market if the value is above 0.5. A value of exactly 0.5 corresponds to a random walk.
There are many definitions of fractal dimension and many methods for its estimation. Approaches relying on calculation of an area, such as the Box Counting Method, are inappropriate for time series data, because the units of the x-axis (time) do match the units of the y-axis (price). Other approaches such as Detrended Fluctuation Analysis are useful for nonstationary time series but are not exactly equivalent to the Hurst Exponent.
This library implements Dubuc's variation method for estimating the Hurst Exponent. The technique is insensitive to x-axis units and is therefore useful for time series. It will give slightly different results to DFA, and the two methods should be compared to see which estimator fits your trading objectives best.
Original Paper:
Dubuc B, Quiniou JF, Roques-Carmes C, Tricot C. Evaluating the fractal dimension of profiles. Physical Review A. 1989;39(3):1500-1512. DOI: 10.1103/PhysRevA.39.1500
Review of various Hurst Exponent estimators for time-series data, including Dubuc's method:
www.intechopen.com

Hurst Cycle Channel Clone %BA %B of lazy bears Hurst Cycle Channel Clone
Remember to thank him for his great scripts.
With this you can easily see when the close is above,below or in the short or medium cycle channel.

HurstCycles PeaksOnly way I found to plot hurst cycles. I gave up on anything other than daily chart.
Published on request.
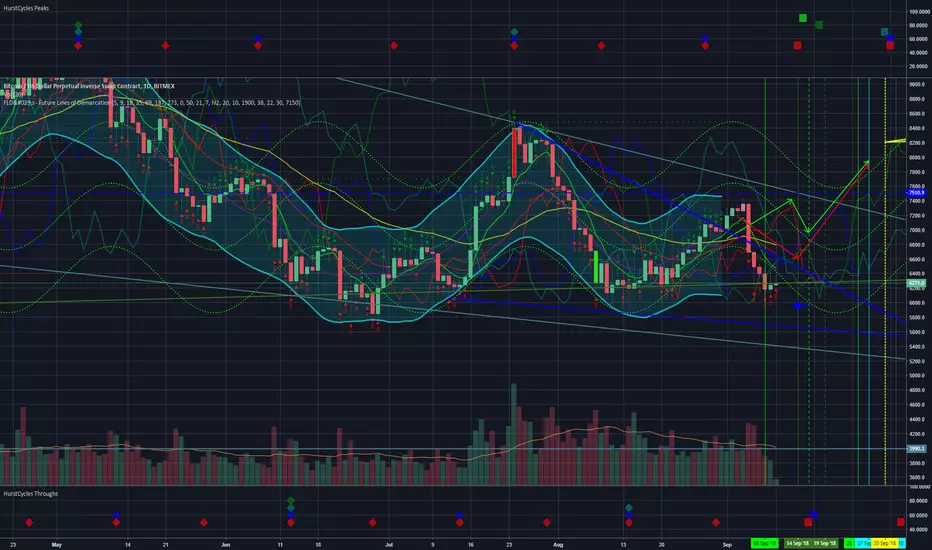
HurstCycles ThroughsOnly way I found to plot hurst cycles. I gave up on anything other than daily chart.
Published on request.

Hurst Exponent Market Phases [DW]This study is an experiment designed to identify market phases using changes in an approximate Hurst Exponent.
The exponent in this script is approximated using a simplified Rescaled Range method.
First, deviations are calculated for the specified period, then the specified period divided by 2, 4, 8, and 16.
Next, sums are taken of the deviations of each period, and the difference between the maximum and minimum sum gives the widest spread.
The rescaled range is calculated by dividing the widest spread by the standard deviation of price over the specified period.
The Hurst Exponent is then approximated by dividing log(rescaled range) by log(n).
The theory is that a system is persistent when the Hurst Exponent value is above 0.5, and antipersistent when the value is below 0.5.
The color scheme indicates 4 different phases I found to be significant in this formula:
- Stabilization Phase
- Destabilization Phase
- Chaos Increase Phase
- Chaos Decrease Phase
This script includes two visualization types to choose from:
- Bar Counter Mode, which displays the number of bars the exponent is consecutively in each phase.
- Hurst Approximation Mode, which displays the approximated exponent value.
Custom bar colors are included.
Please note: This is a rough estimate of the Hurst Exponent. It is not the actual exponent. Numerous approximations exist, and their results all differ slightly.

Hurst Future Lines of Demarcation StrategyJ. M. Hurst introduced a concept in technical analysis known as the Future Line of Demarcation (FLD), which serves as a forward-looking tool by incorporating a simple yet profound line into future projections on a financial chart. Specifically, the FLD is constructed by offsetting the price half a cycle ahead into the future on the time axis, relative to the Hurst Cycle of interest. For instance, in the context of a 40 Day Cycle, the FLD would be represented by shifting the current price data 20 days forward on the chart, offering an idea of future price movement anticipations.
The utility of FLDs extends into three critical areas of insight, which form the backbone of the FLD Trading Strategy:
A price crossing the FLD signifies the confirmation of either a peak or trough formation, indicating pivotal moments in price action.
Such crossings also help determine precise price targets for the upcoming peak or trough, aligned with the cycle of examination.
Additionally, the occurrence of a peak in the FLD itself signals a probable zone where the price might experience a trough, helping to anticipate of future price movements.
These insights by Hurst in his "Cycles Trading Course" during the 1970s, are instrumental for traders aiming to determine entry and exit points, and to forecast potential price movements within the market.
To use the FLD Trading Strategy, for example when focusing on the 40 Day Cycle, a trader should primarily concentrate on the interplay between three Hurst Cycles:
The 20 Day FLD (Signal) - Half the length of the Trade Cycle
The 40 Day FLD (Trade) - The Cycle you want to trade
The 80 Day FLD (Trend) - Twice the length of the Trade Cycle
Traders can gauge trend or consolidation by watching for two critical patterns:
Cascading patterns, characterized by several FLDs running parallel with a consistent separation, typically emerge during pronounced market trends, indicating strong directional momentum.
Consolidation patterns, on the other hand, occur when multiple FLDs intersect and navigate within the same price bandwidth, often reversing direction to traverse this range multiple times. This tangled scenario results in the formation of Pause Zones, areas where price momentum is likely to temporarily stall or where the emergence of a significant trend might be delayed.
This simple FLD indicator provides 3 FLDs with optional source input and smoothing, A-through-H FLD interaction background, adjustable “Close the Trade” triggers, and a simple strategy for backtesting it all.
The A-through-H FLD interactions are a framework designed to classify the different types of price movements as they intersect with or diverge from the Future Line of Demarcation (FLD). Each interaction (designated A through H by color) represents a specific phase or characteristic within the cycle, and understanding these can help traders anticipate future price movements and make informed decisions.
The adjustable “Close the Trade” triggers are for setting the crossover/under that determines the trade exits. The options include: Price, Signal FLD, Trade FLD, or Trend FLD. For example, a trader may want to exit trades only when price finally crosses the Trade FLD line.
Shoutouts & Credits for all the raw code, helpful information, ideas & collaboration, conversations together, introductions, indicator feedback, and genuine/selfless help:
🏆 @TerryPascoe
🏅 @Hpotter
👏 @parisboy

Hurst Diamond Notation PivotsThis is a fairly simple indicator for diamond notation of past hi/lo pivot points, a common method in Hurst analysis. The diamonds mark the troughs/peaks of each cycle. They are offset by their lookback and thus will not 'paint' until after they happen so anticipate accordingly. Practically, traders can use the average length of past pivot periods to forecast future pivot periods in time🔮. For example, if the average/dominant number of bars in an 80-bar pivot point period/cycle is 76, then a trader might forecast that the next pivot could occur 76-ish bars after the last confirmed pivot. The numbers/labels on the y-axis display the cycle length used for pivot detection. This indicator doesn't repaint, but it has a lot of lag; Please use it for forecasting instead of entry signals. This indicator scans for new pivots in the form of a rainbow line and circle; once the hi/lo has happened and the lookback has passed then the pivot will be plotted. The rainbow color per wavelength theme seems to be authentic to Hurst (or modern Hurst software) and has been included as a default.

Hurst Spectral Analysis Oscillator"It is a true fact that any given time history of any event (including the price history of a stock) can always be considered as reproducible to any desired degree of accuracy by the process of algebraically summing a particular series of sine waves. This is intuitively evident if you start with a number of sine waves of differing frequencies, amplitudes, and phases, and then sum them up to get a new and more complex waveform." (Spectral Analysis chapter of J M Hurst's book, Profit Magic )
Background: A band-pass filter or bandpass filter is a device that passes frequencies within a certain range and rejects (attenuates) frequencies outside that range. Bandpass filters are widely used in wireless transmitters and receivers. Well-designed bandpass filters (having the optimum bandwidth) maximize the number of signal transmitters that can exist in a system while minimizing the interference or competition among signals. Outside of electronics and signal processing, other examples of the use of bandpass filters include atmospheric sciences, neuroscience, astronomy, economics, and finance.
About the indicator: This indicator will accept float/decimal length inputs to display a spectrum of 11 bandpass filters. The trader can select a single bandpass for analysis that includes future high/low predictions. The trader can also select which bandpasses contribute to a composite model of expected price action.
10 Statements to describe the 5 elements of Hurst's price-motion model:
Random events account for only 2% of the price change of the overall market and of individual issues.
National and world historical events influence the market to a negligible degree.
Foreseeable fundamental events account for about 75% of all price motion. The effect is smooth and slow changing.
Unforeseeable fundamental events influence price motion. They occur relatively seldom, but the effect can be large and must be guarded against.
Approximately 23% of all price motion is cyclic in nature and semi-predictable (basis of the "cyclic model").
Cyclicality in price motion consists of the sum of a number of (non-ideal) periodic cyclic "waves" or "fluctuations" (summation principle).
Summed cyclicality is a common factor among all stocks (commonality principle).
Cyclic component magnitude and duration fluctuate slowly with the passage of time. In the course of such fluctuations, the greater the magnitude, the longer the duration and vice-versa (variation principle).
Principle of nominality: an element of commonality from which variation is expected.
The greater the nominal duration of a cyclic component, the larger the nominal magnitude (principle of proportionality).
Shoutouts & Credits for all the raw code, helpful information, ideas & collaboration, conversations together, introductions, indicator feedback, and genuine/selfless help:
🏆 @TerryPascoe
🏅 DavidF at Sigma-L, and @HPotter
👏 @Saviolis, parisboy, and @upslidedown

Hurst ExponentThis is an aproximation on Tradingview of the Hurst Exponent.
Its quite computational expensive, so it has been simplify and sample size reduced.
If any has an idea on how to create the real Hurst Exponent here, Ill be happy to hear and help.

Hurst Cycle Channel Clone [LazyBear]Cycle Channel is loosely based on Hurst's nested channels. Basic idea is to identify and highlight the shorter cycles, in the context of higher degree cycles.
This indicator plots the shorter term (red) & medium term (green) cycles as channels. Some things to note:
As you can see the red channel keeps moving with in the bounds of green channel. When green breaches red channel, it usually signifies extreme market condition.
Both red & green channels provide support/resistance levels. Also, the green channel provides S/R levels to the inner red channel.
Movement of red channel with reference to green highlights reversal points, reducing momentum et al. For ex., point "(x)" in the chart shows how red channel failed to reach the upper green channel line and highlighted the local top.
Use this just like other bands/channels. I have more indicators derived from this idea, will post them later.
Some more examples:
---------------------------------
MSFT 1M:
DXY 1M:
IWM 1M:
More info:
------------
cyclicwave.blogspot.com
List of my free indicators: bit.ly
List of my app-store indicators: blog.tradingview.com
(Support doc: bit.ly)

Hurst Spectral Analysis SwamiChartHaving a hard time deciding which wavelength to use for a Hurst analysis? Try a handful at once! SwamiCharts by John Ehlers offers a comprehensive way to visualize an indicator used over a range of lookback periods. The Spectral Analysis SwamiChart shows the bullish or bearish state of a spectrum of bandpasses over a user-defined range of wavelengths. The trader simply selects a bandwidth, a base wavelength, and a step/multiple to see the Spectral Analysis SwamiChart. A vertical column of green or red tends to indicate a very bullish or bearish moment in time, meaning that all bandpasses in the analyzed spectrum are in a bullish or bearish orientation simultaneously.
🏆 Shoutout to DavidF at Sigma-L for all the helpful information, conversations together, & indicator feedback.
🏅Shoutout to @HPotter for the bandpass code, and shoutout to @TerryPascoe for sharing it with me

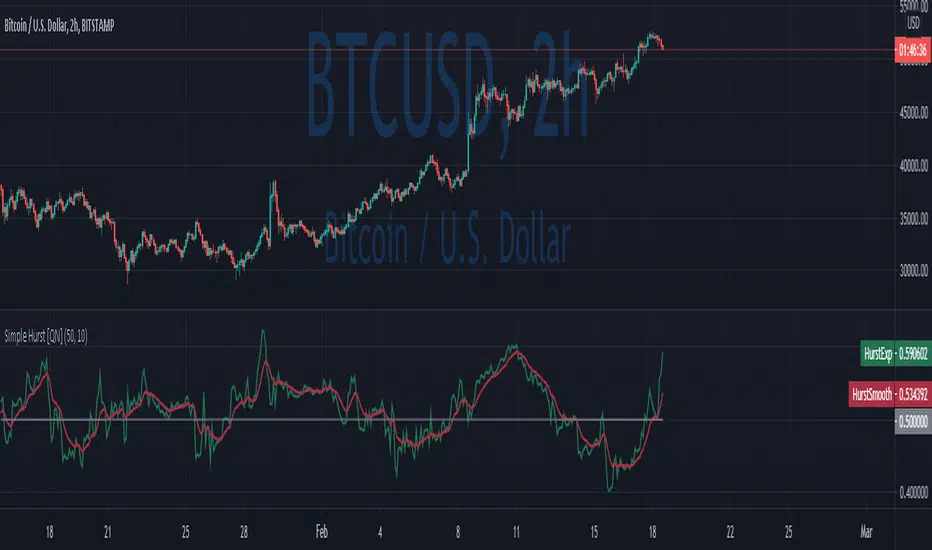
Simple Hurst Exponent [QuantNomad]This is a simplified version of the Hurst Exponent indicator.
In the meantime, I'm working on the full version. It's computationally intensive, so it's a challenge to squeeze it to PineScript limits. It will require some time to optimize it, so I decided to publish a simplified version for now.
The Hurst exponent is used as a measure of long-term memory of time series. It relates to the autocorrelations of the time series, and the rate at which these decrease as the lag between pairs of values increases
The Hurst exponent is referred to as the "index of dependence" or "index of long-range dependence". It quantifies the relative tendency of a time series either to regress strongly to the mean or to cluster in a direction.
In short depend on value you can spot trending / reversing market.
Values 0.5 to 1 - market trending
Values 0 to 0.5 - market tend to mean revert
####################
Disclaimer
Please remember that past performance may not be indicative of future results.
Due to various factors, including changing market conditions, the strategy may no longer perform as good as in historical backtesting.
This post and the script don’t provide any financial advice.
[blackcat] L2 Ehlers Hurst Coefficient IndicatorLevel: 2
Background
John F. Ehlers introuced Hurst Coefficient Indicator in his "Cycle Analytics for Traders" chapter 6 on 2013.
Function
The Hurst coefficient is one way to attempt to get a handle on the slope of the power density of market data. The Hurst coefficient varies between 0 and 1, and is related to the α power coefficient as H = 1 − α/2. The Hurst coefficient is more estimated than computed. Dr. Ehlers found the estimate using the fractal dimension was the most practical for shorter-term market data. The Hurst coefficient is related to the fractal dimension as H = 2 − D. Dr. Ehlers would like to make it perfectly clear that the Hurst coefficient or the fractal dimension has no direct practical application to trading not only because it is an estimate, but also because it has no predictive value. These computations only reflect the general structure of the market, and the answer you get is dependent on your assumptions. For example, the Hurst coefficient changes dramatically with the length of data used in making the estimate.
The only user input is the length of data to be used. The number can be arbitrarily large if you have sufficient data. The results are critically dependent on the input data length selected. After declaring variables, the coefficients of a 20-bar SuperSmoother filter are computed. The computations of N1, N2, and N3 are as described in the previous section. The fractal dimension is then converted to the Hurst coefficient, which is subsequently smoothed in the SuperSmoother filter.
Key Signal
SmoothHurst --> Hurst Coefficient Indicator fast line
Trigger --> Hurst Coefficient Indicator slow line
Pros and Cons
100% John F. Ehlers definition translation of original work, even variable names are the same. This help readers who would like to use pine to read his book. If you had read his works, then you will be quite familiar with my code style.
Remarks
The 40th script for Blackcat1402 John F. Ehlers Week publication.
Readme
In real life, I am a prolific inventor. I have successfully applied for more than 60 international and regional patents in the past 12 years. But in the past two years or so, I have tried to transfer my creativity to the development of trading strategies. Tradingview is the ideal platform for me. I am selecting and contributing some of the hundreds of scripts to publish in Tradingview community. Welcome everyone to interact with me to discuss these interesting pine scripts.
The scripts posted are categorized into 5 levels according to my efforts or manhours put into these works.
Level 1 : interesting script snippets or distinctive improvement from classic indicators or strategy. Level 1 scripts can usually appear in more complex indicators as a function module or element.
Level 2 : composite indicator/strategy. By selecting or combining several independent or dependent functions or sub indicators in proper way, the composite script exhibits a resonance phenomenon which can filter out noise or fake trading signal to enhance trading confidence level.
Level 3 : comprehensive indicator/strategy. They are simple trading systems based on my strategies. They are commonly containing several or all of entry signal, close signal, stop loss, take profit, re-entry, risk management, and position sizing techniques. Even some interesting fundamental and mass psychological aspects are incorporated.
Level 4 : script snippets or functions that do not disclose source code. Interesting element that can reveal market laws and work as raw material for indicators and strategies. If you find Level 1~2 scripts are helpful, Level 4 is a private version that took me far more efforts to develop.
Level 5 : indicator/strategy that do not disclose source code. private version of Level 3 script with my accumulated script processing skills or a large number of custom functions. I had a private function library built in past two years. Level 5 scripts use many of them to achieve private trading strategy.
Advanced Fractal and Hurst IndicatorAdvanced Fractal and Hurst Indicator (AFHI)
Description:
The Advanced Fractal and Hurst Indicator (AFHI) is a custom technical analysis tool designed to identify market trends and potential reversals by leveraging the concepts of Fractal Dimension and the Hurst Exponent . These advanced mathematical concepts provide insights into the complexity and persistence of price movements, making this indicator a powerful addition to any trader's toolkit.
How It Works:
Fractal Dimension (FD) :
The Fractal Dimension measures the complexity of price movements. A higher Fractal Dimension indicates a more complex, choppy market, while a lower value suggests smoother trends.
The FD is calculated using the log difference of price movements over a specified length.
Hurst Exponent (HE) :
The Hurst Exponent indicates the tendency of a time series to either regress to the mean or cluster in a direction. Values below 0.5 indicate a tendency to revert to the mean (mean-reverting), while values above 0.5 suggest a trending market.
The HE is calculated using the rescaled range method, comparing the range of price movements to the standard deviation.
Composite Indicator :
The Composite Indicator combines the smoothed Fractal Dimension and Hurst Exponent to provide a single value indicating market conditions. This is done by normalizing the FD and HE values and combining them into one metric.
A positive Composite Indicator suggests an uptrend, while a negative value indicates a downtrend.
Smoothing :
Both FD and HE values are smoothed using a simple moving average to reduce noise and provide clearer signals.
Trend Confirmation :
A 50-period moving average (MA) is used to confirm the trend direction. The price being above the MA indicates an uptrend, while below the MA indicates a downtrend.
Background Shading :
The indicator pane is shaded green during uptrend conditions (positive Composite Indicator and price above MA) and red during downtrend conditions (negative Composite Indicator and price below MA).
How Traders Can Use It:
Identifying Trends :
Traders can use the AFHI to identify current market trends. The background shading in the indicator pane provides a visual cue for trend direction, with green indicating an uptrend and red indicating a downtrend.
Trend Confirmation :
The Composite Indicator line, plotted in purple, helps confirm the trend. Positive values suggest a strong uptrend, while negative values indicate a strong downtrend.
Entry and Exit Signals :
Traders can use the transitions of the Composite Indicator and the background shading to time their entry and exit points. For instance, a shift from red to green shading suggests a potential buy opportunity, while a shift from green to red suggests a potential sell opportunity.
Alerts :
The script includes alert conditions that can notify traders when the Composite Indicator signals a new trend direction. Alerts can be set up for both uptrends and downtrends, helping traders stay informed of key market changes.
Strategy Development :
By integrating AFHI into their trading strategies, traders can develop more robust systems that account for market complexity and persistence. The indicator can be used alongside other technical tools to enhance decision-making and improve trade accuracy.

[NLX-L2] Hurst Exponent Signal Filter- Hurst Exponent Signal Filter -
The Hurst Exponent Signal Filter is meant to be used with an external signal source, this can be any indicator with a signal plot output (-1 Sell / 1 Buy)
It filters out a lot of noisy signals and improves the performance of many indicators.
- Example: How to Use -
1. Add a trend Indicator like Trend Index MTF to your chart
2. Add an indicator with a signal plot like Fishers Stochastic Center of Gravity to your Chart and select the Trend Index MTF with Type L1 in the Settings as Signal Source
3. Add this Hurst Signal Filter to your Chart and select the Fishers Stochastic Center of Gravity with Type L2 in the Settings as Signal Source
4. Add the Backtest Module to your Chart and select the Hurst Signal Filter with Type L2 as Source
- Alerts for Automated Trading -
See my signature below. Contact me for the Alert module.

Hurst-Based Trend Persistence w/Poisson Prediction
---
# **Hurst-Based Trend Persistence w/ Poisson Prediction**
## **Introduction**
The **Hurst-Based Trend Persistence with Poisson Prediction** is a **statistically-driven trend-following oscillator** that provides traders with **a structured approach to identifying trend strength, persistence, and potential reversals**.
This indicator combines:
- **Hurst Exponent Analysis** (to measure how persistent or mean-reverting price action is).
- **Color-Coded Trend Detection** (to highlight bullish and bearish conditions).
- **Poisson-Based Trend Reversal Probability Projection** (to anticipate when a trend is likely to end based on statistical models).
By integrating **fractal market theory (Hurst exponent)** with **Poisson probability distributions**, this indicator gives traders a **probability-weighted view of trend duration** while dynamically adapting to market volatility.
---
## **Simplified Explanation (How to Read the Indicator at a Glance)**
1. **If the oscillator line is going up → The trend is strong.**
2. **If the oscillator line is going down → The trend is weakening.**
3. **If the color shifts from red to green (or vice versa), a trend shift has occurred.**
- **Strong trends can change color without weakening** (meaning a bullish or bearish move can remain powerful even as the trend shifts).
4. **A weakening trend does NOT necessarily mean a reversal is coming.**
- The trend may slow down but continue in the same direction.
5. **A strong trend does NOT guarantee it will last.**
- Even a powerful move can **suddenly reverse**, which is why the **Poisson-based background shading** helps anticipate probabilities of change.
---
## **How to Use the Indicator**
### **1. Understanding the Rolling Hurst-Based Trend Oscillator (Main Line)**
The **oscillator line** is based on the **Hurst exponent (H)**, which quantifies whether price movements are:
- **Trending** (values above 0 → momentum-driven, persistent trends).
- **Mean-reverting** (values below 0 → price action is choppy, likely to revert to the mean).
- **Neutral (Random Walk)** (values around 0 → price behaves like a purely stochastic process).
#### **Interpreting the Oscillator:**
- **H > 0.5 → Persistent Trends:**
- Price moves tend to sustain in one direction for longer periods.
- Example: Strong uptrends in bull markets.
- **H < 0.5 → Mean-Reverting Behavior:**
- Price has a tendency to revert back to its mean.
- Example: Sideways markets or fading momentum.
- **H ≈ 0.5 → Random Walk:**
- No clear trend; price is unpredictable.
A **gray dashed horizontal line at 0** serves as a **baseline**, helping traders quickly assess whether the market is **favoring trends or mean reversion**.
---
### **2. Color-Coded Trend Signal (Visual Confirmation of Trend Shifts)**
The oscillator **changes color** based on **price slope** over the lookback period:
- **🟢 Green → Uptrend (Price Increasing)**
- Price is rising relative to the selected lookback period.
- Suggests sustained bullish pressure.
- **🔴 Red → Downtrend (Price Decreasing)**
- Price is falling relative to the selected lookback period.
- Suggests sustained bearish pressure.
#### **How to Use This in Trading**
✔ **Stay in trends until a color change occurs.**
✔ **Use color changes as confirmation for trend reversals.**
✔ **Avoid counter-trend trades when the oscillator remains strongly colored.**
---
### **3. Poisson-Based Trend Reversal Projection (Anticipating Future Shifts)**
The **shaded orange background** represents a **Poisson-based probability estimation** of when the trend is likely to reverse.
- **Darker Orange = Higher Probability of Trend Reversal**
- **Lighter Orange / No Shade = Low Probability of Immediate Reversal**
💡 **The idea behind this model:**
✔ Trends **don’t last forever**, and their duration follows **statistical patterns**.
✔ By calculating the **average historical trend duration**, the indicator predicts **how likely a trend shift is at any given time**.
✔ The **Poisson probability function** is applied to determine the **expected likelihood of a reversal as time progresses**.
---
## **Mathematical Foundations of the Indicator**
This indicator is based on **two primary statistical models**:
### **1. Hurst Exponent & Trend Persistence (Fractal Market Theory)**
- The **Hurst exponent (H)** measures **autocorrelation** in price movements.
- If past trends **persist**, H will be **above 0.5** (meaning trend-following strategies are favorable).
- If past trends tend to **mean-revert**, H will be **below 0.5** (meaning reversal strategies are more effective).
- The **Rolling Hurst Oscillator** calculates this exponent over a moving window to track real-time trend conditions.
#### **Formula Breakdown (Simplified for Traders)**
The Hurst exponent (H) is derived using the **Rescaled Range (R/S) Analysis**:
\
Where:
- **R** = **Range** (difference between max cumulative deviation and min cumulative deviation).
- **S** = **Standard deviation** of price fluctuations.
- **Lookback** = The number of periods analyzed.
---
### **2. Poisson-Based Trend Reversal Probability (Stochastic Process Modeling)**
The **Poisson process** is a **probabilistic model used for estimating time-based events**, applied here to **predict trend reversals based on past trend durations**.
#### **How It Works**
- The indicator **tracks trend durations** (the time between color changes).
- A **Poisson rate parameter (λ)** is computed as:
\
- The **probability of a reversal at any given time (t)** is estimated using:
\
- **As t increases (trend continues), the probability of reversal rises**.
- The indicator **shades the background based on this probability**, visually displaying the likelihood of a **trend shift**.
---
## **Dynamic Adaptation to Market Conditions**
✔ **Volatility-Adjusted Trend Shifts:**
- A **custom volatility calculation** dynamically adjusts the **minimum trend duration** required before a trend shift is recognized.
- **Higher volatility → Requires longer confirmation before switching trend color.**
- **Lower volatility → Allows faster trend shifts.**
✔ **Adaptive Poisson Weighting:**
- **Recent trends are weighted more heavily** using an exponential decay function:
- **Decay Factor (0.618 by default)** prioritizes **recent intervals** while still considering historical trends.
- This ensures the model adapts to changing market conditions.
---
## **Key Takeaways for Traders**
✅ **Identify Persistent Trends vs. Mean Reversion:**
- Use the oscillator line to determine whether the market favors **trend-following or counter-trend strategies**.
✅ **Visual Trend Confirmation via Color Coding:**
- **Green = Uptrend**, **Red = Downtrend**.
- Trend changes help confirm **entry and exit points**.
✅ **Anticipate Trend Reversals Using Probability Models:**
- The **Poisson projection** provides a **statistical edge** in **timing exits before trends reverse**.
✅ **Adapt to Market Volatility Automatically:**
- Dynamic **volatility scaling** ensures the indicator remains effective in **both high and low volatility environments**.
Happy trading and enjoy!

Indicators: Hurst Bands and Hurst OscillatorThese 2 indicators are derivative work from Jim Hurst's book - "The Magic of Stock Transaction Timing".
The bands are % bands around a median that gets calculated according to Hurst's formula. The outer bands (called ExtremeBands) signify extreme overbought/oversold conditions. Inner bands signify potential pullback points. As you can see, they also act as dynamic S/R levels.
The oscillator bands match the bands overlaid on price, so you will get an excellent indication of where the price is gonna do by using the oscillator along with the bands. Note that Hurst Oscillator can be used separately too, there is no technical dependency on Hurst Bands.
More info on Hurst Method:
www.readtheticker.com

Hurst‑Millard FLD Normalized 2.0 – Signals "Hurst-Millard FLD Normalized 2.0 – Signals" indicator. It analyzes price data using a combination of moving averages (MAs) and the Hurst exponent to decompose price movements into trend, swing, and noise components, generating buy and sell signals. Here's a brief overview of its functionality:Inputs and Modes:Offers Auto Mode (cycle-based) and Manual Mode for configuring three moving averages: Long-Term (LT), Mid-Term (MT), and Short-Term (ST).
Auto Mode calculates MA lengths and offsets based on user-defined target cycle lengths (e.g., LT: 400 bars, MT: 100 bars, ST: 25 bars) with predefined offset ratios (0.2, 0.333, 0.5 respectively).
Manual Mode allows direct input of MA lengths and offsets.
Moving Averages:Computes Simple Moving Averages (SMAs) for LT, MT, and ST based on the closing price.
Applies forward-shifting to simulate future price behavior (e.g., maLongFwd shifts the LT MA by the specified offset).
Decomposition:Trend: Derived from the forward-shifted LT MA (maLongFwd).
Swing: Calculated as the difference between MT and LT MAs, scaled as a percentage of the closing price and amplified (using ATR or a manual factor).
Noise: Calculated as the difference between ST and MT MAs, similarly scaled and amplified.
Hurst Exponent:Estimates the Hurst exponent to measure the persistence or mean-reversion of the noise component.
Uses a 50-bar lookback period, smoothed with a 5-period SMA.
Signal Generation:Generates buy signals when the noise component is less than the swing component and their difference is within a user-defined proximity threshold (default: 25% of swing).
Generates sell signals when noise exceeds swing within the same threshold.
Signals are plotted as diamond shapes at the calculated proximity price level.
Visualization:Plots the trend, swing, and noise components as lines with customizable colors and gradient intensity based on their relative strength.
Optional debugging plots for raw forward-shifted MAs and proximity thresholds.
Displays a periodic debug table (every 100 bars) showing key metrics like close price, MAs, trend, swing, noise, Hurst exponent, and more.
Additional Features:Supports ATR-based amplification for scaling swing and noise.
Allows customization of signal colors, diamond offsets, and proximity thresholds.
Includes debugging options to visualize raw MAs and proximity bands.
In summary, this indicator uses cycle-based or manually configured MAs to break down price action into trend, swing, and noise, calculates the Hurst exponent for noise analysis, and generates buy/sell signals based on the relationship between swing and noise within a proximity threshold. It’s designed for traders to identify potential trend reversals or continuations.
