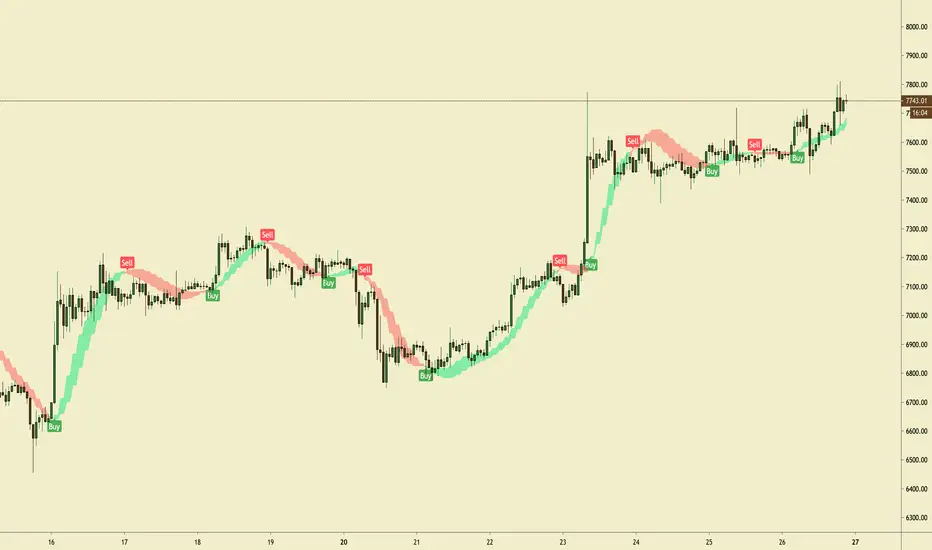
Dexie Indicator v1.0The Dexie Indicator is a Forex indicator system built for the 5 min chart. It is suitable for Forex traders and Nadex users and provides BUY/SELL signals with alerts and comes with a series of 8 custom built Moving Averages designed to reduce the need for chart drawing.
This indicator can be used by beginners out of the box and requires very little trading experience to be successful.
The more advanced trader can work with this tool to greatly increase their success rate and make for a much more enjoyable trading experience.
Please contact for more details.
Dexie Indicator with BUY/SELL signals displayed only:
Dexie Indicator with BUY/SELL signals, Bollinger Bands and custom Moving Averages:
Dexie Indicator with all custom Moving Averages displayed:
Dexie Indicator slower Moving average bull cross example:
Dexie Indicator slower Moving average bear cross example:
Search in scripts for "ichimoku"

Dexie Indicator v1.0The Dexie Indicator is a complete Forex trading system built for the 5 min chart. It is suitable for Nadex users and provides BUY/SELL signals with alerts and comes with a series of 8 custom built Moving Averages designed to reduce the need for chart drawing.
This indicator can be used by beginners out of the box and requires very little trading experience to be successful.
The more advanced trader can work with this tool to greatly increase their success rate and make for a much more enjoyable trading experience.
Please contact for more details.
Dexie Indicator with BUY/SELL signals displayed only:
Dexie Indicator with BUY/SELL signals, Bollinger Bands and custom Moving Averages
Dexie Indicator with all custom Moving Averages displayed

yashi guys
this indicator contain two lines :
the conversion line shifted 17 bar and base line shifted 26 bar
with this indicator u can found where the komo switched and found some potential reversal pivot point
enjoy : Ahmad

Sto RSI and kijun-sen line to determine and follow the trend This script uses 25-75 treshold of stochastic RSI with the help of kijun-sen as confirmation, to find entry points to any trend either newly developed or an established one. I just realized it on the 1 hour SPX chart. Sure it can be used on other symbols. Crossing above/below 25/75 line of sto RSI is considered as buy/sell signal. Signals are evaluated whether price be above/below kijun-sen line. If a sell signal below kijun-sen is generated it is a continuation signal for downtrend, otherwise it is a countertrend signal (maybe a signal for a new downtrend). A countertrend signal must be evaluated carefully and only accepted in the right side of kijun-sen. e.g entering a sell signal generated above kijun-sen should be accepted only below the kijun-sen, vice-versa.

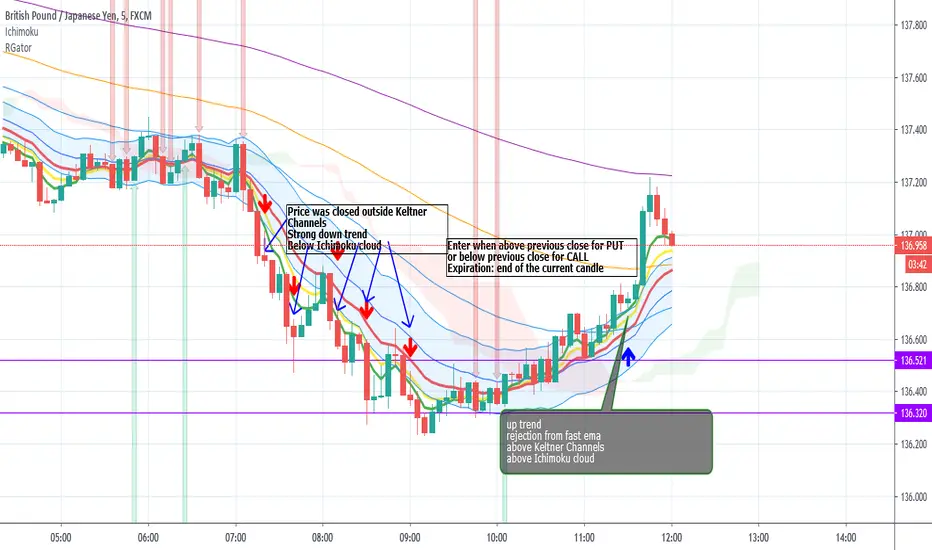
Rainbow Gator - EMAs strategy for Binary OptionThis is an EMAs indicator for Binary Option or Scalping Alert designed for lower Time Frame Trend (2-5minutes).
Although you will find it a useful tool for higher time frames as well.
The Alerts are generated when the fast EMA cross over/under other slower EMAs, you then have the chance to wait for the pullback during the new trend then enter for trend momentum (follow the trend).
Beware when the trend is close to EMA200.
You must draw your SRT (Support-Resistance-Trendline) before looking for setups.
Good luck.
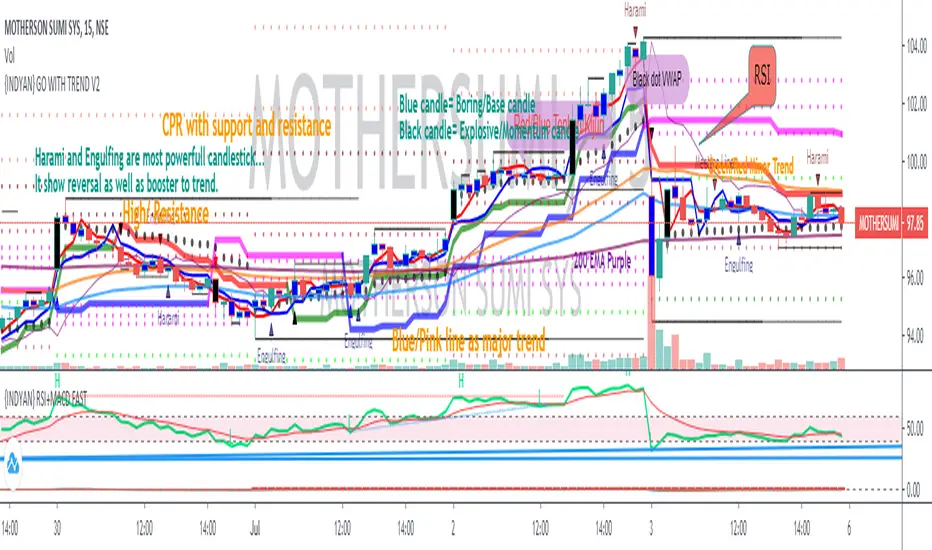
{INDYAN} GO WITH TREND V2This indicator has almost everything for intraday trading . There are two supertrends one with higher time frame and one at lower time frame, Due to which we can recognize reversal. If higher time frame supertrend is showing uptrend and minor is showing downtrend then better to avoid taking any trade in between. Both trend should be in same direction.
Tenkan and kijun is there to verify the trend authencity, check where the tenkan and kijun crossover is there or not at the time of reversal signal given by supertrends. It will boost trading chances.
Also VWAP is placed to know the current situation, If price is below VWAP go for sort if all other things match as above said.
HEMA LEMA is a EMA band and i found that it act as support and resistance, If price breaks channel with volume and sustain above/below for 2 candle close (TIMEFRAME AS SYMBOL).
Also placed FAST EMA to recognize the fast moving trend.
Pivot with CPR is there to trade on basis of CPR and Pivot.
For demand and supply traders, they can use blue and black candle for marking up zones. Blue is boring/base candle and Black is explosive candle.
I hope it will help my trader friends to recognize the trend and reversal.
Let me know if anything more we need to include or remove to make it better for everyone.
Happy Trading... Love INDYAN
#intraday
#hema-lema
#pivot
#cpr
#supertrend_reversal
#demandzone
#supplyzone
#tenkansen
#kijunsen
Williams %R + RSI + EMA - [Silver-Wong]
Williams %R + EMA + RSI
Un seul indicateur avec :
- William %R
- RSI
- EMA
- Une ligne médiane
- Les étiquettes des indicateurs
Uber Baseline [UTS]Fixed Trend Visualization
The trend is assumed UP while candle closes are above baseline. The baseline is then colored green.
The trend is assumed DOWN while candle closes are below baseline. The baseline is painted red in this case.


Easy Loot BandsEasy Loot Bollinger Bands:
This indicator is a bollinger band that also auto-generates a trendline, giving you the best opportunities to buy & sell. That's it.
You can use this on any time-frame, any stock, and any cryptocurrency.
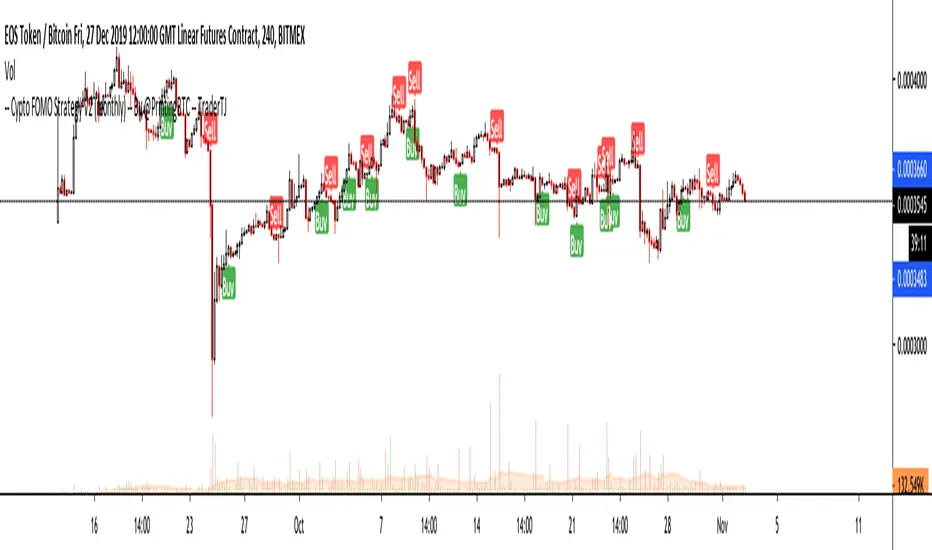
Crypto FOMO Strategy (monthly-access)PLEASE READ THE ENTIRE POST BEFORE PURCHASING & USING THE FOMO INDICATOR. Saves you and me some time in emails and messages. :)
This is the NEW MONTHLY ACCESS Version of the Crypto FOMO Strategy
Please check the links at the bottom of this post, so you find the way to our shop.
1 Month access is set at $25
10% Disount --> "FOMO25"
Any question, DM me here or on Twitter , check for link on the bottom.
The FOMO Buy Sell Indicator is a very specific strategy, cut down to its roots and made perfect for the volatile crypto market.
Many indicators focus only on one aspect, one side, one specific rule. As you know, this is not how life, the market or anything else works.
FOMO combines many different aspects at the same time, scans multiple other indicators and comes to a conclusion based on over 950 lines of code.
It is based on Divergences, Elliott Waves , Ichimoku , MACD , MACD Histogram, RSI , Stoch , CCI , Momentum, OBV, DIOSC, VWMACD, CMF and multiple EMAs.
Every single aspect is weighted into the decision before giving out an indication.
Most buy/sell indicators FAIL because they try to apply the same strategy to every single chart, which
are as individual as humans.
To conquer this problem, FOMO has a wide range of settings and variables which can be easily
modified.
To make it a true strategy, FOMO has as well settings for Take Profit Points, Multiple Entries and Stop Losses. Everything with an Alert Feature of course.
I know from experience that many people take one indicator and are simply too LAZY to add multiple indicators to make a rational choice.
The result of that is that they lose money, by following blatantly only one indicator.
FOMO has additional 7 indicators, perfect for the crypto market, which can be turned on and off.
FOMO Signals Settings
“Show Signals?” - On/Off to show the Buy/Sell Signals. “Aggressiveness” - Increase to make the signals less aggressive
and decrease to make them more aggressive.
“Show Custom FOMO Timeframe?” - On/Off to show FOMO Signals of a different timeframe in addition to the normal ones.
“Custom FOMO Timeframe?” - Choose the timeframe for the custom FOMO signals.
“Use Safe FOMO?” - On/Off to show only “safe” (less but more exact) FOMO signals.
“Safe FOMO Sells” - Settings for the “safe” FOMO Sell Signals. Decrease number for “less safe” Signals.
Increase number for “more safe” Signals.
“Safe FOMO Buys” - Settings for the “safe” FOMO Buy Signals. Decrease number for “more safe” Signals.
Increase number for “less safe” Signals.
FOMO Strategy Settings
“Take Profit 1 ” - On/Off to show TP1 points.
“Take Profit After %” - Set the percentage after which TP1 is
active.
“Take Profit 2 ” - On/Off to show TP2 points.
“Take Profit 2 After %” - Set the percentage after which TP2 is active.
“Take Profit 3 ” - On/Off to show TP3 points.
“Take Profit 3 After %” - Set the percentage after which TP3 is
active.
“Second Entry” - On/Off to show Second Entry points.
“Second Entry After %” - Set the percentage after which Second Entry is active.
“Third Entry ” - On/Off to Third Entry points.
“Third Entry After %” - Set the percentage after which Third
Entry is active.
“Stop Loss ” - On/Off to show Stop Loss points.
“Take Profit After %” - Set the percentage after which Stop Loss is active.
The FOMO Lifeguard is a special feature made to cancel out the “noice” of the signals and show only signals with a great technical significance.
For this FOMO uses the default settings of +7 and - 7. This references to an index value of multiple settings of almost all indicators used in this script.
+7 cuts out all sell signals below the index value of 7.
- 7 cuts out all buy signals above the index value of - 7.
Using the FOMO Lifeguard is a key element for a sustainable and profitable strategy.
As the normal FOMO Signals, the Lifeguard Signals are also bound to the “Aggressiveness”. Should the cut out of signals with the Lifeguard on be too big, try adjusting the “Aggressiveness”.
With this, once can choose and make this indicator PERFECT for his own strategy and trading style. Day Traders would use no “Lifeguard” and aggressive signals.
Swing Traders would use “Lifeguard” and aggressive signals.
To make the life of the FOMO user even easier, I have added all adjustable Take Profit Points, Multiple entry points and Stop Loss points.
Simply choose how many Take Profit points you would like to have and choose the percentage after which you would like to see the Take Profit point appear on the chart and notify you to take profits.
Are you a Trader who likes multiple entries? Also no problem with FOMO. Select how many additional entries you would like to have and after how many percent you would like them to appear on the chart and remind you of adding to the position.
What would a Strategy be without a Stop Loss? Same settings apply here as on the TPs and MEs .
Crypto Modified Indicators
“Show Divergences?” - On/Off to show Divergences on the Chart based on the data of 10 different indicators.
“Show Custom Divergences?” - On/Off to show Divergences on the chart of a custom timeframe.
“Custom Divergence Timeframe?” - Choose the Timeframe for which the Custom Divergences should appear on the chart.
“Show Oversold/bought?” - On/Off to change the colour of the chart in Oversold/bought conditions.
“Oversold/bought value?” - Choose a value for which the chart is Oversold/bought.
“Show Fibonacci Levels?” - On/Off to show automatic Fibonacci Levels.
“Fibonacci Lookback Lenght” - This value states how many candles from right now are taken into account to paint the Fibonacci Levels.
“Fibonacci Lookback Lenght” - Choose a custom Timeframe that should be used to paint the Fibonacci Levels.
Crypto Modified Indicators 2
“Show EMAs?” - On/Off to show three EMAs on the chart, after the example of @Teddycleps
“EMA Lenght 1” - Choose a value for the first EMA Lenght
“EMA Lenght 2 ” - Choose a value for the second EMA Lenght.
“EMA Lenght 3” - Choose a value for the third EMA Lenght.
The area between the first and third EMA is filled. Is EMA1 above 21, it’s filled green. Is it below, it’s filled red.
“Show Ichimoku? ” - On/Off to show Ichimoku on the chart.
“Show Tenkin?” - On/Off to show Tenkin on the chart.
“Tenkin” - Set the lenght of the Tenkin.
“Show Kijun?” - On/Off to show Kijun on the chart.
“Kijun” - Set the lenght of the Kijun.
“Show Senkou?” - On/Off to show the Senkou on the chart. “Senkou” - Set the lenght of the Senkou.
“Displacement” - Set the value of the Displacement.
“Show ZIG ZAG Lines?” - On/Off to show ZigZag Lines on the chart, used to identify short-term trends and EW counts.
“ZZ Lenght 1” - Set the first lenght of the ZigZag Lines.
“ZZ Lenght 2” - Set the second lenght of the ZigZag Lines.
FOMO without any doubt has Custom Alerts for all Signals that it is painting on the chart. This goes for the “Normal Signals” as well as for the “Lifeguard Signals”.
One can even choose to receive custom notifications for Take Profit points, Multiple Entry points and the Stop Loss points.
The signals appear on the chart DURING the candle, not at the end of the candle. Therefore, the alerts do this as well. These appear during the candle.
Here we can see all of the possible Alerts that can be chosen to be displayed. In total it is 30 different custom alerts, based on what the trader is looking for and how he is trading.
Personally, I have 10-15 coins that I trade the most and for these I have custom notifications, mostly though only the SAFE FOMO Buy and Sell Signals.
To activate Alerts for FOMO
1) Go to the “ALERT” icon on the top tool bar of your Tradingview.
2) Select “CONDITION” as “—Crypto FOMO Strategy—“
3) Then choose ONE condition from the list of conditions.
4) On “OPTIONS” you can set how many times it appears, I have “Once per Bar”.
4.1) If you want to make sure that the signal is truly there and not just a condition for a second during the candle, choose “ONCE PER BAR CLOSE”.
5) “Expiration Time” sets the time until the alert expires. PRO users have no expiration for alerts.
6) “Alert Actions” give you a row of choices what happens and how you want to be notified.
7) “Message” is the message that you receive inside the notification.
AFTERWORD/DISCLAIMER
FOMO has been created after my goal to #MakeCryptoProfessionalAgain. Every aspect of it has its own and very specific use, which traders have shown to find useful in their trading.
This Indicator is meant to help new and experienced traders to understand the various aspects of this market and access all of the most important and most commonly used tools, with JUST ONE CLICK.
FOMO should be used responsibly and treated as an indicator. Signals, scripts, algorithms can NEVER be 100% exact. It is up to the trader to make a well thought and educated decision, wether to follow a signal or not. Our brains are way more advanced than any indicator and algorithm.
I advise especially for this reason to have not just the signals turned on. Please do not use the SAME settings for each chart. Look which Aggressiveness and Lifeguard Settings fit your chart the most, you will be amazed how well some charts work with FOMO.
FOMO should NOT make you FOMO into a trade anymore. It should teach you to make more educated decisions and especially for margin trading reduce the risk of liquidation.
Should you have problems with being liquidated multiple times, I advise to use the “STOP LOSS” function.
Most importantly, enjoy the indicator and trading in general.


Filtered Waves [NXT2017] #Linda Raschke #basics on Arthur MerrilHI BIG PLAYERS,
this script I wrote for an enquiry of a tradingview-user. It should represent the Filtered Waves idea from Arthur Merril and used by Linda Raschke.
It's similar like a visualization of Elliott Waves.
On YouTube title "MTA UK Chapter Presentation with Linda Raschke" between 34-36 minutes Linda Raschke shows the rules for her Filterd Waves.
Any questions? Ask me!
King regards
NXT2017
========
TO MY PERSON
I'm the second winner of the official German Forex Trading Competition in 2018.
Look here to the ranks:
deutsche-trading-meisterschaften.de
I speak german, english and russian.
My strength in trading are Wolfe Wave pattern.

Bollinger bands/Lagging span crossHello my dear ambitious traders
I'm working hard this week to publish some great indicators this week and open sourced. Hope you'll enjoy, learn and use them.
This will be my greatest reward but comments showing appreciation are also very welcomed (actually likes too) :)
For today, I'll share a simple indicator but it's coming along with some insightful knowledge ^^
Anyway, I'm not here to ask you to this but to share a very cool indicator I made a few months ago and wanted to share for FREE with the community today
The indicator is related to this educational post : What-a-Bollinger-Bands-Lagging-span-cross-can-tell-us/
This trading technique was invented by Robbytrade, a famous french trader twitter.com
I wanted to have those visual signals on the chart so I coded it.
The advantage of being a developer is that you can litteraly code what you miss and get your life better in the process. The one that will find a way to code a new form of money will be rich... wait.... that guy is called Satoshi Nakamoto...
That's all for me today my friends
PS
Trying to update the Trade Manager shared yesterday with some cool features. More to come in the upcoming days
Enjoy
Dave

SlingerMust be added an Ichimoku Clound with the following entries
Conversion Line Periods __4
Base Line Periods _______ 26
Lagging Span 2 Periods___ 52
Displacement __________ 26
Turn off from chart
-Conversion Line
-Base Lina
-Lagging Span
Must add 1 EMA 25
Instructions, USE FOR BINARY AT TRENDING CHARTS
5MIN
BUY
Price must be OVER Ichimoku Clound, EMA 25 and pulled back to the GREEN lines
SELL
Price must be BELOW Ichimoku Cloud, EMA 25 and pulled back to the GREEN lines
ENTRY
As it comes back moving up or down after touching the green line(s)
I may update the script later and add all at the same so you don't have to add the EMA 25 and the Ichimiku Cloud

CHOP_LRSI V2.0Incorporated the strategies which are part of the "Flow Tend Indicator Strategy V2" strategy into the CHOP_LRSI study.
Long and Short signals can be displayed below the study. Alerts are supported for every strategy.

DTC Trading StrategyThe script contains various commonly used indicators, such as:
Bollingerbands
Ichi cloud
HMA
MA
FIB levels
Helios v1.0 - by @cryptomrdavis -1.0
This is another indicator for you guys. From different indicators its get the signals and combines them into one.
Green marks an uptrend and red an downtrend.
Happy trading
+++ use this tool on your own risk. i'm not responsible for your loses. DYOR +++
____________________________________________________________________________
BTC: 1GVRDK3HHr9CKM5SF2CGpCNXFuavB3L4j9
ETH: 0x7b825fa752b9926D3E8397cDb1d9E5473D074646
XMR: 41zL2SQS7zyZmwXKng2TeUWsMi5vMmkgSdDCjULUTvM6ichwm1E2ZDEYGt56zk9ghoM9bekhjycSwa8amtTcB2JiUet5jtg
NEO: AXja5xPDhczfm2ujHyBfpkQAAnMsXsazmb
TRX: THi1L1v2wHJxmQg6Wk9TgkKLcP6x2oMAwf
ZEC: zcZzFkRx95cp7MtuW8wLhC5zz5RYF9QkT2uPPmhZZHc6ppXepHGgCSeAS1rtD6WFdqsM5p1gZm2gfirnrnviucsdP4aCpqU
XLM: GAXUQJSW55C7MAC4GI26NZUGIKSHFDVFRFKZCXPLMPY4HCADSDT55XK6
WAVES: 3PCMkNpMHxSraTCkwV1ENcBKa9sXbVCGjQX
BCH: qz57n04ud6mn42u00aymqkku8tfh0lk4jv9c28mjvv
tippin.me
____________________________________________________________________________
