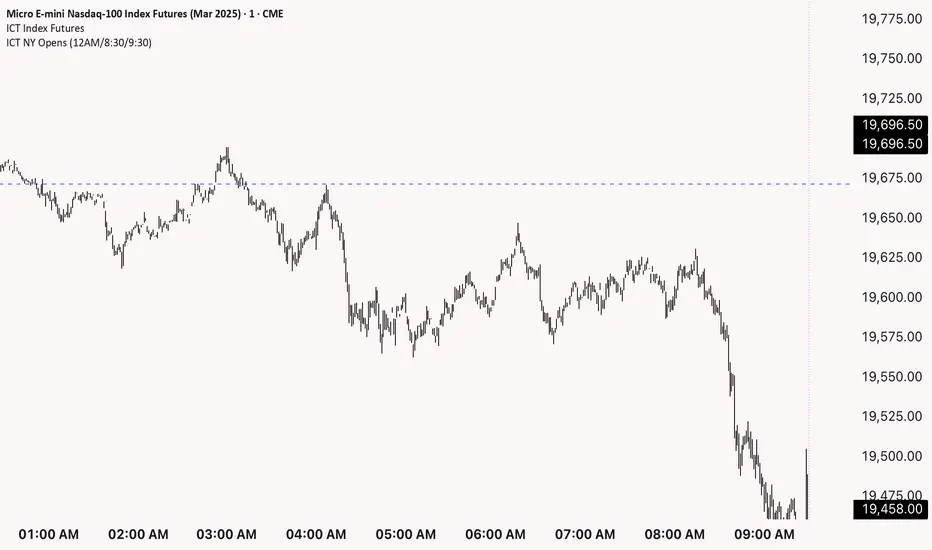
ICT NY Opens (12AM/8:30/9:30)This indicator plots three key New York session reference levels used by ICT traders and intraday scalpers: the Midnight Open (12:00 AM EST), the 8:30 AM EST level (common macro print window), and the 9:30 AM EST RTH open. Each line is drawn at that day’s opening price for the specified time and extends horizontally to 4:15 PM TDC so you always have clean, fixed anchors for the entire trading day.
Search in scripts for "ict"
ICT Setup 04 [TradingFinder] SFP Sweep Liquidity Fake CHoCH/BOS🔵 Introduction
In smart money and ICT based trading, liquidity is never random. Some of the most meaningful market moves begin with a liquidity sweep where price intentionally hunts a previous swing high or swing low to trigger stop loss orders and absorb volume.
This manipulation is often followed by a sharp reversal from a reaction zone, creating ideal conditions for a high probability entry. This indicator is built to detect exactly that. It identifies a valid swing point and defines a reaction zone where price is likely to react.
For short setups, the zone lies between the swing high and the maximum of the candle’s open or close. For long setups, it’s drawn from the swing low to the minimum of the open or close.
When price returns to this zone and forms a qualified confirmation candle typically a doji or a small bodied candle that closes inside the zone while sweeping the liquidity this is a potential sign of reversal.
The candle must show both the sweep and the inability to hold above or below the key level, signaling a fake breakout or failed move. By combining elements of liquidity hunt, reaction zone rejection, and candle based entry confirmation, this tool highlights sniper entry points used by smart money to trap retail traders and reverse the trend. It helps filter out noise and enhances timing, making it ideal for trading in alignment with institutional order flow.
Long Position :
Short Position :
🔵 How to Use
This indicator is designed to highlight precise moments where price sweeps liquidity and reacts within a high probability reversal zone. By identifying clean swing highs and lows and defining a smart reaction zone around them, it filters out weak fakeouts and focuses only on setups with strong institutional footprints.
The tool works best when combined with market structure analysis and is suitable for both scalping and intraday trading. Below is a breakdown of how to interpret the signals for long and short positions based on the visual setups provided.
🟣 Long Setup
In a long setup, the indicator first detects a valid swing low where liquidity has likely accumulated below. A reaction zone is then drawn between the swing low and the minimum of the open or close of the swing candle.
When price returns to this zone, it must sweep the previous low and form a precise confirmation candle, such as a doji or a small bodied candle, that closes inside the zone. This candle must also reject the lower level, showing failure to continue downward.
As shown in the chart, once the liquidity grab is complete and the confirmation candle forms, a clean long signal is issued, indicating a potential bullish reversal backed by smart money behavior.
🟣 Short Setup
In a short setup, the indicator identifies a swing high where buy-side liquidity is resting. It then constructs a reaction zone between the high and the maximum of the open or close of the swing candle. Price must return to this zone, sweep the swing high, and form a bearish confirmation candle inside the zone.
A classic example is a doji or rejection candle that traps breakout buyers and fails to hold above the previous high. In the provided chart, the price aggressively hunts the liquidity above the swing high, but the close within the reaction zone signals exhaustion, prompting a short signal with high reversal probability.
These setups represent moments where price action, liquidity behavior, and candle structure align to offer strong entries. By focusing on clean sweeps and reactive confirmations, the indicator helps traders stay on the side of smart money and avoid common breakout traps.
🔵 Settings
🟣 Logical settings
Swing period : You can set the swing detection period.
Max Swing Back Method : It is in two modes "All" and "Custom". If it is in "All" mode, it will check all swings, and if it is in "Custom" mode, it will check the swings to the extent you determine.
Max Swing Back : You can set the number of swings that will go back for checking.
Maximum Distance Between Swing and Signal :The maximum number of candles allowed between the swing point and the potential signal. The default value is 50, ensuring that only recent and relevant price reactions are considered valid.
🟣 Display settings
Displaying or not displaying swings and setting the color of labels and lines.
🟣 Alert Settings
Alert SFP : Enables alerts for Swing Failure Pattern.
Message Frequency : Determines the frequency of alerts. Options include 'All' (every function call), 'Once Per Bar' (first call within the bar), and 'Once Per Bar Close' (final script execution of the real-time bar). Default is 'Once per Bar'.
Show Alert Time by Time Zone : Configures the time zone for alert messages. Default is 'UTC'.
🔵 Conclusion
This indicator is built for traders who rely on liquidity driven setups and smart money principles. By combining swing structure analysis with precision reaction zones and strict entry confirmation, it isolates the exact moments where price sweeps liquidity and fails to continue. These are high value points where institutional activity often reveals itself, and retail traps unfold.
Unlike generic breakout tools, this script focuses on quality over quantity by requiring both a sweep of a swing high or low and a confirmed rejection candle that closes inside a predefined zone. With customizable swing depth, proximity filters, visual highlights, and alert functions, it offers a complete framework for identifying and acting on fake breakouts with confidence. Whether you trade forex, crypto, or indices, this tool enhances your ability to align with true order flow and take entries where liquidity is most likely to shift.

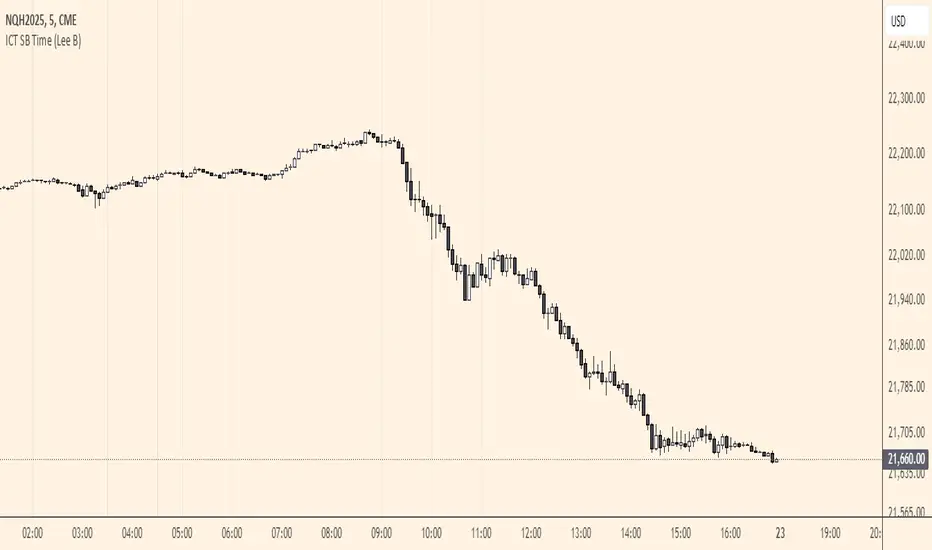
ICT SB Time (Lee B)A minimal and clean indicator that simply plots the ICT Silver Bullet time windows for you on the chart with vertical lines.
It also has the option to show other important times, like 00:00, 8:30, and 9:30. Toggles in settings let you change line color, turn any of them off temporarily, and can limit their visibility to only the lower timeframes for less clutter.
I hope you find this indicator useful... and happy trading!
Lee B
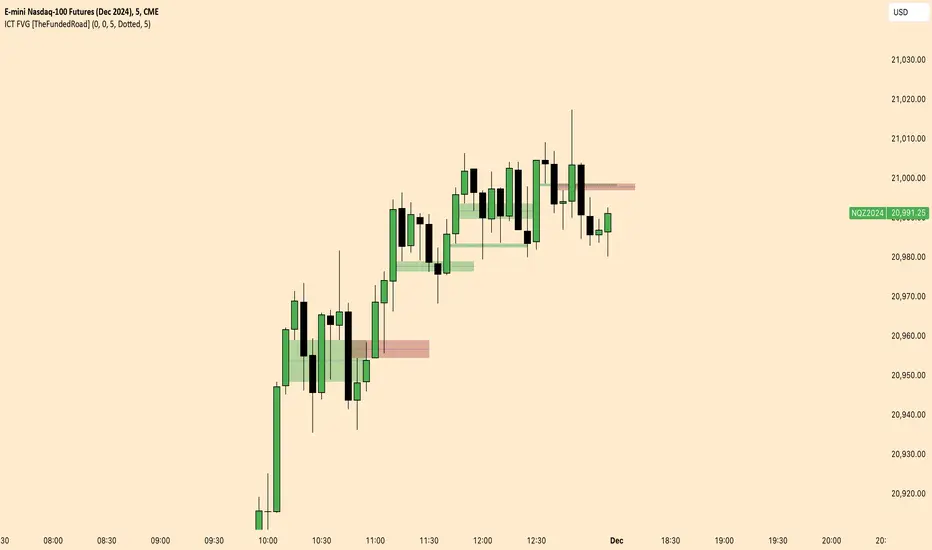
ICT FVG [TheFundedRoad]This indicator shows you all ICT Fair value gaps on chart with midpoint line
Fair value gap is a gap in a set of 3 candles, in a bullish FVG you have 1st candle high being lower than third candle low, and in a bearish FVG you have first candle low higher than third candle high, thats how this indicator finds these fair value gaps
It draws the fair value gap from the 2nd candle forward
You can customize the color and if you want to see the midpoint or not, midpoint is 50% of the gap
ICT Setup 03 [TradingFinder] Judas Swing NY 9:30am + CHoCH/FVG🔵 Introduction
Judas Swing is an advanced trading setup designed to identify false price movements early in the trading day. This advanced trading strategy operates on the principle that major market players, or "smart money," drive price in a certain direction during the early hours to mislead smaller traders.
This deceptive movement attracts liquidity at specific levels, allowing larger players to execute primary trades in the opposite direction, ultimately causing the price to return to its true path.
The Judas Swing setup functions within two primary time frames, tailored separately for Forex and Stock markets. In the Forex market, the setup uses the 8:15 to 8:30 AM window to identify the high and low points, followed by the 8:30 to 8:45 AM frame to execute the Judas move and identify the CISD Level break, where Order Block and Fair Value Gap (FVG) zones are subsequently detected.
In the Stock market, these time frames shift to 9:15 to 9:30 AM for identifying highs and lows and 9:30 to 9:45 AM for executing the Judas move and CISD Level break.
Concepts such as Order Block and Fair Value Gap (FVG) are crucial in this setup. An Order Block represents a chart region with a high volume of buy or sell orders placed by major financial institutions, marking significant levels where price reacts.
Fair Value Gap (FVG) refers to areas where price has moved rapidly without balance between supply and demand, highlighting zones of potential price action and future liquidity.
Bullish Setup :
Bearish Setup :
🔵 How to Use
The Judas Swing setup enables traders to pinpoint entry and exit points by utilizing Order Block and FVG concepts, helping them align with liquidity-driven moves orchestrated by smart money. This setup applies two distinct time frames for Forex and Stocks to capture early deceptive movements, offering traders optimized entry or exit moments.
🟣 Bullish Setup
In the Bullish Judas Swing setup, the first step is to identify High and Low points within the initial time frame. These levels serve as key points where price may react, forming the basis for analyzing the setup and assisting traders in anticipating future market shifts.
In the second time frame, a critical stage of the bullish setup begins. During this phase, the price may create a false break or Fake Break below the low level, a deceptive move by major players to absorb liquidity. This false move often causes smaller traders to enter positions incorrectly. After this fake-out, the price reverses upward, breaking the CISD Level, a critical point in the market structure, signaling a potential bullish trend.
Upon breaking the CISD Level and reversing upward, the indicator identifies both the Order Block and Fair Value Gap (FVG). The Order Block is an area where major players typically place large buy orders, signaling potential price support. Meanwhile, the FVG marks a region of supply-demand imbalance, signaling areas where price might react.
Ultimately, after these key zones are identified, a trader may open a buy position if the price reaches one of these critical areas—Order Block or FVG—and reacts positively. Trading at these levels enhances the chance of success due to liquidity absorption and support from smart money, marking an opportune time for entering a long position.
🟣 Bearish Setup
In the Bearish Judas Swing setup, analysis begins with marking the High and Low levels in the initial time frame. These levels serve as key zones where price could react, helping to signal possible trend reversals. Identifying these levels is essential for locating significant bearish zones and positioning traders to capitalize on downward movements.
In the second time frame, the primary bearish setup unfolds. During this stage, price may exhibit a Fake Break above the high, causing a brief move upward and misleading smaller traders into incorrect positions. After this false move, the price typically returns downward, breaking the CISD Level—a crucial bearish trend indicator.
With the CISD Level broken and a bearish trend confirmed, the indicator identifies the Order Block and Fair Value Gap (FVG). The Bearish Order Block is a region where smart money places significant sell orders, prompting a negative price reaction. The FVG denotes an area of supply-demand imbalance, signifying potential selling pressure.
When the price reaches one of these critical areas—the Bearish Order Block or FVG—and reacts downward, a trader may initiate a sell position. Entering trades at these levels, due to increased selling pressure and liquidity absorption, offers traders an advantage in profiting from price declines.
🔵 Settings
Market : The indicator allows users to choose between Forex and Stocks, automatically adjusting the time frames for the "Opening Range" and "Trading Permit" accordingly: Forex: 8:15–8:30 AM for identifying High and Low points, and 8:30–8:45 AM for capturing the Judas move and CISD Level break. Stocks: 9:15–9:30 AM for identifying High and Low points, and 9:30–9:45 AM for executing the Judas move and CISD Level break.
Refine Order Block : Enables finer adjustments to Order Block levels for more accurate price responses.
Mitigation Level OB : Allows users to set specific reaction points within an Order Block, including: Proximal: Closest level to the current price. 50% OB: Midpoint of the Order Block. Distal: Farthest level from the current price.
FVG Filter : The Judas Swing indicator includes a filter for Fair Value Gap (FVG), allowing different filtering based on FVG width: FVG Filter Type: Can be set to "Very Aggressive," "Aggressive," "Defensive," or "Very Defensive." Higher defensiveness narrows the FVG width, focusing on narrower gaps.
Mitigation Level FVG : Like the Order Block, you can set price reaction levels for FVG with options such as Proximal, 50% OB, and Distal.
CISD : The Bar Back Check option enables traders to specify the number of past candles checked for identifying the CISD Level, enhancing CISD Level accuracy on the chart.
🔵 Conclusion
The Judas Swing indicator helps traders spot reliable trading opportunities by detecting false price movements and key levels such as Order Block and FVG. With a focus on early market movements, this tool allows traders to align with major market participants, selecting entry and exit points with greater precision, thereby reducing trading risks.
Its extensive customization options enable adjustments for various market types and trading conditions, giving traders the flexibility to optimize their strategies. Based on ICT techniques and liquidity analysis, this indicator can be highly effective for those seeking precision in their entry points.
Overall, Judas Swing empowers traders to capitalize on significant market movements by leveraging price volatility. Offering precise and dependable signals, this tool presents an excellent opportunity for enhancing trading accuracy and improving performance

ICT opening price lineShows you the opening price of a certain time of day. I will show as line starting from the time selected and ending a few bars into the future. Available times are the ones ICT said are relevant for framing a premium and discount using opening prices: 00:00, 8:30 and 13:30. To show all 3 you have to add the indicator 3 times.
The script offers some customization on how the line should look line and if you want a label telling the time of it after the line.

ICT Balance Price Range [UAlgo]The "ICT Balance Price Range " indicator identifies and visualizes potential balance price ranges (BPRs) on a price chart. These ranges are indicative of periods where the market exhibits balance between bullish and bearish forces, often preceding significant price movements.
🔶 What is Balanced Price Range (BPR) ?
Balanced Price Range is a concept based on Fair Value Gap. Balanced price range (BPR) is the area on price chart where two opposite fair value gaps overlap.
When price approaches the Balanced Price Range (BPR), we assume that the price will react quickly and strongly here. This is because its the combination of two fair value gaps and being a good point of interest for smart money traders.
🔶 Key Features:
Bars to Consider: Determines the number of bars to evaluate for BPR conditions.
Threshold for BPR: Sets the minimum range required for a valid BPR to be identified.
Remove Old BPR: Option to automatically remove invalidated BPRs from the chart.
Bearish/Bullish Box Color: Customizable colors for visual representation of bearish and bullish BPRs.
🔶 Disclaimer
This indicator is provided for educational and informational purposes only.
It should not be considered as financial advice or a recommendation to buy or sell any financial instrument.
The use of this indicator involves inherent risks, and users should employ their own judgment and conduct their own research before making any trading decisions. Past performance is not indicative of future results.
🔷 Related Scripts
Fair Value Gaps (FVG)

ICT Silver Bullet Vertical Lines by Fahmi EshaqThis indicator is designed for users interested in backtesting the Silver Bullet strategy. It eliminates the need for manual drawing of vertical lines by automatically highlighting specific times known as ICT Silver Bullet times. These times correspond to periods when smart money are active the market. The indicator marks these Silver Bullet times with vertical lines, making them easily identifiable. The specified Silver Bullet times are 3AM-4AM, 10AM-11AM, and 2PM-3PM New York time. Additionally, a vertical line is added at 12:00AM to demarcate the start of each day, as days begin at midnight.

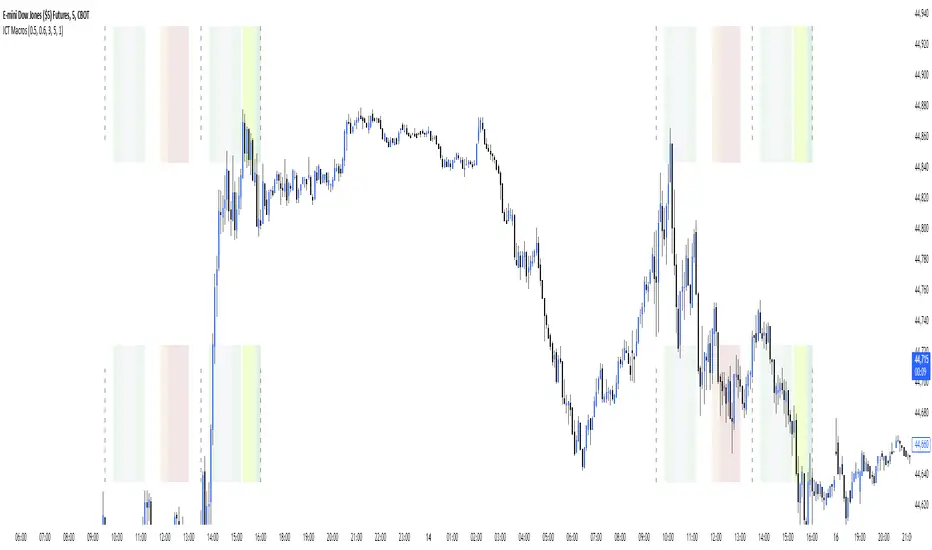
ICT Hydra MacrosThis indicator allows you to set a colored box at each time frame specified as Macro.
The purpose of this customizable color box is to be able to identify the start and end of the desired time frame, as well as the highest and lowest price during that time frame.
It also allows to place the schedule in numbers inside the box in order to quickly identify the painted time frame.
The indicator has up to 26 customizable boxes both in time frame and color. This allows to have different time frames that each Trader considers convenient for his strategy.
Settings:
General Settings:
Limit Days to Draw: Indicates the number of past days in which boxes will be drawn. Default value is 5 past days.
Timeframe Limit: Indicates the maximum time frame in which the boxes will be displayed. Default value is 5 minutes.
Timezone: Indicates the desired Timezone to calculate the schedules that will be configured later.
Macros Settings:
Show Macros Boxes: Enables or disables all boxes. It is enabled by default.
Display Text: Enables or disables all labels inside the boxes containing the time frame corresponding to the box. It is enabled by default.
Macros Transparency: Indicates the transparency percentage of the selected color for all boxes. By default it contains a value of 80% transparency.
Macro 1-26: Indicates the start time and end time, as well as the color of the individual box. Each Macro can be enabled or disabled individually. Note that the boxes of each Macro will be visible only if the "Show Macros Boxes" property is enabled. By default, there are specified certain Macros or time frames with a duration of 20 minutes, which are Manipulation or Expansion Macros that mentor Hydra has taught us based on the knowledge that ICT has provided for everyone.
The objective of this indicator is to provide a visual tool on the Macros or Time Frames in which the Trader can easily observe the desired schedule and which will automatically adjust according to the time and price on all 4 sides of the box.

ICT HTF Candles [Source Code] (fadi)Plotting a configurable higher timeframe on current chart's timeframe helps visualize price movement without changing timeframes. It also plots FVG and Volume Imbalance on the higher timeframe for easier visualization.
With ICT concepts, we usually wait for HTF break of structure and then find an entry on a lower timeframe. With this indicator, we can set it to the HTF and watch the develop of price action until the break of structure happens. We can then take an entry on the current timeframe.
Settings
HTF Higher timeframe to plot
Number of candles to display The number of higher timeframe candles to display to the right of current price action
Body/Border/Wick The candle colors for the body, border, and wick
Padding from current candles The distance from current timeframe's candles
Space between candles Increase / decrease the candle spacing
Candle width The size of the candles
Imbalance
Fair Value Gap Show / Hide FVG on the higher timeframe
Volume Imbalance Show / Hide Volume Imbalance on the higher timeframe
Trace
Trace lines Extend the OHLC lines of the higher timeframe and the source of each
Label Show/Hide the price levels of the OHLC

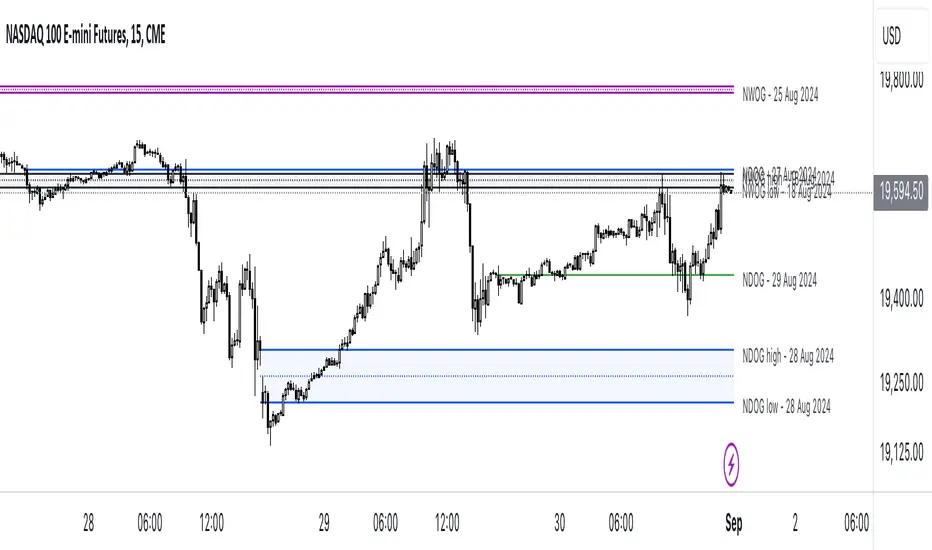
ICT NWOG/NDOG [Source Code] (fadi)New Week Opening Gap (NWOG) and New Day Opening Gap (NDOG) are areas on the chart where price tend to react to and has the potential of moving from one gap to the next. These gaps can act as support and resistance zones where price can bounce of, or go through and retest. Areas of interest are the high, low, the Consequent Encroachment (C.E.), which is the middle between high and low of each gap.
Event Horizon is the 50% distance between two NWOGs and price tend to react to, and could act as Premium/ Discount between two NWOGs.
New Week Opening Gap (NWOG)
The difference between Friday close, and Sunday open. Consequent Encroachment (C.E.) is the area between two NWOGs.
Settings NWOG
- The Colors in the form of Current/Previous and line style for NWOG
- Background color to use for Current/Previous
- Number of NWOGs to use by the indicator (ICT recommends using minimum of 5)
- Extend Configuration:
-- Always Extend all NWOGs
-- Above and below only Shows the immediate two NWOGs that are above and below current price. These two NWOGs are recalculated as price moves
-- Any that is near current price Any NWOG that is near the current price, this can result in multiple NWOGs being displayed, with some overlapping
- Event Horizon only applicable when using the "Above and below only settings"
-- Show Date label and type of gap
New Day Opening Gap (NDOG)
The difference between Yesterday's close and Today's open.
Settings NDOG
- The Colors in the form of Current/Previous and line style for NDOG
- Background color to use for Current/Previous
- Number of NDOGs to use by the indicator, default is 1 but price tend to react to previous ones as well
- Extend Configuration:
-- Always Extend all NDOGs
-- Above and below only Shows the immediate two NDOGs that are above and below current price. These two NDOGs are recalculated as price moves
-- Any that is near current price Any NDOG that is near the current price, this can result in multiple NDOGs being displayed, with some overlapping
-- Show Date label and type of gap
Other Settings
Number of candles to use in calculation is used to calculate the size of the candles in order to derive the distance from current price. If current candle sizes is more important than over longer period of time then use 14 or near that number
Factor multiplier for distance test is the number above times X value. Lower timeframes require a higher number than a larger timeframe. If day trading, a value between 10 and 20 is probably best. If swing trading, a value between 5 and 10 is probably best.
Buffer How many candles beyond current price to extend the gaps by. this is helpful to provide cleaner view of the price action
ICT HTF FVGs (fadi)ICT HTF FVGs displays the higher timeframe FVGs on current chart. This allows the trader to easily visualize the higher timeframe FVGs without having to mark them manually and see when price reaches point of interest for possible reversals or reaction.
This indicator attempts to provide as much flexibility possible by being able to define the following:
Higher Timeframe Settings
Timeframe to monitor
Bullish FVG color for this timeframe
Bearish FVG color for this timeframe
Maximum number of FVGs to display for this timeframe
Distance from current bar. This prevents overcrowding of FVGs
Hide Lower Timeframes from current chart. If this option is turned off, 5m timeframe FVGs will be displayed on an hourly chart as an example.
Show Border for the FVGs. Border color is derived from the FVG color
Show Mitigated FVG on the chart. The labels are removed to prevent the labels from overlapping with the candles on the chart/
Show C.E. Draws a line at the middle point of the FVG. This is usually an area of interest.
Show Label Shows the label with label color, background color, and label size.

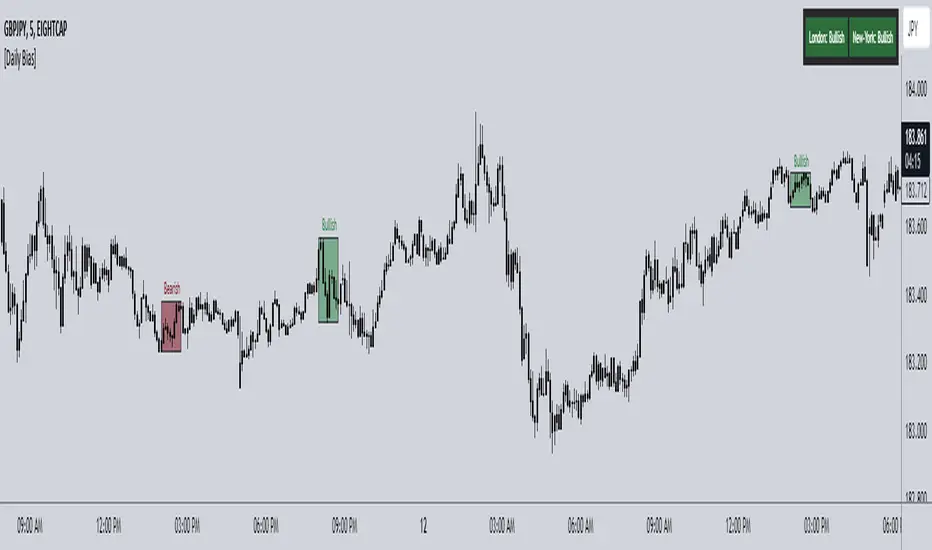
ICT Daily Bias Finder [DTCC]What is This?
The ICT Daily Bias Finder uses a method called "DTCC" to identify the London and New York session's bias, bullish or bearish. This indicator should only be relied on for 5 minute, and not other timeframes.
How do I use it?
Look at the previous days two boxes (labeled DTCC Bear/DTCC Bull), if both are bullish or both are bearish it is NOT recommended to rely on DTCC for that day. If the first one is bullish and second one is bearish, the DTCC for the next day says that London session will turn ABOVE midnight opening price, while New York will turn UNDER midnight opening price (longs in London, shorts in New York). If the second one is bearish and the first is bullish, the DTCC for the next day says that London session will turn UNDER midnight opening price, while New York will turn ABOVE midnight opening price (shorts in London, longs in New York)
Emoji guide to DTCC indicator:
🟢🟢: Don't trust DTCC for that day
🔴🔴: Don't trust DTCC for that day
🟢🔴: Longs in London above Midnight Opening Price, Shorts in New York under Midnight Opening Price
🔴🟢: Shorts in London under Midnight Opening Price, Longs in New York under Midnight Opening Price
Reminder: NEVER rely solely on DTCC, DTCC can be wrong and is not right 100% of times.
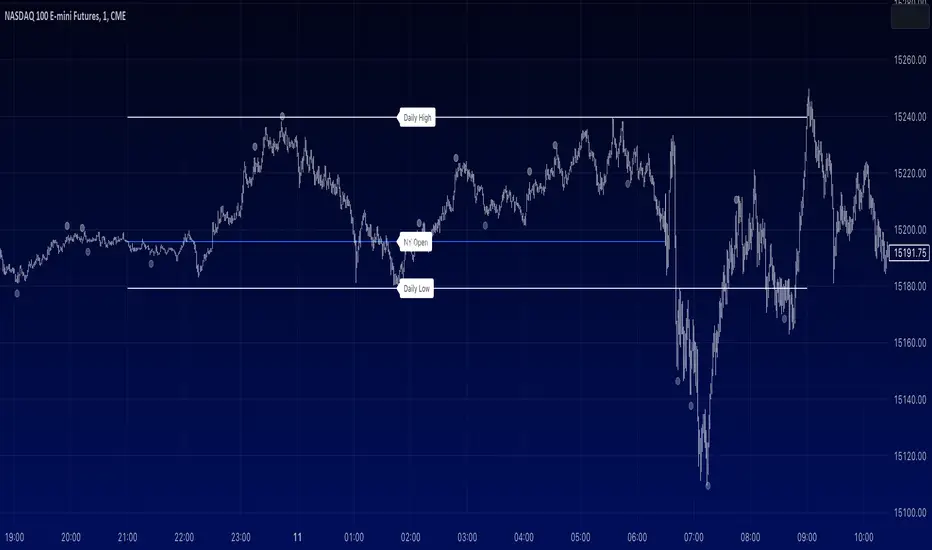
ICT - NY Session Open + Daily High/Low Markers [1m Chart]For ICT lovers, this marks the swing low, swing high of NY opening so you can scalp the open.
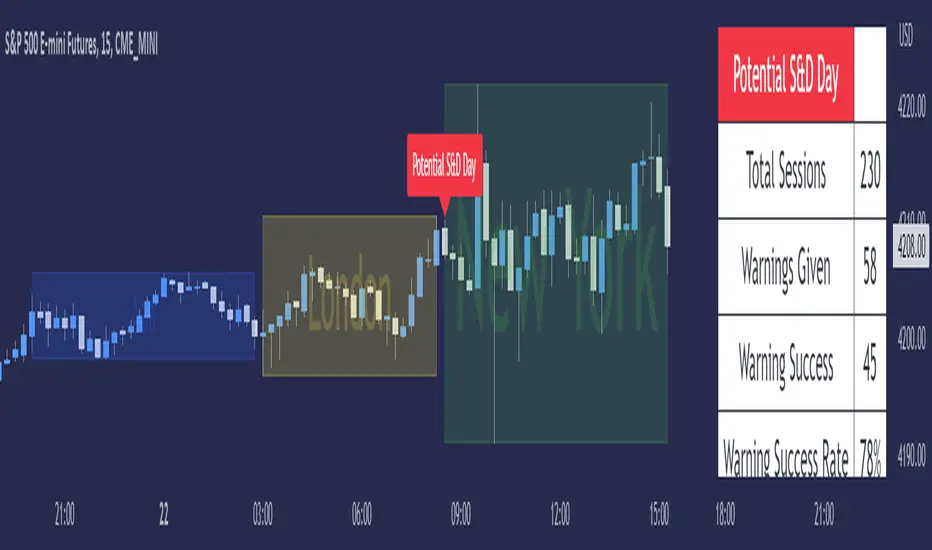
ICT Seek & Destroy Profile [TFO]The goal of this indicator is to anticipate potentially "choppy" New York trading sessions, based on what price does during the Asia and London trading sessions. Based on some user-defined success criteria, we can also track how successful these warnings are.
Many Inner Circle Trader (ICT) students have noted that choppy New York sessions are often preceded by erratic London sessions which take both the high and low of the Asian range.
When this criteria is true and warnings are enabled, a table will automatically populate with a custom warning message for the duration of the NY session, indicating to the user that it could be a choppy trading day.
We can measure and track the success rate of these warnings via the following success criteria:
- NY stays within London range
- NY exceeds London high and low
- NY closes within London range
- NY range is too small
The first three criteria should be self explanatory - the NY range either stays within the London high & low, exceeds them both, or closes within them.
The last criteria is a measure of the New York range compared to a user defined standard deviation of all historical ranges (for the number of sessions that the current chart can load). The default value of 1.5 would imply that a "successful" S&D day could be if the NY range (from high to low) was less than or equal to 1.5 standard deviations of all past ranges.
All these options can be toggled on/off as well, for those that only want to consider certain success criteria and not others. When any of the selected success criteria are true, that essentially indicates that the current session's warning was successful.
ICT Commitment of Traders° by toodegreesDescription:
The Commitment of Traders (COT) is a valuable raw data report released weekly by the Commodity Futures Trading Commission (CFTC). This report offers insights into the current long and short positions of three key market entities:
Commercial Traders ( usually represented in red )
Large Traders ( typically depicted in green )
Small Speculator Traders ( commonly shown in blue )
The concept of utilizing the COT data as a strategic trading tool was first introduced by Larry Williams, who emphasized the importance of monitoring Commercial Speculators – large corporate producers or consumers of commodities.
The Inner Circle Trader (ICT) prompts us to delve deeper into this data. While we can easily determine their Net Position (also referred to as the Main Program) by subtracting Commercial Short Positions from the Commercial Long Positions, this calculation doesn't reveal their ongoing Hedge Program .
Merely following the Main Program won't provide a trading edge. Aligning with the Hedge Program can be an invaluable weapon in your trading arsenal.
The Commercial Speculators' Hedge Program can be unveiled by examining the highest and lowest reading of their Net Position over a chosen time period and setting a new "zero line" between these extremes. This process generates a novel "COT Graph" providing a detailed understanding of the Commercial Speculators' current market activity.
When the Hedge Program, Seasonality, and Open Interest are cross-referenced with Institutional Orderflow, a trader can construct a very clear medium-to-long-term market narrative.
Features:
Access COT Data for the Commercial Speculators via Tradingview's reliable data source
Automate calculations and display the 3-month, 6-month, 12-month, 2-year, and 3-year Hedge Program
Define your own Custom Time Range for the Hedge Program
Display the Main Program and all Hedge Programs in an easy-to-understand table format
Additionally, by following the included instructions, you can augment your table with COT data from multiple markets. This extra information can help monitor correlated markets and develop a more robust market narrative:

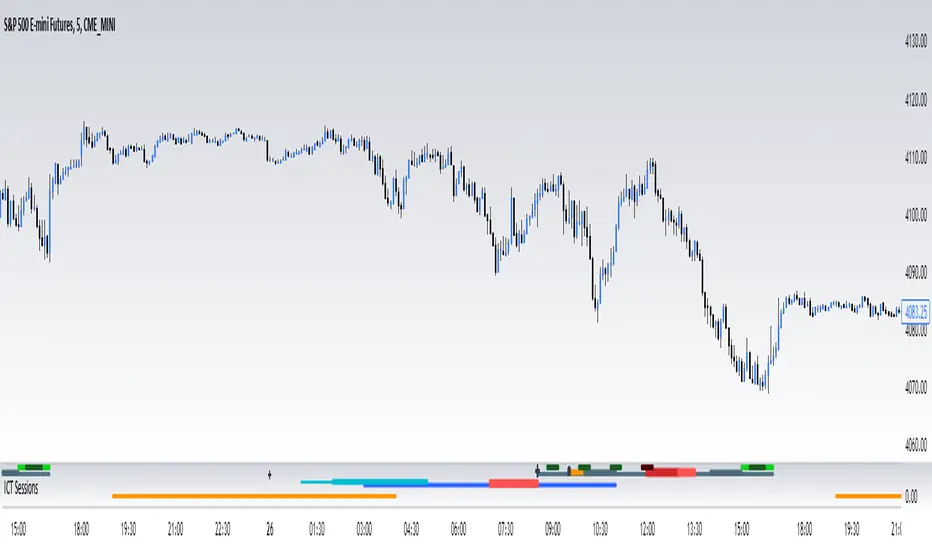
ICT Time Windows by Scuba SteveJust an easy to use time based indicator that allows you to track ICT London Open Killzone, New York Open killzone, AM session Silver Bullet time window & PM Session Silver Bullet Time Window, and last but not least the Last Hour of trading which often has nice moves.

ICT SessionsThis script plots the timewindows of the ICT killzones (for forex) and trading session + makros below the chart. Individual components can be switched of to your liking
ICT MakrosThis script highlights the ICT trading makros and silverbullet timewindows with different background colors on your chart. The drawings are only visible on the timeframe 1min - 5min because they become useless above and i didnt code the logic for below 1min
ICT Session Opening FVG / Silver Bullet [MK]Students of ICT concepts will know that the first FVG found within particular session periods can identify an important price level for intraday traders.
"Find the first FVG at the start of the session and drag a box from it to the right"....ICT
The script finds the first FVG (either bull or bear) within the following periods:
London Killzone (0200 - 0500) EST
02:00 - 0259
03:00 - 0359
0400 - 0459
Dead Zone (05-00 - 0600) EST
05-00 - 0559
0600 - 0659
NY AM Killzone (0700 - 1100) EST
0700 - 0759
0830 - 0929
0929 - 0959
1000 - 1100 (Silver Bullet)
A chart higher timeframe can be chosen to detect the FVGs and they will be displayed on lower timeframe. Default is 5min for detection. I like to then following price reacting to 5mi FVGs on a 1 min chart.
FVG boxes can be extended to the end of the session, or to any time within the current days trading hours. Colors/Labels/ Session Periods can all be edited. A maximum timeframe for display is available and
timezone can be adjusted.
FVGs are only shown for the current days trading hours.

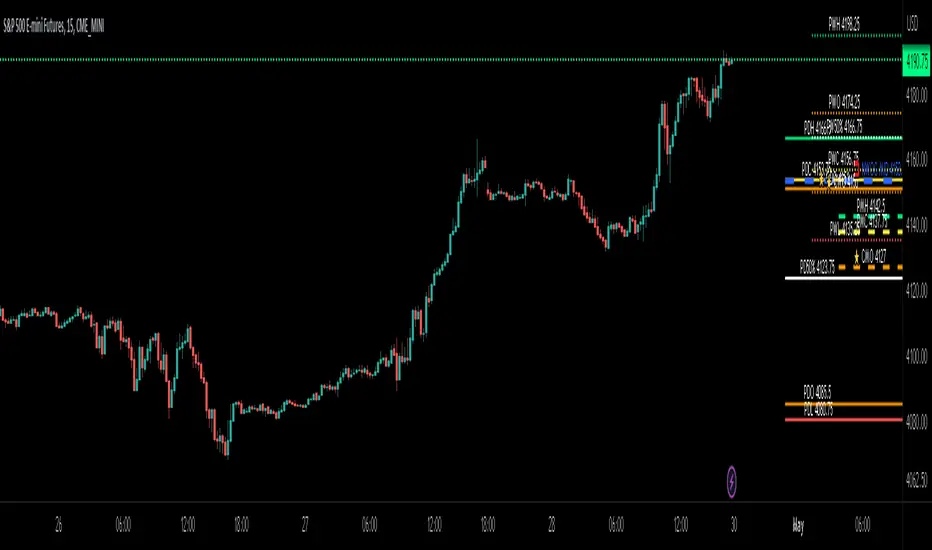
ICT Day/Week/Month Levels [MK]Displays Open, High, Low, Close and 50% levels for the Previous Day/Week/Month.
Also shows the Open for the Current Day/Week/Month
Also shows the Current New Week Opening Gap Midline (NWOG)
These levels are key to teachings by ICT as well as other trading strategies. There are lots of scripts available for this data, however this one plots the levels to the right of price on the chart to keep the chart as clean as possible. The line styles, colors and text can be customised. The offset to the right of the chart for the start of line and label offsets can also be adjusted.
Labels are abbreviated to PDH (previous day high), CMO (current month open), PW50% (previous week 50% from high to low) ..etc
ICT Macros by CryptoforICT Macros by Cryptofor
Time periods in which the price is most volatile. At this time, the algorithm is programmed to attack liquidity or fill a significant FVG from which the OF can continue.
Plots of macros:
1. London Macros:
02:33 - 03:00
04:03 - 04:30
2. New York AM Macros:
08:50 - 09:10
09:50 - 10:10
10:50 - 11:10
3. New York Lunch + PM Macros:
11:50 - 12:10
13:10 - 13:40
15:15 - 15:45
Features:
Flexible line settings
Flexible text settings
Display data for all time or for the last 24 hours
Switch for each type of macro
Macro background color settings

ICT MTF FVG [MK]FVGs (Fair Value Gaps) are significant levels that may act as support or resistance to price. The script finds FVGs as per ICT trading system, then plots the full FVG to the right side of the chart. FVG boxes do not change size when they are semi-mitigated as its important to know where the original FVG midpoint lies. Plotting to the right side of price allows for a cleaner chart. The script is MTF and can display FVG boxes for the following timeframes. Chart, 5,10,15,30,1hr,4hr,8hr,12hr,D,W,M.
Below shows 1hr FVGs marked out. NOTE: this is not what the script does, this is for explanation only.
Below shows what the script will do. 1hr FVGs shown on 15min chart
