Imbalance(FVG) DetectorImbalance (FVG) Detector
Overview
The Imbalance (FVG) Detector is a technical analysis tool designed to highlight price inefficiencies by identifying Fair Value Gaps (FVGs). These gaps occur when rapid price movement leaves an area with little to no traded volume, which may later act as a zone of interest. The indicator automatically detects and marks these imbalances on the chart, allowing users to observe historical price behavior more effectively.
Key Features
- Automatic Imbalance Detection: Identifies bullish and bearish imbalances based on a structured three-bar price action model.
- Customizable Sensitivity: Users can adjust the minimum imbalance percentage threshold to tailor detection settings to different assets and market conditions.
- Real-time Visualization: Marked imbalances are displayed as colored boxes directly on the chart.
- Dynamic Box Updates: Imbalance zones extend forward in time until price interacts with them.
- Alert System: Users can set alerts for when new imbalances appear or when price tests an existing imbalance.
How It Works
The indicator identifies market imbalances using a three-bar price structure:
- Bullish Imbalance: Occurs when the high of three bars ago is lower than the low of the previous bar, forming a price gap.
- Bearish Imbalance: Occurs when the low of three bars ago is higher than the high of the previous bar, creating a downward gap.
When an imbalance is detected:
- Green Boxes indicate bullish imbalances.
- Red Boxes indicate bearish imbalances.
- Once price interacts with an imbalance, the box fades to gray, marking it as tested.
! Designed for Crypto Markets
This indicator is particularly useful in crypto markets, where frequent volatility can create price inefficiencies. It provides a structured way to visualize gaps in price movement, helping users analyze historical liquidity areas.
Customization Options
- Min Imbalance Percentage Size: Adjusts the sensitivity of the imbalance detection.
- Alerts: Users can enable alerts to stay notified of new or tested imbalances.
Important Notes
- This indicator is a technical analysis tool and does not provide trading signals or financial advice.
- It does not predict future price movement but highlights historical price inefficiencies.
- Always use this tool alongside other market analysis methods and risk management strategies.
Search in scripts for "imbalance"

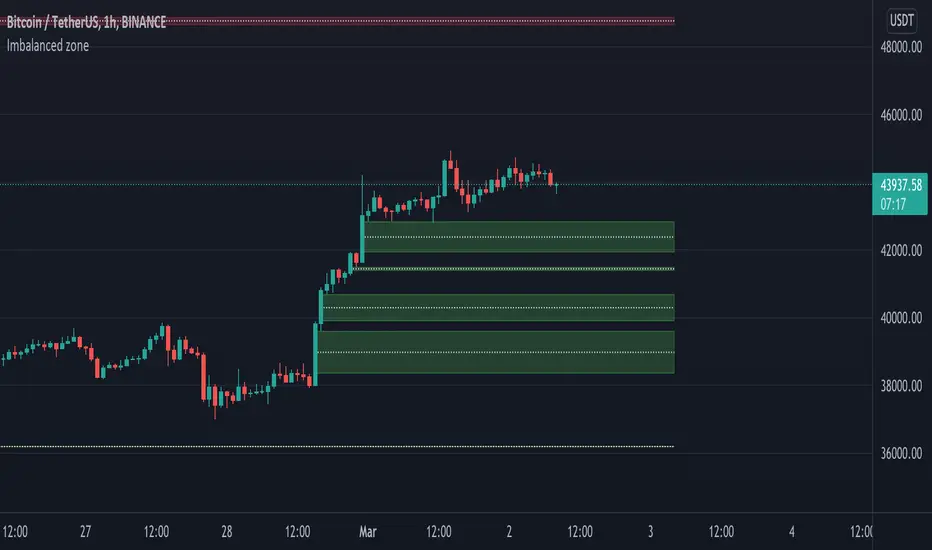
Imbalanced zoneImbalance, this is a zone / gap created when the price move with force in a given direction. It identify a zone where the price could
potentially go back. This gives perfect targets for your trades.
Imbalance is created from the high and low of 3 candles. When the wicks the of 1st and 3rd candle does not fully overlap the middle one.
You can define the penetration ratio which will delete a tested zone from the chart. Usually find that 20% (0.2) is pretty accurate.
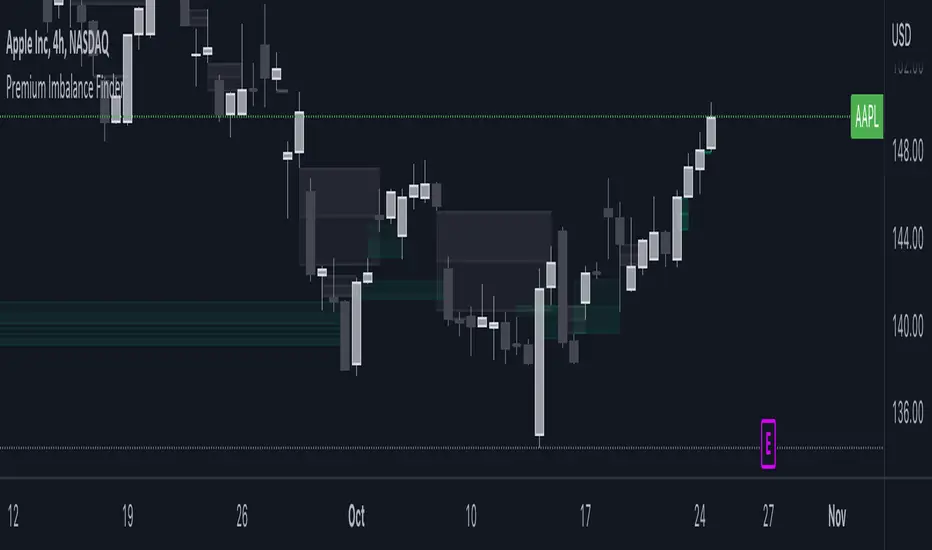
Imbalance FinderImbalance Finder
I struggled to always see it visually this marks whether there is or isn't imbalance
Very quick way of finding imbalance between bars

Imbalance Detector [LuxAlgo]This indicator detects and highlights market imbalances alongside a dashboard returning information about their frequency of occurrence and their fill percentage. Imbalances included in this script are Fair Value Gaps (FVG), Opening Gaps (OG) and Volume Imbalances (VI).
Alerts are available for the occurrences of all market imbalances.
Settings
Imbalances
Each imbalance has the same settings layout:
Imbalance: Enable/disable the detection of the specific imbalance.
Min Width: If enabled, requires the imbalance area width to be greater than the specified value. This minimum width can be expressed in points, percentages or ATR multiples.
Extend: Extend imbalances by a specified number of bars.
Dashboard
Show Dashboard: Enable/disable the dashboard on the chart.
Dashboard Location: Location of the dashboard on the chart.
Dashboard Size: Size of the dashboard.
Usage
Market imbalances are part of the many concepts available to price action traders and highlight areas where there is a disparity between supply and demand.
It is common to see price come back to these areas and traders often use them as supports and resistances but also as targets.
Details
The script can detect three distinct types of imbalances described below.
Fair Value Gaps
Fair Value Gaps (FVG) are three candle formations characterized by a gap between the wicks of the non-adjacent candles in the formation.
A bullish FVG is characterized by a gap between the current price low and the 2 bars anterior price high, and a bearish FVG is characterized by a gap between the current price high and the 2 bars anterior price low.
Opening Gaps
Opening Gaps (OG) are imbalances characterized by non-existent activity within a specific price range.
A bullish OG occurs when the current price low is greater than the previous high, a bearish OG occurs when price high is lower than the previous price low.
Opening Gaps primarily occur in closing markets, as such they are less common in the cryptocurrency market.
Most of the time an Opening Gap will also be accompanied by a Fair Value Gap, in order to avoid clutter the indicator will not detect Fair Value Gaps if Opening Gaps are enabled and if an Opening Gap has been detected
Volume Imbalances
Volume Imbalances (VI) are characterized by a price discontinuity between the opening price and previous close, but unlike Opening Gaps we do not see nonexistent activity within a certain price range.
A bullish VI occur when both the opening and closing prices are superior to the previous closing price, with the current price low overlapping the previous price high. A bearish VI occur when both the opening and closing prices are inferior to the previous closing price, with the current price high overlapping the previous price low.
Because Volume Imbalances can occur excessively on markets with frequent gaps, we make use of an additional condition for filtering out less significant imbalances. Bullish VI's will require the previous price high to be lower than the opening price, while bullish VI's will require the previous price low to be higher than the opening price.

Imbalance Volume Trend📌 Imbalance Volume Trend — Fair Value Gaps + Volume Imbalance + Trend Shifts
Imbalance Volume Trend is a price-action-driven indicator that automatically detects Fair Value Gaps (FVGs), measures the volume imbalance inside each gap, and builds a dynamic trend structure based on the sequence and strength of imbalances.
It visualizes the true power behind impulsive moves and provides early signals of potential trend reversals.
🔍 Core Concept
A Fair Value Gap appears when the market moves aggressively in one direction, leaving an “unfair” price zone caused by a strong imbalance between buyers and sellers.
These zones are often revisited by price, providing high-probability trading opportunities.
This indicator not only marks FVGs but also evaluates how strong the imbalance truly was by analyzing buy/sell volume dominance on the breakout candle.
📘 How the Indicator Works
1. Automatic Fair Value Gap Detection
The indicator scans for the classic 3-candle FVG pattern:
Bullish Imbalance
Candle 2 forms the bullish impulse.
A gap remains between the High of Candle 1 and the Low of Candle 3.
The indicator draws a bullish rectangle covering this area.
Bearish Imbalance
Candle 2 forms the bearish impulse.
A gap remains between the Low of Candle 1 and the High of Candle 3.
A bearish rectangle is drawn around the imbalance.
The breakout candle (the middle candle) forms the core of the imbalance and shows the directional expansion of price.
2. Volume Imbalance Percentage (%)
A unique feature of this tool is the calculation of buyer vs seller volume dominance inside each imbalance.
Can analyze lower-timeframe volumes or tick volumes.
The indicator computes how much buyers or sellers dominated during the formation of the FVG.
A colored percentage label appears near every imbalance, showing:
Buyer dominance % for bullish gaps
Seller dominance % for bearish gaps
This helps traders understand the strength of each imbalance.
Often, during late stages of a trend, the percentage value starts to weaken — giving early warning of trend exhaustion.
3. Imbalance-Based Trend Structure
Another powerful component is the Imbalance Trend Engine, which builds a trend direction using consecutive FVGs.
A trend continues as long as new imbalances form in the same direction.
A trend reversal is detected when:
A new imbalance appears in the opposite direction, and
Its body breaks through a specified level of the previous imbalance of the current trend.
When this event occurs, the indicator plots a colored arrow marking the change in Imbalance Trend.
This creates a clean and logical price-action trend model built entirely on institutional-style imbalances.
4. Alerts & Notifications
The indicator supports TradingView alerts for:
New Imbalance Detected
Imbalance Trend Reversal

Imbalance indicator (Multi-TimeFrame)(USA) Imbalance Indicator (Multi-TimeFrame) is an indicator designed to visualize the imbalance between two adjacent candles on a chart by drawing rectangles. It helps identify the dominance of buyers or sellers during the price's impulsive movement in an uptrend or downtrend.
Here's how the indicator works:
It determines the trend direction (up or down) based on the closing prices of the last three candles. An uptrend is identified if all three candles closed above their openings, and a downtrend if they closed below.
Depending on the trend direction, the indicator calculates the imbalance between candles. The imbalance is expressed as the difference between the low of the next candle and the high of the previous candle for an uptrend or the low of the previous candle and the high of the next candle for a downtrend. The imbalance value should be greater than 0.
When an imbalance is detected, the indicator draws a rectangle on the chart. The rectangle starts at the candle with the detected imbalance, the upper border is at the top of the imbalance, and the lower border is at the bottom of the imbalance.
The color of the rectangle depends on the trend direction: green for an uptrend and red for a downtrend.
The rectangle continues dynamically to the right until it is intersected by the next candles by 50% or more (by default). The intersection can occur in various combinations (shadow, body, or shadow + body of the candle). Once this happens, the rectangle ends on the last overlapping candle. The height overlap percentage is adjustable in the range of 1 to 100, with a default value of 50%.
Use the Imbalance Indicator to identify potential price reversal zones. Algorithms aim to cover the imbalance and trade the range in which it formed, representing a potential magnet for the price.
In the multi-timeframe version of the indicator, along with the current timeframe, rectangles from timeframes: 15 minutes, 1 hour, 4 hours, and 1 day are displayed by default (and can be adjusted in settings). Other timeframes (e.g., 1 week and 1 month or 30 minutes) can be selected in the settings.
You can activate/deactivate the display of imbalances from different timeframes of your choice by setting the corresponding checkbox.
Additionally, rectangles from different timeframes have different default levels of transparency, decreasing with increasing timeframe.
Frames on additional timeframes are disabled by default in transparency settings; adjust as needed in color settings.
Like in the previous version, you can customize the color scheme of rectangles for each timeframe individually.
Information display about timeframes other than the current one on imbalances is available and can be disabled in settings for each timeframe individually.
For your convenience, in the buyers' interest zone, a label is placed at 50% of the rectangle's width, spanning 3 candles. Now you can set a limit order right at the label without relying on Fibonacci retracements.
(RUS) Imbalance indicator (Multi-TimeFrame) - это индикатор, предназначенный для визуализации имбаланса между двумя соседними свечами на графике путем рисования прямоугольников. Он помогает определить доминирование покупателей или продавцов во время импульсного движение цены на восходящем или нисходящем тренде.
Вот как работает индикатор:
Он определяет направление тренда (вверх или вниз) на основе закрытия последних трех свечей. Тренд вверх определяется, если все три свечи закрылись выше своих открытий, а тренд вниз - если ниже.
В зависимости от направления тренда, индикатор вычисляет имбаланс между свечами. Имбаланс выражается в виде разницы между низом следующей свечи и верхом предыдущей свечи для восходящего тренда или между низом предыдущей свечи и верхом следующей свечи для нисходящего тренда. Значение имбаланса должно быть больше 0.
Если имбаланс обнаружен, индикатор рисует прямоугольник на графике. Прямоугольник начинается на свече с найденным имбалансом, верхняя граница прямоугольника находится на верхней границе имбаланса, а нижняя граница - на нижней границе имбаланса.
Цвет прямоугольника зависит от направления тренда: зеленый для восходящего тренда и красный для нисходящего тренда.
Прямоугольник продолжается вправо динамически, пока его не пересекут следующие свечи на 50% или более (по умолчанию). Пересечение может произойти различными комбинациями (тень, тело или тень + тело свечи). Как только это происходит, прямоугольник заканчивается на последней перекрывающей его свече. Процент перекрытия по высоте настраивается в интервале от 1 до 100, по умолчанию значение 50%.
Используйте Imbalance Indicator для определения зон вероятного возврата цены. Алгоритмы стремятся перекрыть имбаланс и проторговать диапазон, в котором он образовался, это потенциальный магнит для цены.
В мульти-таймфреймной версии индикатора, наряду с текущим таймфреймом, при первом запуске (и до момента, пока вы не измените это в настройках), отображаются прямоугольники с таймфреймов:
15 минут,
1 час,
4 часа,
1 день.
При этом другие таймфреймы (например 1 неделя и 1 месяц или 30 минут) можно выбрать в настройках.
Вы можете активировать/деактивировать отображение имбалансов с разных таймфреймов по вашему выбору, установив соответствующую галочку.
Кроме того, прямоугольники с разных таймфреймов по умолчанию имеют различную степень прозрачности, которая уменьшается по мере увеличения таймфрейма
Рамки на дополнительных таймфреймах, по умолчанию отключены настройками прозрачности, при необходимости измените это в настройках цвета.
Как и в предыдущей версии, вы можете настраивать под себя цветовую схему прямоугольников, причём для каждого таймфрейма в отдельности.
На имбалансах с отличных от текущего таймфреймов, доступно отображение информации о таймфрейме, данная опция отключается в настройках для каждого таймфрейма в отдельности.
Для вашего удобства, в зоне интереса покупателей, на 50% прямоугольника сделана метка шириною в 3 свечи, теперь не нужно натигивать фибо, можете сразу выставить лимитку по метке.

Imbalance Heatmap (Free) – pc75A clean, efficient visualisation of liquidity voids, 3-bar imbalances, and price inefficiency zones.
This indicator highlights where the market left gaps in the order flow — areas price often revisits to rebalance.
Imbalances are displayed as stacked horizontal “heatmap strips,” making it easy to see:
Where aggressive buying/selling left a void
Whether multiple voids overlap (stronger zones)
Whether price is likely to return to fill the imbalance
How old a void is (older zones are marked differently)
This is a refined v6 rewrite based on a script I liked, completely modernised with cleaner logic, better performance, and optional labels.
🔍 Features
3-bar liquidity void detection (ICT-style logic)
Bullish imbalance when price displaces upward with no wick overlap
Bearish imbalance for downward displacement
✔ Heatmap-style visualisation
Each imbalance is sliced into multiple thin horizontal bands to create a visual density effect.
✔ Stacking intelligence
If a new void overlaps previous ones, the heatmap is drawn brighter, showing areas where the market left multiple inefficiencies.
✔ “Void xN” labels
Optional labels show how many overlapping voids existed at the moment the imbalance formed.
✔ Automatic deletion when filled
As soon as price trades back through a slice, that slice is removed.
This keeps the chart clean and focuses only on active inefficiencies.
✔ Smart ageing
Older voids are marked with a subtle border so you can distinguish freshly formed inefficiencies from historical ones.
✔ Alerts
Set alerts for when price taps a stacked imbalance zone (“Void x2” and above).
⚙ Inputs & Customisation
ATR threshold (optional)
Minimum tick size gap
Number of heatmap slices
Bullish / bearish toggles
Label toggles
Colour and transparency configuration
Max slice memory for performance
💡 How to Use
Imbalance zones often behave as:
Magnets → price gravitates toward them
Support/resistance → structure respects inefficiencies
Continuity points → used with market structure shifts
Targets → for both scalpers and swing traders
Strong (stacked) voids typically represent areas of institutional displacement, where the market is more likely to return for rebalancing.
📢 Notes
This is the free version.
Educational only — not financial advice.

Imbalance Scanner [Afnan]Identify the most aggressive candles on any chart—instantly or historically—and act before the crowd notices.
🔥 What It Does
Four-tier detection system: 🟡 Low → 🟠 Mild → 🔴 Explosive → 💥 Super Explosive
Smart filtering: Detects abnormal candle bodies and ranges that signal market imbalances
Volume confirmation: Optional filter ensures moves are backed by institutional-level activity
Directional control: Choose All, Bullish, or Bearish candles to match your trading bias
Pine Scanner optimized: Scan entire watchlists in real-time or historically.
Clean interface: Minimal emoji labels with background highlighting—no chart clutter
⚡ Quick Setup
1. Load & Configure: Add to chart and open indicator settings
2. Set Detection Level: Choose minimum imbalance strength (Low/Mild/Explosive/Super)
3. Optional Volume Filter: Enable for higher-quality signals with volume confirmation
4. Pine Scanner Setup: Set "Days Back" (0 for live scanning, >0 for historical analysis)
5. Create Alerts: Pre-built alert conditions for each explosive level
🎯 Primary Use Cases
Smart Money Detection: Spot where big players are active through explosive price movements
Market Inefficiencies: Find supply/demand imbalances as they develop
Breakout Confirmation: Validate genuine breakouts using explosive candle analysis
Identify momentum acceleration points for optimal timing
📊 Pine Scanner Ready
Fully compatible with TradingView's Pine Scanner for real-time watchlist monitoring and historical analysis.
💼 Professional Edge
Built by @AfnanTAjuddin for active traders who need reliable, fast imbalance detection across any market or timeframe. Perfect for day trading, swing trading, and institutional activity tracking.

Imbalance IndicatorDescription of the "Imbalance Indicator":
The Imbalance Indicator is a technical analysis tool designed to visualize the imbalance between two adjacent candlesticks on a price chart by drawing rectangles. It helps to identify the dominance of buyers or sellers during impulsive price movements within an upward or downward trend.
Here's how the indicator works:
1. It determines the direction of the trend (up or down) based on the closing prices of the last three candlesticks. An upward trend is identified if all three candlesticks close above their opening prices, while a downward trend is identified if they close below.
2. Depending on the direction of the trend, the indicator calculates the imbalance between the candlesticks. The imbalance is expressed as the difference between the low of the next candlestick and the high of the previous one for an upward trend, or between the low of the previous candlestick and the high of the next one for a downward trend. The imbalance value must be greater than 0.
3. If an imbalance is detected, the indicator draws a rectangle on the chart. The rectangle begins on the candlestick with the identified imbalance, with the upper boundary at the upper edge of the imbalance and the lower boundary at the lower edge of the imbalance.
4. The color of the rectangle depends on the direction of the trend: green for an upward trend and red for a downward trend.
5. The rectangle dynamically extends to the right until it is intersected by subsequent candlesticks by 50% or more (by default). The intersection can occur with various combinations (shadow, body, or shadow + body of the candlestick). Once this happens, the rectangle ends on the last overlapping candlestick. The percentage of overlap in height is adjustable within a range of 1 to 100, with a default value of 50%.
Use the Imbalance Indicator to identify areas of probable price reversal. Algorithms tend to cover the imbalance and trade within the range where it formed, creating a potential magnet for the price.
==RUS=======================================
Описание индикатора "Imbalance Indicator":
Imbalance Indicator - это индикатор, предназначенный для визуализации имбаланса между двумя соседними свечами на графике путем рисования прямоугольников. Он помогает определить доминирование покупателей или продавцов во время импульсного движение цены на восходящем или нисходящем тренде.
Вот как работает индикатор:
1. Он определяет направление тренда (вверх или вниз) на основе закрытия последних трех свечей. Тренд вверх определяется, если все три свечи закрылись выше своих открытий, а тренд вниз - если ниже.
2. В зависимости от направления тренда, индикатор вычисляет имбаланс между свечами. Имбаланс выражается в виде разницы между низом следующей свечи и верхом предыдущей свечи для восходящего тренда или между низом предыдущей свечи и верхом следующей свечи для нисходящего тренда. Значение имбаланса должно быть больше 0.
3. Если имбаланс обнаружен, индикатор рисует прямоугольник на графике. Прямоугольник начинается на свече с найденным имбалансом, верхняя граница прямоугольника находится на верхней границе имбаланса, а нижняя граница - на нижней границе имбаланса.
4. Цвет прямоугольника зависит от направления тренда: зеленый для восходящего тренда и красный для нисходящего тренда.
5. Прямоугольник продолжается вправо динамически, пока его не пересекут следующие свечи на 50% или более (по умолчанию). Пересечение может произойти различными комбинациями (тень, тело или тень + тело свечи). Как только это происходит, прямоугольник заканчивается на последней перекрывающей его свече. Процент перекрытия по высоте настраивается в интервале от 1 до 100, по умолчанию значение 50%.
Используйте Imbalance Indicator для определения зон вероятного возврата цены. Алгоритмы стремятся перекрыть имбаланс и проторговать диапазон, в котором он образовался, это потенциальный магнит для цены.

Imbalance Finder By DrewThis indicator is created to find the imbalances when a market exchange receives too many of one kind of order—buy, sell, limit—and not enough of the order's counterpoint. If you know how to trade the imbalances, this indicator can help you by find imbalances automatically.

Imbalance (FVG)Indicator Description
This script is designed to automatically identify and visualize Fair Value Gaps (FVGs), also known as Imbalances, on your chart. An FVG is a key price action concept that highlights areas where the price moved swiftly, leaving a gap behind. This indicator is simple to use and fully customizable, making it an excellent tool for both novice and experienced traders.
Key Features
Automatic Detection: The indicator scans the market in real-time, automatically drawing FVG zones for both Bullish and Bearish moves.
Mitigation Tracking: When the price returns to an FVG zone, the indicator automatically marks it as "mitigated" (filled) by changing its color and style. This provides a clear signal that the imbalance has been neutralized.
Extend Zones Into the Future: Unmitigated FVG zones are automatically extended into the future, allowing them to be used as potential future support or resistance levels.
Full Customization: The user has complete control over the indicator's appearance. You can change the colors for bullish, bearish, and mitigated zones, as well as toggle their visibility on and off.
Performance Optimization: A built-in limit for the number of drawn objects prevents chart clutter and avoids errors from TradingView's drawing limits, ensuring smooth performance.
How to Use?
FVG zones can be used in various ways, including:
Price Magnets: Markets often tend to revert to "fill" these gaps.
Potential Entry Points: Price entering an FVG zone can present an opportunity to open a position, especially if confirming signals appear.
Support/Resistance Zones: Unfilled gaps can act as strong, dynamic levels of support or resistance.

Imbalance, ADR Daily Target & ADR > 3X1 x ADR Movement Calculated on the Asian Session - Times can be altered to suit your parameters
Daily Target is set High from low of Asian Range and Low from High of Asian Range
0-3X ADR Calculated and Displayed from a point you select for the following days targets - can be set Bearish or Bullish and ADR parameters can be altered
Imbalance Finder - Can be switched on or off to show imbalance on current time frame - default is off

Imbalance Identifier With Target BoxTarget Area to help me with my target area for visual reference
Imbalance Identifier - Helps me to see where the trade may come back to
EMA on 1 Minute Time frame for helping to identify Direction to take trades in
I primarily use this as a tool to help me identify very short term direction for scalping small target area (Adjustable)
Preset for the main 28 Forex Pairs, US30,US100,US500 Dax40 and Gold on the 1 Minute timeframe

Imbalance Imbalance Detection:
Bullish Imbalance: Occurs when the high of the bar two periods ago is lower than the low of the current bar, indicating a possible reversal to the upside.
Bearish Imbalance: Occurs when the high of the current bar is lower than the low of the bar two periods ago, indicating a potential reversal to the downside.
Visual Highlighting:
The script changes the color of the previous bar (one bar before the imbalance) based on whether a bullish or bearish imbalance is detected.
Users can customize the color for both bullish and bearish imbalances to suit their preferences.
User Inputs:
Show Imbalance: Option to toggle the visibility of the imbalance signals on the chart.
Color Customization: Users can choose custom colors for bullish and bearish imbalances, allowing for easy distinction between the two types.
Alert Conditions:
The script includes pre-configured alert conditions for both bullish and bearish imbalances, notifying traders when an imbalance is detected, which can be useful for triggering trades or further analysis.

Imbalance FVG SIBI BISIImbalance Detection Script
Author: © teshmi9z
Script Name: Imbalance FVG
Version: Pine Script® v5
Description:
This script detects and highlights imbalances on the chart, areas where price movement has created a gap without immediate return, signaling potential zones of future support or resistance.
The script identifies two types of imbalances:
Bullish Imbalance: Occurs when the low of two bars ago is less than or equal to the previous bar's open, and the current bar's high is greater than or equal to the previous bar's close.
Bearish Imbalance: Occurs when the high of two bars ago is greater than or equal to the previous bar's open, and the current bar's low is less than or equal to the previous bar's close.
These imbalances are visualized as semi-transparent yellow boxes on the chart, which can be adjusted for transparency.
Parameters:
Transparency (FVG): Adjust the transparency of the yellow boxes, from 0 (opaque) to 100 (fully transparent).
Usage:
This script helps traders quickly identify and visualize potential reversal zones or areas of interest on the chart. It’s a useful tool for pinpointing where significant price reactions may occur.

Volume Gaps & Imbalances (Zeiierman)█ Overview
Volume Gaps & Imbalances (Zeiierman) is an advanced market-structure and order-flow visualizer that maps where the market traded, where it did not, and how buyer-vs-seller pressure accumulated across the entire price range.
The core of the indicator is a price-by-price volume profile built from Bullish and Bearish volume assignments. The script highlights:
True zero-volume voids (regions of no traded volume)
Bull/Bear imbalance rows (horizontal volume slices)
A multi-section Delta Panel, showing aggregated Buy–Sell pressure per vertical sector
A clean separation between profile structure, volume efficiency, and delta flows
Together, these components reveal market inefficiencies, displacement zones, and fair-value regions that price tends to revisit — making it an exceptional tool for structural trading, order-flow analysis, and contextual confluence.
Highlights
Identifies true volume voids (untraded price regions), more precisely than standard FVG tools
Plots Bull vs Bear volume at each price row for fine-grained imbalance reading
Includes a sector-based Delta Grid that aggregates Buy–Sell dominance
█ How It Works
⚪ Profile Construction
The indicator scans a user-defined Lookback window and divides the full high–low range into Rows. Each bar's volume is allocated into the correct price bucket:
Bullish volume when close > open
Bearish volume when close <= open
This produces three values per price level:
Bull Volume
Bear Volume
Total Volume & Imbalance Profile
Rows where no volume at all occurred are marked as volume gaps — signaling true untraded zones, often produced by impulsive imbalanced moves.
⚪ Zero-Volume Gaps (True Voids)
Unlike candle-based Fair Value Gaps (FVGs), volume gaps identify the deeper, structural inefficiency: Price moved so fast through a region that no trades occurred at those prices. These areas often attract revisits because liquidity never exchanged hands there.
⚪ Bull/Bear Volume Imbalance
Every price row is drawn using two colored horizontal segments:
Bull segment proportional to bullish volume
Bear segment proportional to bearish volume
This reveals where buyers or sellers dominated individual price levels.
⚪ Delta Panel
The full volume profile is cut into Summary Sections. For each block, the script computes: Δ = (Bull Volume − Bear Volume) ÷ Total Volume × 100%
█ How to Use
⚪ Spot True Voids & Inefficiencies
Zero-volume zones highlight where the price moved without trading. These areas often behave like:
Refill zones during retracements
Targets during displacement
Thin regions price slices through quickly
Ideal for both SMC-style trading and structural mapping.
⚪ Identify Bull/Bear Control at Each Price Level
Broad bullish segments show zones of buyer absorption, while wide bearish slices reveal seller control.
This helps you interpret:
Where buyers supported the price
Where sellers defended a level
Which price levels matter for continuation or reversal
⚪ Use Delta Sectors for Contextual Direction
The delta panel shows where market pressure is accumulating, revealing whether the profile is dominated by:
Bullish flow (positive delta)
Bearish flow (negative delta)
Neutral flow (balanced or minimal delta)
█ Settings
Lookback – Number of bars scanned to build the profile.
Rows – Vertical resolution of price bins.
Source – Price source used to assign volume into rows.
Summary Sections – Number of vertical delta sectors.
Summary Width – Horizontal size of the delta bar panel.
Gap From Profile – Distance between profile and delta grid.
Show Delta Text – Toggle Δ% labels.
-----------------
Disclaimer
The content provided in my scripts, indicators, ideas, algorithms, and systems is for educational and informational purposes only. It does not constitute financial advice, investment recommendations, or a solicitation to buy or sell any financial instruments. I will not accept liability for any loss or damage, including without limitation any loss of profit, which may arise directly or indirectly from the use of or reliance on such information.
All investments involve risk, and the past performance of a security, industry, sector, market, financial product, trading strategy, backtest, or individual's trading does not guarantee future results or returns. Investors are fully responsible for any investment decisions they make. Such decisions should be based solely on an evaluation of their financial circumstances, investment objectives, risk tolerance, and liquidity needs.

Sonarlab - MTF Imbalance/ FVGAn imbalance is created when the order block creates such impulsive volume in the market that it throws off the equilibrium between buyers and sellers, forming a gap. This is referred to as imbalance or FVG. These gaps act as a magnet for price to retrace to, in order to correct the disturbance in market equilibrium.
Imbalances = FVG
This image above shows you how an imbalance is created in the market using 3 candles. As we all know, candle sticks represent a specific time-range - for example: 1H. This means that inside 1 candle stick, there are 60 1 minute candle sticks resting. What I'm trying to say with this is that you get a totally different picture when you are on the lower timeframes. An imbalance can be overlooked, so it can be very helpful to have the multiple timeframe Imbalances on your screen, so you understand what is actually going on in the bigger picture.
Usage
Focused on combining with SMC:
When trading SMC, Imbalances can be great for POI's (point of interests) or using as targets in the market. Imbalances work like magnets in the market. When the market is imbalanced, it mostly wants to balance those gaps and can sometimes react perfectly from the area's. Besides that, it can really give you an idea who is in control at that moment.
Here you can see an example of an Imbalance when on the 1H timeframe - in the next picture below you can see the exact same imbalance, but then on the 3M. Now you understand why it can be overlooked?
So, imbalances/ FVG's:
- Increase probability of certain Point of Interests
- Can be a sign of strong interest in price areas
- Can be used as targets
- Can be used as POI's
What makes this Imbalance indicator different?
The Sonarlab MTF Imbalance indicator makes it possible to show up to 3 higher timeframes, which makes it easier to do your analysis and spot these areas when trading.
Volume Gaps and ImbalancesThis Pine script indicator is designed to visually depict price inefficiencies, as identified by Volume Imbalances (VI) or Gaps. A Volume Gap is a scenario where the wicks of two successive candles don’t intersect, while an Imbalance occurs when only the wicks overlap, leaving the bodies apart. These zones of inefficiency frequently act as magnets for price, with the market striving rebalance in accordance with ICT principles.
Relevance:
Volume Gaps/Imbalances are zones of highly inefficient price delivery as per ICT concepts and represent a very strong draw to price. Price will often seek to rebalance those zones to ensure efficient price delivery. Consequently, these zones can provide good targets for entries in the opposite direction or take profit targets for previous entries in the direction of the Gap/Imbalance.
How It Works:
The indicator keeps track of all Gaps/Imbalances from the beginning of the available history. It automatically removes all mitigated Gaps/Imbalances, which are situations where the price has at least reached the bottom of a bullish gap or the top of a bearish gap.
On the last bar, the most recent valid gaps are highlighted with a box drawn from the start to the end of the gap. The start of a bullish gap is determined by the highest price of the previous candle’s open or close, while for bearish gaps, it’s the lowest price of the previous candle’s open or close. Conversely, the end of a bullish gap is the lowest price of the current candle’s open or close, and for bearish gaps, it’s the highest price of the current candle’s open or close.
To enhance the indicator’s speed and minimize chart noise, only the most recent gaps will be displayed, up to the limit set in the indicator settings.
Each displayed VI/GAP will indicate the size of the imbalance in ticks. For imbalances greater than 3 ticks, which represent stronger draws of liquidity, the color transparency will be reduced, and the text will be made more prominent. Volume Gaps are also marked with a 🧲 emoji for easy visual identification.
The indicator will automatically extend the boxes representing valid imbalances to the current bar for as long as the imbalance is not mitigated.
If an imbalance has been tapped, but not mitigated, the indicator will append 🚩emoji to denote that the imbalance has been partially mitigated and may no longer have as strong of a draw for price.
Configurability:
A user may configure the number of imbalances to show, the setting applies to bullish/bearish imbalances individually. This setting can be set to any value from 1 – 50.
Appearance wise, color, style and color transparency of each box representing an imbalance can be configured. The imbalance box label can be configured by setting the text size, along with the vertical & horizontal alignment.
What makes this indicator different:
Designed with high performance in mind, to reduce impact on chart render time.
Only keeps valid imbalances on the chart, with a limit on the # drawn
Indicates the size of the gap and provides visual markets to denote stronger, weaker and partially mitigated gaps

Fractal Break Imbalance / Fair Value Gap (FVG) / Liquidity VoidFractal Break Imbalance / Fair Value Gap (FVG) / Liquidity Void
Order imbalances in either direction, either excess buy or sell orders, reduce liquidity. The market will seek to fill gaps sooner or later. The script marks an imbalance / FVG after a fractal break. It also marks any other imbalance.
Default Colours:
Green - Imbalance after fractal break to the upside
Red - Imbalance after fractal break to the downside
Yellow - Other imbalances
How To Use:
Gaps can be used to determine possible entries and targets. Those familiar with liquidity raids, supply and demand, and ICT concepts may realise it's potential.
Indicator in use:

Fair Value Gap / iVFG / Imbalance / MTF SuiteDescription
This indicator detects Fair Value Gaps (FVGs) and Imbalances across up to 10 user-selected timeframes and manages them with precise retest handling and clean visualization options.
What’s unique
3-candle FVG detection per timeframe (no lookahead).
Retest handling: on the first touch the touched edge snaps to the retest wick and the zone recolors (fresh → retested).
Right-side projection limits to avoid endless extensions.
Deterministic multi-TF overlay: HTF zones are computed independently (lookahead off) and drawn in a stable, priority-based order.
iFVG / parked zones: optionally convert a filled gap into an iFVG (parked/blue) instead of deleting/greying it.
Optional Imbalance Add-on (3-candle), with split halves + 50% midline.
How it works (technical)
FVG logic (3 candles):
Bullish when low > high (gap up); Bearish when high < low (gap down).
The created box spans the untraded range of candle B and starts at time .
Retest behavior:
On the first wick-touch, the nearest boundary adapts to the wick extreme. If enabled, the box recolors to a “retested” palette.
Projection:
Boxes extend to the right; optional bar limit constrains length.
Display limits:
FIFO pruning per direction keeps only the newest N boxes; iFVG/grey pools can share or use separate limits.
Imbalance Add-on (optional):
Classic 3-candle imbalance; draws upper/lower halves and an optional 50% midline.
No lookahead / confirmation:
Calculations run with barmerge.lookahead_off; detection finalizes on bar close (repaint-free on close).
How to use
Treat fresh gaps as potential reaction zones or confluence with liquidity / structure.
Use retested gaps for continuation or rejection logic.
Limit right-projection and visible count to keep charts readable on lower TFs.
Combine with your own execution rules (entries, stops, partials).
Key settings
General: adjust/recolor on retest, right-side limit (bars).
Display Limits: max visible per direction; separate iFVG cap if desired.
Visuals: filled vs. outline, transparency, TF labels (auto or custom), label alignment.
Theme: presets (Pegasus Classic, Icefire, Solarized, Heatmap, Pastel, Monochrome) or Custom colors.
Timeframes: enable up to 10 TF slots (e.g., M1/M5/M15/H1/H4/D1…).
Add-on — Imbalance: enable/disable, midline on/off, filled/outline, colors.
Alerts
New Bullish FVG
New Bearish FVG
Add-on: New Bullish Imbalance
Add-on: New Bearish Imbalance
Notes & limitations
FVG detection is confirmed on bar close; intrabar retest recolor can occur as price interacts.
Historical rendering depends on chart history & session settings.
Many TFs + large box counts can be heavy; use projection limits and display caps for performance.
This tool does not generate trade signals; it visualizes inefficiencies for discretionary or rules-based workflows.
Disclaimer
For educational and informational purposes only. Not financial advice.
Access / Support: Invite-only. For access or assistance, please DM.

Unfilled ImbalancesUNFILLED IMBALANCES TRACKER - IDENTIFY HIGH-PROBABILITY REVERSAL ZONES
This advanced indicator automatically detects and tracks unfilled price imbalances (Fair Value Gaps/FVGs) between candle bodies, providing traders with crucial levels where price is likely to return.
METHODOLOGY
This indicator employs an approach to imbalance detection that differs from standard FVG indicators:
1. Body-to-Body Gap Detection: Unlike typical FVG indicators that use wicks, this system exclusively tracks gaps between candle bodies, filtering out noise and focusing on the most significant price inefficiencies.
2. Dynamic Partial Fill Tracking: Our unique algorithm continuously monitors and adjusts imbalance zones as they're partially filled, showing exactly how much of each gap remains unfilled in real-time. This feature helps traders identify the strongest remaining levels.
3. Dual Fill Detection Logic: Proprietary fill detection offers two distinct modes - Distal (gap filled when touched) and Through (requires complete price movement through the entire gap), allowing adaptation to different market behaviors.
KEY FEATURES
Real-Time Imbalance Detection
Identifies body-to-body gaps between consecutive candles
Tracks both bullish and bearish imbalances
Automatically removes filled imbalances from the chart
Advanced Fill Detection Modes
Distal Mode: Imbalance considered filled when price touches the near edge
Through Mode: Requires price to completely trade through the gap
Body Fill Option: Requires candle body (not just wick) to enter the gap zone
Partial Fill Visualization
Watch imbalances shrink in real-time as price partially fills them
Visual representation shows exact percentage of gap remaining
Critical for position sizing and risk management
Flexible Display Options
Full Box Mode: Shows complete imbalance zones
Line Mode: Displays only critical edge levels for cleaner charts
Customizable visual parameters (colors, transparency, line thickness)
Smart Extension Features
Auto-extends visual elements to current price bar
Optional extension into future (0-500 bars)
Statistics table showing active imbalances count and fill rates
TRADING METHODOLOGY
Unfilled imbalances represent areas where price moved too quickly, leaving behind inefficiencies that markets tend to revisit. This indicator helps identify:
High-probability entry zones for trend continuation trades
Logical take profit targets at unfilled gaps
Stop loss placement beyond strong imbalance zones
Market structure breaks when key imbalances are filled
Supply and demand zone identification
HOW TO USE
Apply the indicator to any timeframe (works best on 15m and above)
Configure fill detection mode based on your trading style
Watch for price approaching unfilled imbalance zones
Use partial fill information to gauge zone strength
Combine with your existing strategy for confirmation
TARGET AUDIENCE & BEST PRACTICES
This tool is designed for traders who understand price action and market structure. It works best on:
Liquid instruments with consistent volume
Trending markets where imbalances are more likely to be revisited
Higher timeframes for more reliable signals
LIMITATIONS & CONSIDERATIONS
Imbalances may not always be filled, especially in strong trending markets
Performance varies across different market conditions and instruments
Should be used in conjunction with other analysis methods, not as a standalone system
Gap detection is based on candle closes and may miss intrabar movements
Historical imbalances from many bars ago may lose relevance
SETTINGS EXPLANATION
The indicator includes multiple customization options:
Require Body Fill: Controls whether wicks or bodies must enter gaps
Fill Detection Mode: Choose between Distal or Through modes
Visual Display: Select between boxes or lines
Alert Configuration: Set minimum age before fill alerts trigger
Debug Mode: Learn how the algorithm works with visual feedback
This indicator represents months of research into price inefficiency patterns and provides a systematic approach to identifying and tracking these critical market levels.
Note: Works on all timeframes and markets. Best results on liquid instruments with consistent volume patterns.

Gaps + Imbalances + Wicks (MTF) - By LeviathanThis script will identify and draw price gaps, wicks and imbalances with customizable fill conditions, multi-timeframe function, zone size filtering, volume comparison, lookback filtering, as well as highly customizable appearance and settings.
I’ve made this indicator to combine the three similar but different elements that occur in price movements and serve as significant zones of interest or way of PA interpretation in various different strategies.
Imbalances (or Fair Value Gap/FVG/Inefficiency/whatever)
- The Imbalance “pattern” consists of 3 candles (1- candle before the sharp move, 2 - sharp move candle and 3- candle after the sharp move). When price makes a move downwards, the imbalance zone is defined as the area between the low of 1 and the high of 3 When price makes a move upwards, the imbalance zone is defined as the area between the high of 1 and the low of 3.
Gaps
A price gap is an area on a chart where no trading activity has taken place. A gap up means that the low of the current candle is higher than the high of the previous candle and a gap down means that the high of the current candle is lower than the low of the previous candle.
Wicks (or shadows/tails/whatever)
Wicks are used to indicate where the price has fluctuated relative to the opening and closing price of the candle. An upper wick is the zone between candle high and candle close/open (whichever is higher) and a lower wick is the zone between candle’s low and candle’s close/open (whichever is lower).
Settings Overview
“Zone Type” - This input lets you decide which zones should the script plot and on which timeframe. You should always pick a timeframe higher than your chat’s.
“Middle Line, Top Line, Bottom Line” - Show or hide the Middle Line (horizontal level in the middle of each zone), Show or hide Top Line (horizontal level at the top of the zone), Show or hide Bottom Line (horizontal level at the bottom of the zone)
“UP/DOWN Zones" - This input lets you show/hide UP Zones or DOWN Zones an pick their color, border color and label color.
”Fill Condition” - If turned ON, the zones will end drawing when your prefered Fill Condition is met (Full Filll = price mitigates the whole zone, Half Fill = zone is at least halfway mitigated and Touch = zone is touched by price). If turned OFF, the zones will only be plotted for the amount of bars defined it “Zone Length”.
”Lookback (D)” - This input lets you limit the amount of zones plotted on the chart by choosing how many days back in time should the script go to find and plot zones. For example, input 1 will only show you the zones of the past day, input 7 will only show you the zones of the past week.
”Hide Filled Zones” - If turned ON, the zones that have been filled will be removed from the chart.
”Show Boxes” - Show or hide the boxes that represent the zones. This is useful for those who want the zones to be visualized by just lines.
“Filter Type” - this input lets you create a filter that will make the script only show zones that are larger than ATR or larger than a certain percentage. You can choose the ATR Length and the multiplier (higher multiplier → larger zone required), as well as the Percentage (%) and its multiplier (higher percentage → larger zone required). If you choose “None”, the zones of all sizes will be plotted.
”Zone Labels” - this part of the settings lets you: show/hide labels, decide on the size of the labels and their positions, choose a custom name for each zone, choose the data that the labels present (Type of the zone/Timeframe/ Volume ).
”Other settings” - ‘Stop/Delete zone after X number of candles’ will force stop/delete the zone if it’s plotted for more than prefered number of bars. ‘Line Style’ lets you choose the style and the color of the lines, ‘Zone Length’ defines the length of the zone if Fill Condition is “None”.
More settings, modifications and improvements coming in future updates. This script is a bit old so I will clean up and optimize the code once I have more time.

Volume Delta Imbalance Index [PhenLabs]📊 Volume Delta Imbalance Index (VDII)
Version: PineScript™ v6
Description
The Volume Delta Imbalance Index is an advanced technical analysis tool that combines volume profile analysis with price movement dynamics to identify significant market imbalances. It features a sophisticated analysis system that weighs recent versus historical volume delta imbalance patterns, providing traders with insights into potential market reversals and trend continuation scenarios.
Points of Innovation:
Custom volume delta calculation incorporating price and volume relationships
Adaptive smoothing system based on market volatility
Multi-component analysis combining flow, acceleration, and strength metrics
Real-time volume profile integration with historical context
🔧 Core Components
Volume Profile Analysis: Dynamic volume delta imbalance distribution assessment
Flow Imbalance Detection: Buy/sell pressure evaluation
Strength Analysis: Composite market strength measurement
Acceleration Framework: Volume movement dynamics
Statistical Bands: Adaptive threshold system
🚨 Key Features 🚨
The indicator provides comprehensive analysis through:
Volume Delta: Up to date volume imbalance measurement
Market Structure: Support/resistance level identification
Flow Analysis: Buy/sell pressure visualization
Acceleration Signals: Movement momentum detection
Adaptive Bands: Dynamic overbought/oversold levels
📈 Visualization
Color-coded Columns: Shows direction and strength of imbalance
Signal Lines: Strong buy/sell level indicators
Statistical Bands: Shows normal trading ranges
Gradient Fills: Indicates extreme market conditions
Dynamic Opacity: Reflects trend strength
📌 Usage Guidelines
The indicator offers several customization options:
Basic Settings:
Lookback Period: Analysis timeframe adjustment
Sensitivity Level: Signal response calibration
History Depth: Historical context range
Memory Setting: Recent vs. historical data weight
Visual Settings:
Color Scheme: Bullish/bearish signal colors
Signal Levels: Strong buy/sell thresholds
Band Display: Statistical range visualization
✅ Best Use Cases / Things To Look For:
Wait for establishment in the initial trend when the VDII comes back towards zero and the color of the volume becomes more faint
Once this is established and the VDII pushes through to the other side look for small retracements above the zero line on the VDII leading you to believe it is a likely area for price to retrace and continue in its prior direction
Make sure you see the volume bars become more faint in color to give yo further confluence price will continue in its priorly established direction
⚠️ Limitations
Requires sufficient volume data
Most effective in liquid markets
Historical depth affects calculation speed
Possible lag in highly volatile conditions
What Makes This Unique
Composite Volume Analysis: Combines multiple volume metrics
Adaptive Calculation: Adjusts to market volatility
Profile Integration: Incorporates volume profile analysis
Multi-component Scoring: Weighted analysis system
Memory-efficient Design: Optimized for real-time analysis
🔧 How It Works
The indicator processes market data through four main components:
1. Volume Profile Analysis:
Creates dynamic volume delta distribution profiles
Weights recent versus historical data
Identifies significant price levels
2. Flow Imbalance Detection:
Analyzes buying versus selling pressure
Calculates normalized flow ratios
Determines market bias
3. Strength Analysis:
Measures composite market strength
Incorporates volume-weighted movements
Provides trend strength indication
4. Final Score Calculation:
Combines all components with weighted importance
Applies volatility-based smoothing
Generates final signal output
5. VDII Potential Reversal Confluences
Bars between signal confluence is default set to 10 but you can change it to whatever you’d prefer
Signals are a compiled look at the indicator as a whole determining where it think reversals or retracements are likely
💡 Note:
The indicator performs best in markets with consistent volume and clear trending or ranging conditions. Its sophisticated volume analysis provides valuable insights into market dynamics beyond traditional price-based indicators.
