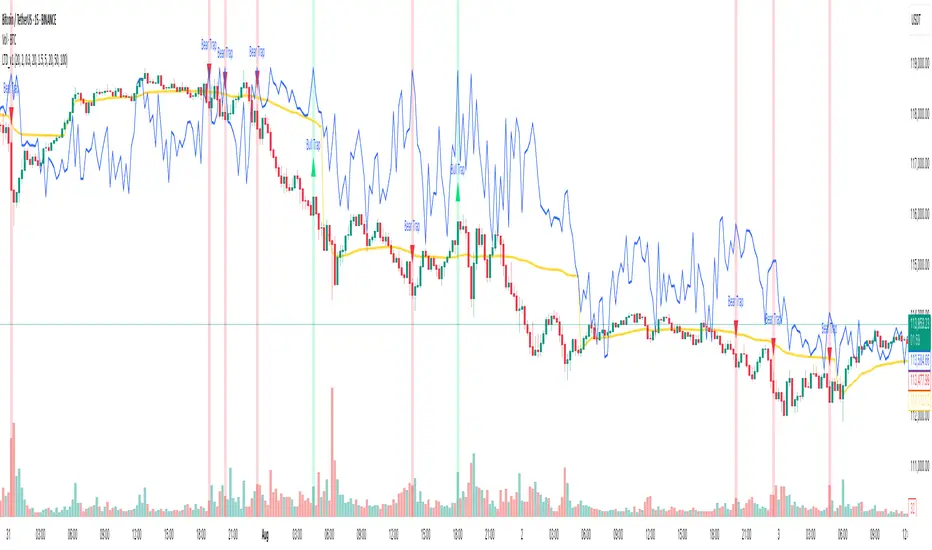
Liquidity Trap Detector (LTD)The Liquidity Trap Detector is an advanced trading tool designed to identify liquidity zones and potential traps set by institutional players. It provides traders with a comprehensive framework to align with smart money movements, helping them avoid common retail pitfalls such as bull and bear traps.
The indicator focuses on detecting liquidity sweeps, breaker blocks, and areas of institutional accumulation/distribution. It integrates multiple technical analysis methods to offer high-probability signals and insights into how liquidity dynamics unfold in the market.
Note : This indicator is not designed for beginners; it is intended for traders who already have a solid understanding of trading fundamentals. It is tailored for individuals who are familiar with concepts like liquidity, order blocks, and traps. Traders with at least 6 months to 1 year of trading experience will fully appreciate the power and potential of this indicator, as they will have the necessary knowledge to leverage its features effectively. Beginners may find it challenging to grasp the advanced concepts embedded in this tool.
Why Combine These Elements?
The components of the Liquidity Trap Detector are carefully chosen to address the core challenges of identifying institutional activity and liquidity traps. Here’s why each element is included and how they work together:
1. Order Blocks:
• Purpose: Identify zones where large institutional players accumulate or distribute positions.
• Role in the Indicator: These zones act as primary liquidity areas, where price is likely to reverse or consolidate due to significant order flow.
2. Breaker Blocks:
• Purpose: Highlight areas where liquidity has been swept, leading to potential price reversals or continuations.
• Role in the Indicator: Confirms whether a liquidity trap has occurred and provides actionable levels for entry or exit.
3. ATR-Based Volatility Zones:
• Purpose: Filter signals based on market volatility to ensure trades align with statistically significant price movements.
• Role in the Indicator: Defines dynamic support and resistance zones, improving the accuracy of signal generation.
4. Volume Delta:
• Purpose: Measure the imbalance between aggressive buyers and sellers, often indicating institutional activity.
• Role in the Indicator: Validates whether a liquidity trap is backed by smart money absorption or retail-driven momentum.
5. Trend Confirmation (EMA):
• Purpose: Align liquidity trap signals with the broader market trend, reducing false positives.
• Role in the Indicator: Ensures trades are executed in the direction of the prevailing trend.
What Makes It Unique?
1. Gen 1 Liquidity Zones and Traps:
• The indicator identifies Gen 1 Liquidity Zones, which represent the first areas where liquidity is accumulated or swept. While these zones often lead to reversals, they can sometimes fail, resulting in continuation moves. The indicator highlights these scenarios, helping traders adapt.
• For example, a bull trap identified in a Gen 1 Zone may see price move higher after an initial red candle, completing a secondary liquidity sweep before reversing.
2. Multi-Layer Signal Validation:
• Signals are only generated when liquidity, volume, trend, and volatility align. This ensures high-probability setups and reduces noise in choppy markets.
3. Dynamic Adaptability:
• ATR-based zones and volume delta filtering allow the indicator to adapt to different market conditions, from trending to range-bound environments.
4. Institutional Insights:
• By focusing on liquidity sweeps, order blocks, and volume imbalances, the indicator helps traders align with institutional strategies rather than retail behavior.
How It Works
The Liquidity Trap Detector uses a step-by-step process to identify and validate liquidity traps:
1. Identifying Liquidity Zones:
• Order Blocks: Mark key zones of institutional activity where price is likely to reverse.
• Breaker Blocks: Highlight areas where liquidity sweeps have occurred, signaling potential traps.
2. Filtering with Volatility (ATR):
• ATR defines dynamic support and resistance zones, ensuring signals are only generated near significant price levels.
3. Validating Traps with Volume Delta:
• Volume delta shows whether liquidity sweeps are backed by aggressive buying/selling from institutions, confirming the trap’s validity.
4. Aligning with Market Trends:
• EMA ensures signals align with the broader trend to reduce false positives.
5. Monitoring Gen 1 Liquidity Zones:
• The indicator highlights Gen 1 Liquidity Zones where price may initially reverse or sweep further before a true reversal. Traders are alerted to potential continuation scenarios if volume or momentum suggests unmet liquidity above/below the zone.
How to Use It
Buy Signal:
• Triggered when:
• Price sweeps below an order block and forms a breaker block, indicating a liquidity trap.
• Volume delta confirms aggressive selling absorption.
• ATR volatility zone supports the reversal.
• EMA confirms a bullish trend.
• Action: Enter a Buy trade and set:
• Stop Loss (SL): Below the order block.
• Take Profit (TP): Near the next resistance or liquidity zone.
Sell Signal:
• Triggered when:
• Price sweeps above an order block and forms a breaker block, indicating a liquidity trap.
• Volume delta confirms aggressive buying absorption.
• ATR volatility zone supports the reversal.
• EMA confirms a bearish trend.
• Action: Enter a Sell trade and set:
• SL: Above the order block.
• TP: Near the next support or liquidity zone.
Timeframes:
• Best suited for scalping and intraday trading on lower timeframes (5m, 15m, 1H).
• Can also be applied to swing trading on higher timeframes.
Example Scenarios:
1. Bull Trap in a Gen 1 Zone:
• Price sweeps above a resistance order block, forms a breaker block, and reverses sharply. However, if momentum persists, price may continue higher after a minor pullback. The indicator helps traders anticipate this by monitoring volume and trend shifts.
2. Bear Trap with Secondary Sweep:
• Price sweeps below a support order block but fails to reverse immediately, instead forming a secondary liquidity sweep before turning bullish. The indicator highlights both scenarios, allowing for flexible trade management.
Why Use It?
The Liquidity Trap Detector offers:
1. Precision: Combines multiple filters to identify institutional liquidity traps with high accuracy.
2. Adaptability: Works across trending and range-bound markets.
3. Smart Money Alignment: Helps traders avoid retail traps by focusing on liquidity sweeps and institutional behavior.
Search in scripts for "imbalance"
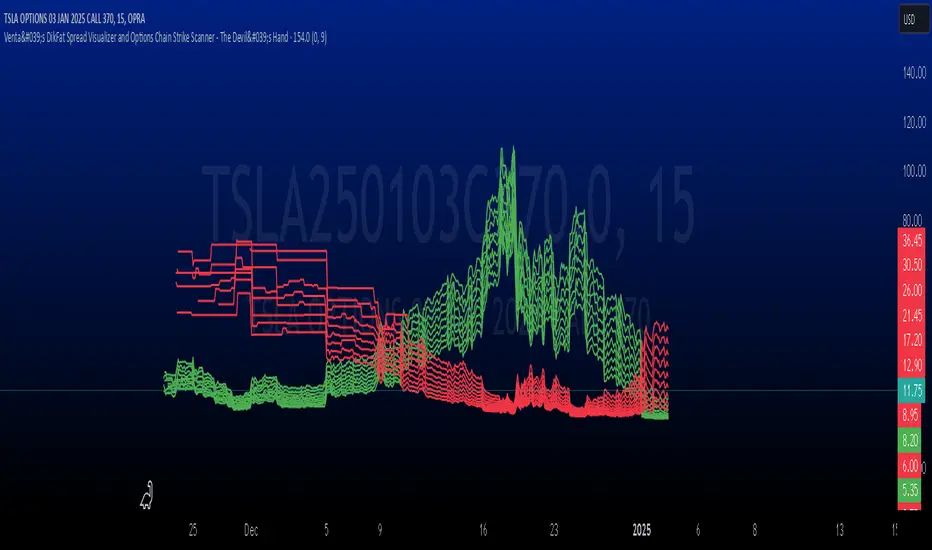
Venta's DikFat Spread Visualizer & Dynamic Options Chain
**Venta's DikFat Spread Visualizer and Options Chain Strike Scanner** is a powerful trading tool designed to give users an immediate view of the nearest options strikes relative to the current price of the underlying asset. This script dynamically displays a selected number of call and put options strikes from the **options chain**, visualizing them directly on the chart for better decision-making.
By default, the script shows options strikes for the current chart’s price, but users have the flexibility to extend the view to include strikes on the opposite side of the market. The available options allow you to show either 3, 6, or 9 strikes on either side of the current price level.
This tool is essential for options traders who want to track strike prices in relation to the underlying asset's price movements. It provides key visual clues such as strike price distributions, volatility, and potential areas of market basing—all in a customizable and user-friendly interface.
---
█ CONCEPTS
This script pulls real-time **options strikes** directly from the **options chain**, providing traders with the ability to see call and put strikes as dynamic price markers on their chart. The concept revolves around understanding the proximity and distribution of strikes based on the current price and market conditions.
Key Features
**Dynamic Options Strike Display**: The script automatically identifies and displays the options strikes closest to the current market price of the underlying asset.
**Customizable Strike Range**: Choose between 3, 6, or 9 strikes on either side of the current price, giving flexibility in visualizing different strike ranges.
**Current Chart Focused by Default**: When added to the chart, the script focuses on the strikes closest to the current price. However, users can opt to include strikes on the opposite side of the market for a broader view.
**Instant Market Context**: The displayed
strikes offer a snapshot of the options market and how the current price relates to potential option expiration levels, helping traders understand key zones.
**Visual Clues on Spreads & Volatility**: This script not only displays the strikes but also provides instant visual clues that reflect the volatility and spread of the options market.
---
█ HOW IT WORKS
The script operates by accessing the **options chain** for the underlying asset, identifying the nearest call and put strikes, and plotting them as visual markers on the chart. This real-time strike data is dynamic, adjusting automatically as the market price moves.
Strike Calculation
The script uses the current price of the underlying asset as a base point and calculates the nearby **options strikes** from the **options chain**.
Depending on the user's settings, the script will plot up to 9 strikes on either side of the price level.
This calculation is performed using live market data, making sure the plotted strikes always reflect the most current market conditions.
Visual Clues
**Spreads**: The space between the plotted call and put options strikes provides immediate insights into the current bid/ask spreads. If the spread between strike prices is wide, it suggests increased volatility or a higher level of uncertainty in the market. Conversely, narrow spreads often indicate market stability or a lack of price movement.
**Market Basing**: When options strikes form a concentrated group near a certain price level, it can indicate that the market is building up or basing at a key level. This might signal the potential for a breakout or a reversal.
**Volatility Insights**: Wider gaps between strikes, particularly on the call side versus the put side (or vice versa), can indicate an imbalance in options trading activity, often a reflection of higher volatility expectations. This visual clue can help traders assess when the market is pricing in significant movements.
Customization and User Settings
**Number of Strikes**: The number of options strikes shown is fully customizable, allowing users to display 3, 6, or 9 strikes on either side.
**Show Opposite Strikes**: By default, the script shows strikes on the current side of the market, but users can enable the option to show strikes on the opposite side to gain a more complete view of the market's options landscape.
**Strike Colors & Width**: Customize the visual appearance of the plotted strikes by adjusting the color and line width for better clarity and chart aesthetics.
---
█ POTENTIAL USE CASES
This indicator is especially valuable for **options traders**, **market analysts**, and anyone interested in gaining insights into the underlying options market. Here are some of the key use cases:
**Options Traders**: Quickly identify the nearest strike prices and understand the risk/reward potential for options positions. The ability to customize the number of strikes shown allows traders to focus on the most relevant price levels.
**Volatility Monitoring**: Use the visual clues from the spread between strike prices to assess the level of volatility in the options market. A wider spread suggests that options traders are expecting more significant price moves, while a narrow spread indicates less expected movement.
**Support and Resistance Identification**: The clustering of strike prices on one side of the market can indicate a potential support or resistance level. By monitoring these levels, traders can get a sense of where the market may reverse or consolidate.
**Market Sentiment Analysis**: A large concentration of call strikes above the current price level, or put strikes below, can be an indication of market sentiment, such as whether traders are generally bullish or bearish.
**Risk Management**: By tracking nearby options strikes, traders can adjust their strategies to minimize risk, especially when market price levels approach significant strike points.
---
█ FEATURES
**Real-Time Data**: The script pulls data from the **options chain**, ensuring that the plotted strikes are always up-to-date with the current market price.
**User-Friendly Interface**: Clear and customizable inputs allow users to easily adjust the number of strikes displayed and control visual settings such as colors and line widths.
**Visual Strike Indicators**: Instantly spot volatility, market basing, and spread imbalances through visual clues from the plotted strikes, enhancing your market analysis.
---
█ LIMITATIONS
**Accuracy Depends on Market Data**: This indicator relies on the available **options chain** data. While the data is updated in real-time, its accuracy may depend on the liquidity and availability of options contracts in the market.
**Not Suitable for Non-Options Traders**: If you don’t trade options, the relevance of this indicator may be limited as it is designed specifically to provide insight into the options market.
**Data Delays**: In fast-moving markets, there may be a slight delay in the updating of strike prices, depending on the data feed.
---
█ HOW TO USE
**Load the Script**: Add the **Venta's DikFat Spread Visualizer and Options Chain Strike Scanner** script to your TradingView chart.
**Adjust Settings**: Use the input options to select the number of strikes you want to display (3, 6, or 9). You can also choose whether to display only the current chart’s strikes or include strikes from the opposite side.
**Interpret the Strikes**: Look at the plotted strikes to gain insights into where the market is currently pricing options and where major strike prices are located. Pay attention to the spreads, concentrations, and volatility signals.
**Monitor the Market**: As the market moves, watch how the strikes shift and cluster, providing you with real-time information about market sentiment and potential volatility.
---
█ THANKS
We would like to extend our gratitude to the PineCoders community for their ongoing support and contributions to the TradingView Pine Script ecosystem. Special thanks to The Options Team.
CandelaCharts - Fair Value Gap (FVG) 📝 Overview
A Fair Value Gap is a three-candle pattern where an unfilled area exists between the high of the first candle and the low of the third candle. This Fair Value Gap represents a price imbalance and often serves as a level of support or resistance on the price chart.
A Bullish FVG occurs when the high of the first candle is below the low of the third candle, creating a gap in price between them.
A Bearish FVG happens when the low of the first candle is above the high of the third candle, also resulting in a price gap.
The indicator is designed to allow traders to precisely and accurately identify Fair Value Gaps (FVGs) across any chosen time frame. Automatically detecting these price imbalances, highlights potential areas where prices may retrace, providing valuable insights into market support and resistance levels. This capability enables traders to make informed decisions based on the presence of FVGs, enhancing their strategies for entry and exit points across different market conditions and time frames.
📦 Features
MTF
Mitigation
Consequent Encroachment
Threshold
Hide Overlap
Advanced Styling
⚙️ Settings
Show: Controls whether FVGs are displayed on the chart.
Show Last: Sets the number of FVGs you want to display.
Length: Determines the length of each FVG.
Mitigation: Highlights when an FVG has been touched, using a different color without marking it as invalid.
Timeframe: Specifies the timeframe used to detect FVGs.
Threshold: Sets the minimum gap size required for FVG detection on the chart.
Show Mid-Line: Configures the midpoint line's width and style within the FVG. (Consequent Encroachment - CE)
Show Border: Defines the border width and line style of the FVG.
Hide Overlap: Removes overlapping FVGs from view.
Extend: Extends the FVG length to the current candle.
Elongate: Fully extends the FVG length to the right side of the chart.
⚡️ Showcase
Simple
Mitigated
Bordered
Consequent Encroachment
Extended
🚨 Alerts
This script provides alert options for all signals.
Bearish Signal
A bearish signal is triggered when the price moves back into a bearish inversion zone and then reverses downward.
Bullish Signal
A bullish signal is triggered when the price returns to a bullish inversion zone and then breaks upward out of the top.
⚠️ Disclaimer
Trading involves significant risk, and many participants may incur losses. The content on this site is not intended as financial advice and should not be interpreted as such. Decisions to buy, sell, hold, or trade securities, commodities, or other financial instruments carry inherent risks and are best made with guidance from qualified financial professionals. Past performance is not indicative of future results.

Silver Bullet ICT Strategy [TradingFinder] 10-11 AM NY Time +FVG🔵 Introduction
The ICT Silver Bullet trading strategy is a precise, time-based algorithmic approach that relies on Fair Value Gaps and Liquidity to identify high-probability trade setups. The strategy primarily focuses on the New York AM Session from 10:00 AM to 11:00 AM, leveraging heightened market activity within this critical window to capture short-term trading opportunities.
As an intraday strategy, it is most effective on lower timeframes, with ICT recommending a 15-minute chart or lower. While experienced traders often utilize 1-minute to 5-minute charts, beginners may find the 1-minute timeframe more manageable for applying this strategy.
This approach specifically targets quick trades, designed to take advantage of market movements within tight one-hour windows. By narrowing its focus, the Silver Bullet offers a streamlined and efficient method for traders to capitalize on liquidity shifts and price imbalances with precision.
In the fast-paced world of forex trading, the ability to identify market manipulation and false price movements is crucial for traders aiming to stay ahead of the curve. The Silver Bullet Indicator simplifies this process by integrating ICT principles such as liquidity traps, Order Blocks, and Fair Value Gaps (FVG).
These concepts form the foundation of a tool designed to mimic the strategies of institutional players, empowering traders to align their trades with the "smart money." By transforming complex market dynamics into actionable insights, the Silver Bullet Indicator provides a powerful framework for short-term trading success
Silver Bullet Bullish Setup :
Silver Bullet Bearish Setup :
🔵 How to Use
The Silver Bullet Indicator is a specialized tool that operates within the critical time windows of 9:00-10:00 and 10:00-11:00 in the forex market. Its design incorporates key principles from ICT (Inner Circle Trader) methodology, focusing on concepts such as liquidity traps, CISD Levels, Order Blocks, and Fair Value Gaps (FVG) to provide precise and actionable trade setups.
🟣 Bullish Setup
In a bullish setup, the indicator starts by marking the high and low of the session, serving as critical reference points for liquidity. A typical sequence involves a liquidity grab below the low, where the price manipulates retail traders into selling positions by breaching a key support level.
This movement is often orchestrated by smart money to accumulate buy orders. Following this liquidity grab, a market structure shift (MSS) occurs, signaled by the price breaking the CISD Level—a confirmation of bullish intent. The indicator then highlights an Order Block near the CISD Level, representing the zone where institutional buying is concentrated.
Additionally, it identifies a Fair Value Gap, which acts as a high-probability area for price retracement and trade entry. Traders can confidently take long positions when the price revisits these zones, targeting the next significant liquidity pool or resistance level.
Bullish Setup in CAPITALCOM:US100 :
🟣 Bearish Setup
Conversely, in a bearish setup, the price manipulates liquidity by creating a false breakout above the high of the session. This move entices retail traders into long positions, allowing institutional players to enter sell orders.
Once the price reverses direction and breaches the CISD Level to the downside, a change of character (CHOCH) becomes evident, confirming a bearish market structure. The indicator highlights an Order Block near this level, indicating the origin of the institutional sell orders, along with an associated FVG, which represents an imbalance zone likely to be revisited before the price continues downward.
By entering short positions when the price retraces to these levels, traders align their strategies with the anticipated continuation of bearish momentum, targeting nearby liquidity voids or support zones.
Bearish Setup in OANDA:XAUUSD :
🔵 Settings
Refine Order Block : Enables finer adjustments to Order Block levels for more accurate price responses.
Mitigation Level OB : Allows users to set specific reaction points within an Order Block, including: Proximal: Closest level to the current price. 50% OB: Midpoint of the Order Block. Distal: Farthest level from the current price.
FVG Filter : The Judas Swing indicator includes a filter for Fair Value Gap (FVG), allowing different filtering based on FVG width: FVG Filter Type: Can be set to "Very Aggressive," "Aggressive," "Defensive," or "Very Defensive." Higher defensiveness narrows the FVG width, focusing on narrower gaps.
Mitigation Level FVG : Like the Order Block, you can set price reaction levels for FVG with options such as Proximal, 50% OB, and Distal.
CISD : The Bar Back Check option enables traders to specify the number of past candles checked for identifying the CISD Level, enhancing CISD Level accuracy on the chart.
🔵 Conclusion
The Silver Bullet Indicator is a cutting-edge tool designed specifically for forex traders who aim to leverage market dynamics during critical liquidity windows. By focusing on the highly active 9:00-10:00 and 10:00-11:00 timeframes, the indicator simplifies complex market concepts such as liquidity traps, Order Blocks, Fair Value Gaps (FVG), and CISD Levels, transforming them into actionable insights.
What sets the Silver Bullet Indicator apart is its precision in detecting false breakouts and market structure shifts (MSS), enabling traders to align their strategies with institutional activity. The visual clarity of its signals, including color-coded zones and directional arrows, ensures that both novice and experienced traders can easily interpret and apply its findings in real-time.
By integrating ICT principles, the indicator empowers traders to identify high-probability entry and exit points, minimize risk, and optimize trade execution. Whether you are capturing short-term price movements or navigating complex market conditions, the Silver Bullet Indicator offers a robust framework to enhance your trading performance.
Ultimately, this tool is more than just an indicator; it is a strategic ally for traders who seek to decode the movements of smart money and capitalize on institutional strategies. With the Silver Bullet Indicator, traders can approach the market with greater confidence, precision, and profitability.

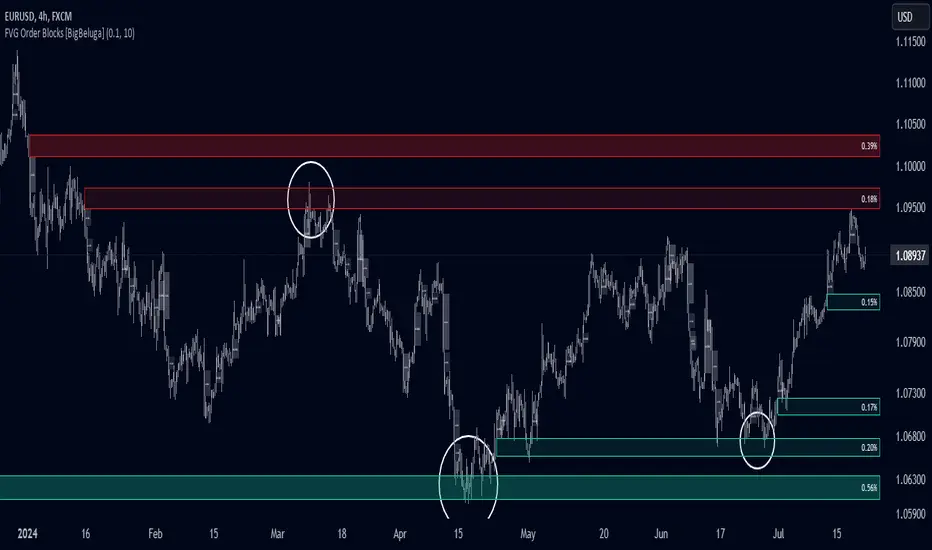
FVG Order Blocks [BigBeluga]This indicator is an advanced tool designed to detect and visualize market FVGs with order blocks, where the price action has created gaps due to strong buying or selling pressure. These FVG often act as critical support and resistance levels, giving traders strategic points for potential entries and exits. The indicator not only identifies these imbalances but also displays their relative strength by size %, helping traders prioritize order blocks that are more likely to hold or break.
The indicator works on various pairs and stocks, it also works on charts that do not provide volume data
Forex (JPY/USD):
Stocks (NVDA):
🔵 KEY FEATURES & USAGE
● FVGs Detection and Visualization:
The indicator detects bullish and bearish FVGs. Bullish FVG occur when there is significant buying, and order block is plotted below the FVG zone:
Conversely, bearish FVG are plotted with an order block above the zone, indicating potential resistance.
Traders can use these order blocks to anticipate price reactions when the market revisits these areas, making them ideal for setting up trades.
● FVG Filtering:
The indicator includes a FVG % filter that allows traders to only display strong order blocks. This ensures that only significant FVG order blocks are shown, reducing noise and focusing on the most impactful areas.
● Highlighting Broken Levels:
When an imbalance level is broken—either breached by price action or no longer relevant—the indicator can either delete the level or mark it with a gray color areas. This provides a clear visual cue that the level has been compromised, allowing traders to adjust their strategies accordingly.
● Order Blocks Signals:
When price retest the blocks, indicator display potential sell or buy signals. Which can be an opportunity for trades
🔵 CUSTOMIZATION
● FVG Filter:
Adjust the strength filter to control which FVGs are displayed based on their percentage size. This filter helps in focusing only on significant blocks that are likely to impact price action.
● Order Blocks Amount Displayed:
Set the maximum number of Order Blocks to be displayed on the chart. This customization helps keep the chart clean and ensures that only the most important blocks are in view.
● Broken Order Blocks Display:
Choose whether to display order blocks that have been broken by the price. This feature helps in maintaining a focus on blocks that are still valid while filtering out those that are no longer relevant.
● Color Customization:
You can customize the colors for bullish and bearish Order Blocks to match your chart's overall color scheme. Additionally, strength bars can be color-coded based on their percentage to quickly identify high-priority order blocks.
Traders who are confident in the settings of the indicator can confidently use it on various types of markets
Premium & Discount Delta Volume [BigBeluga]Premium & Discount Delta Volume is an advanced volume-based tool that helps traders identify zones of market imbalances by using the concepts of premium and discount pricing, commonly taught by ICT trader. It calculates and highlights periods where the market is trading at a premium (selling pressure is stronger) or a discount (buying pressure is stronger) and dynamically plots these zones over time. The indicator also calculates delta volume between buying and selling within these zones, showing shifts in market sentiment and potential areas for reversals or continuations.
🔵 IDEA
The Premium & Discount Delta Volume indicator is rooted in the ICT (Inner Circle Trader) concept of premium and discount zones. This concept divides the price action into two key zones:
Premium Zone : This area is where the market is trading at a level where sellers dominate, leading to more selling pressure. The idea is that the price is overvalued, and a potential drop could occur as the market reverts to a balanced state.
Discount Zone : This area is where the market is undervalued, with buyers dominating and applying upward pressure. Prices in this area often indicate opportunities to buy into strength as the market moves back to equilibrium.
At the core of the indicator is the delta volume, which measures the difference between buying and selling pressure within the premium and discount zones. When the delta volume is negative, it signals a downtrend with more selling pressure, while a positive delta volume signals an uptrend with more buying pressure. These zones and their associated delta values update dynamically, providing traders with real-time insights into market strength and potential price reversals.
The equilibrium in the middle of the premium and discount zones represents the balance point between buyers and sellers. When price moves away from equilibrium, it either enters the premium zone (potentially overbought) or the discount zone (potentially oversold), helping traders make more informed decisions based on volume and price structure.
🔵 KEY FEATURES & USAGE
Premium & Discount Zones:
The indicator automatically identifies and plots premium and discount zones on the chart. Premium zones count only negative (selling) volume, while discount zones count only positive (buying) volume. These zones are key areas of interest for identifying potential price reversals or continuations based on volume pressure.
Dynamic Delta Volume Calculation:
The indicator calculates delta volume between the premium and discount zones, showing the imbalance between buyers and sellers. A positive delta volume inside the discount zone suggests strong buying pressure, while a negative delta inside the premium zone suggests strong selling pressure. This helps traders quickly identify trends or market exhaustion.
Up Trend:
Down Trend:
Real-time Updates & Equilibrium Line:
The zones update dynamically every 100 bars or after price crosses them, ensuring that traders always have the most relevant market data. The equilibrium line in the middle of the zones helps traders gauge whether the market is balanced or moving into overbought (premium) or oversold (discount) territory.
Macro and Local Period Calculations:
The indicator allows traders to customize two different periods for analysis: a smaller lookback period (e.g., 50 bars) for short-term price action and a macro period (e.g., 200 bars) for larger trends. Each period has its own premium and discount zones, allowing for a multi-timeframe view of market strength.
Macro:
Both:
Color-coded background for Volume Pressure:
The background color of the smaller period premium and discount box changes based on delta volume. A positive delta turns the background blue, indicating higher buy pressure, while a negative delta turns the background red, signaling higher sell pressure.
🔵 CUSTOMIZATION
Toggle Premium & Discount: Traders can choose to display support and resistance levels based on the high and low points of the premium and discount zones.
Premium & Discount Lookback Period: Traders can adjust the lookback period to define the length of price action to be analyzed for premium and discount zones. A shorter period focuses on more recent market activity, while a longer period provides a broader view of trends.
Macro Highs/Lows Period: The indicator also offers a macro lookback period for identifying larger market trends and key levels of buying or selling volume.
Toggle Macro Levels: Macro levels help identify long-term price extremes, and traders can toggle this feature on or off as needed.

Precise Gap FinderPrecise Gap Finder
This indicator identifies Fair Value Gaps (FVGs) in price action and it is perfect for traders looking to exploit price imbalances and capitalize on trading opportunities.
How It Works:
The Precise Gap Finder detects Fair Value Gaps by analyzing three consecutive candles. A gap is identified when the middle candle’s price range (open to close) is not overlapped by the high and low prices of the surrounding candles. This indicates a price imbalance, which can be a strong signal for potential market moves.
How to Use for Trading:
Identify Entry Points: Use the highlighted Fair Value Gaps to spot potential entry points. An upward FVG can indicate a potential buying opportunity, while a downward FVG can signal a potential selling opportunity.
Confirm Trends: Combine the FVG signals with other technical indicators to confirm trends and enhance the accuracy of your trades.
Risk Management: Use FVGs to identify potential stop-loss and take-profit levels. Gaps can serve as natural support and resistance levels.
Backtesting: Analyze historical data to understand how FVGs have impacted price movements in the past, helping you refine your trading strategy

Volume Footprint Voids [BigBeluga]Volume Footprint Voids is a unique tool that uses lower timeframe calculation to plot different styles of single candle POC.
This indicator is very powerful for scalping and finding very precise entry and exits, spotting potential trapped traders, and more.
Unlike many other volume profiles, this aims to plot single candle profiles as well as their own footprints.
🔶 FEATURES
The script includes the following settings:
Windows: Plotting style and calculations
Coloring modes
Display modes
lower-timeframe calculations
🔶 CALCULATION
In the image above we can see how the script calculates each level position that will serve as a calculation process to see how much volume/closes there are within the levels.
In the image above, we can have a more clear example of how we count each candle close.
We use the prior screenshot as an example, after setting each level we will use the lower-timeframe input to measure the amount of closes within the ranges.
Depending on the lot size, the box will be larger or smaller, usually the POC will always have the highest box size.
NOTE: Size is the starting point, always from the low of the candle.
To find more voids, select a closer LTF to the current one you're using.
To find fewer voids, select a timeframe away from your current one.
Due to Pine Script limitations, we are only able to plot a certain amount of footprints, and we can't plot the whole history chart.
POC will be the largest block displayed, indicating the time point of control
Gray areas are closes above the average
Black are Void or imbalance that price will fill in the future, like FVG
The image above shows an incorrect size input that will lead to bad calculations, while on the other side, a correct size input that will lead to a clear vision and better calculation.
🔶 WINDOWS
The "▲▼" Mode will display delta buyers and delta sellers coloring with voids as black.
It also offers a gradient mode for a beautier visualization
The "Total Volume" mode will display the net volume within the lot size (closes within the levels).
This is useful to spot possible highest net volume within the same highest lot size.
The "POC + Gaps" will show both POC and Gaps as the highest block while all the rest will be considered as the smaller block.
This is useful to see where the highest lot were and if there are higher or lower imbalances within the candle
The last option "Gaps" will simply display the gaps as the highest block, while the POC as the lowest block.
This is useful to have a better view of the gaps areas
🔶 EXAMPLE
This is one of the most basic examples of how this script can be used. POC at the bottom creating a strong support area as price holds and creates higher voids gap that price fills while rising.
🔶 SETTINGS
Users have full control over the script, from colors to choosing the lower-timeframe inputs to disabling the lot size.

itradesize /\ Model x RTH Gap
I’m happy to announce my model and sharing it with you as an indicator.
About the model
The model is based on a range from 18:00 until 1:30. If you are keen you probably know that it's something that based on a bit of Daye's Theory. As Daily Q4 is from 18:00 until 0:00 and I've added a 90's Q1 to it as well that's why it ended up at 1:30.
It's an accumulation range and where we are looking for some opportunities above or below it when the algo is trying to fake the traders as the high and the low of the range are both important zones for liquidity pools. This model works on almost every pair but I've been mostly focusing on indices, especially on ES, NQ, and EUR/USD.
Do not trade before 1:30 AM and do not trade this model after 6:00 AM. So any tradable setup must be valid until 6:00 AM.
*All the mentioned times are based on America/NewYork timezone.
A simple sell setup
∆ If it takes the high of the model, then look for short opportunities.
∆ The best reliable scenario is when a high is taken while retracing back to an HTF PD Array so it will end up in a failure swing, Judas swing, you name it.
∆ When a high is taken you should wait for a market structure shift then it should give a nice displacement where it should retrace.
∆ The imbalance after the shift can be on every timeframe, based on your trade idea.
∆ If there are more imbalances, your decision on which to go with (as if there is a BPR, Breaker, OB, etc.. - can change the view of an FVG).
The same story goes for a buy setup.
∆ The first target is always the EQ of the model's range.
∆ The second target could be liquidity inside the EQ and the other side of the model (optional).
∆ The third target is the other side of the model.
∆ You can always leave a runner there if you eyeing some levels outside the model.
Additional information
∆ You can use silver bullet range as an extra confirmation when you looking for the actual displacement.
∆ An RTH range is also added to the indicator (starts drawing at 9:30 when the futures market opens) as it can be used to trade in the NY session and it is a must-have thing when trading indices.
∆ The colors of every label are switched automatically based on your chart's coloring.

Open Interest Profile [Fixed Range] - By LeviathanThis script generates an aggregated Open Interest profile for any user-selected range and provides several other features and tools, such as OI Delta Profile, Positive Delta Levels, OI Heatmap, Range Levels, OIWAP, POC and much more.
The indicator will help you find levels of interest based on where other market participants are opening and closing their positions. This provides a deeper insight into market activity and serves as a foundation for various different trading strategies (trapped traders, supply and demand, support and resistance, liquidity gaps, imbalances,liquidation levels, etc). Additionally, this indicator can be used in conjunction with other tools such as Volume Profile.
Open Interest (OI) is a key metric in derivatives markets that refers to the total number of unsettled or open contracts. A contract is a mutual agreement between two parties to buy or sell an underlying asset at a predetermined price. Each contract consists of a long side and a short side, with one party consenting to buy (long) and the other agreeing to sell (short). The party holding the long position will profit from an increase in the asset's price, while the one holding the short position will profit from the price decline. Every long position opened requires a corresponding short position by another market participant, and vice versa. Although there might be an imbalance in the number of accounts or traders holding long and short contracts, the net value of positions held on each side remains balanced at a 1:1 ratio. For instance, an Open Interest of 100 BTC implies that there are currently 100 BTC worth of longs and 100 BTC worth of shorts open in the market. There might be more traders on one side holding smaller positions, and fewer on the other side with larger positions, but the net value of positions on both sides is equivalent - 100 BTC in longs and 100 BTC in shorts (1:1). Consider a scenario where a trader decides to open a long position for 1 BTC at a price of $30k. For this long order to be executed, a counterparty must take the opposite side of the contract by placing a short order for 1 BTC at the same price of $30k. When both long and short orders are matched and executed, the Open Interest increases by 1 BTC, indicating the introduction of this new contract to the market.
The meaning of fluctuations in Open Interest:
- OI Increase - signifies new positions entering the market (both longs and shorts).
- OI Decrease - indicates positions exiting the market (both longs and shorts).
- OI Flat - represents no change in open positions due to low activity or a large number of contract transfers (contracts changing hands instead of being closed).
Typically, we monitor Open Interest in the form of its running value, either on a chart or through OI Delta histograms that depict the net change in OI for each price bar. This indicator enhances Open Interest analysis by illustrating the distribution of changes in OI on the price axis rather than the time axis (akin to Volume Profiles). While Volume Profile displays the volume that occurred at a given price level, the Open Interest Profile offers insight into where traders were opening and closing their positions.
How to use the indicator?
1. Add the script to your chart
2. A prompt will appear, asking you to select the “Start Time” (start of the range) and the “End Time” (end of the range) by clicking anywhere on your chart.
3. Within a few seconds, a profile will be generated. If you wish to alter the selected range, you can drag the "Start Time" and "End Time" markers accordingly.
4. Enjoy the script and feel free to explore all the settings.
To learn more about each input in indicator settings, please read the provided tooltips. These can be accessed by hovering over or clicking on the ( i ) symbol next to the input.

Vector Candle Zones/Cloud MTF X4Description:
This indicator employs Price, Volume, Support, Resistance Analysis (PVSRA), a trading strategy that analyzes price movements, volume, support, and resistance levels to identify potential trading opportunities. It detects large, volatile moves with significant activity in specific zones on the chart, which the market tends to revisit due to the high transaction volume in these areas. The primary purpose of this indicator is to draw these high probability areas where the market is likely to return.
The PVSRA algorithm used in this indicator:
Detects climactic situations: The algorithm identifies climactic situations by looking at bars where the volume is at least 200% of the average volume of the previous 10 bars. Additionally, it checks if the product of the candle spread, and candle volume is greater than or equal to the highest value for the previous 10 bars. In these situations, if the bar is bullish (closing price is higher than the opening price), it is colored green; if it's bearish (closing price is lower than the opening price), it is colored red.
Detects above-average volume situations: The algorithm looks for bars with a volume that is at least 150% of the average volume of the previous 10 bars. In these cases, if the bar is bullish, it is colored blue; if it's bearish, it is colored violet.
If the bar does not fall into climactic and above-average situations: The bar is colored with shades of gray depending on whether it's bullish or bearish, and is not considered a vector (aka. vector zone of interest).
The algorithm calculations can adapt to show the above information also from higher time-frames.
Using the indicator:
Utilize this indicator to trade towards and away from vector areas, and watch for reversals when these zones are recovered. While there are no certainties in trading, only probabilities, the vector candles on the chart represent high probability areas the market often revisits. Additionally, zones recovered between 50% - 100% signal high probability points where the market might change direction. The likelihood of market direction change increases as more vectors are recovered in succession. Although there is no set rule for when these vectors are recovered, monitoring candle colors (green, blue, red, purple) can help gauge the speed of a move to and from a zone. To use this indicator more effectively, establish a trend using other preferred indicators or even a simple EMA. Spend time studying how these zones are recovered for each specific asset.
Main Features:
High volume candles are detected and marked with colors, indicating high probability areas the market may revisit.
The indicator shows the percentage of a zone's recovery with labels for clear visibility.
If ghosting is enabled, fully recovered past candles (also called vectors) are highlighted to signal potential reversal points.
Imbalance Weighted Average (IWA) can be activated to display the point of attraction (mid/high/low) on high interest zones.
Fair Value Gaps can be displayed alongside PVSRA candles, as both represent imbalances in the chart.
The indicator supports showing 3x-4x higher timeframe PVSRA zones on a lower timeframe for convenience.

RedK EVEREX - Effort Versus Results ExplorerRedK EVEREX is an experimental indicator that explores "Volume Price Analysis" basic concepts and Wyckoff law "Effort versus Result" - by inspecting the relative volume (effort) and the associated (relative) price action (result) for each bar - showing the analysis as an easy to read "stacked bands" visual. From that analysis, we calculate a "Relative Rate of Flow" - an easy to use +100/-100 oscilator that can be used to trigger a signal when a bullish or bearish mode is detected for a certain user-selected length of bars.
Basic Concepts of VPA
-------------------------------
(The topics of VPA & Wyckoff Effort vs Results law are too comprehensive to cover here - So here's just a very basic summary - please review these topics in detail in various sources available here in TradingView or on the web)
* Volume Price Analysis (VPA) is the examination of the number of shares or contracts of a security that have been traded in a given period, and the associated price movement. By analyzing trends in volume in conjunction with price movements, traders can determine the significance of changes in price and what may unfold in the near future.
* Oftentimes, high volumes of trading can infer a lot about investors’ outlook on a market or security. A significant price increase along with a significant volume increase, for example, could be a credible sign of a continued bullish trend or a bullish reversal. Adversely, a significant price decrease with a significant volume increase can point to a continued bearish trend or a bearish trend reversal.
* Incorporating volume into a trading decision can help an investor to have a more balanced view of all the broad market factors that could be influencing a security’s price, which helps an investor to make a more informed decision.
* Wyckoff's law "Effort versus results" dictates that large effort is expected to be accompanied with big results - which means that we should expect to see a big price move (result) associated with a large relative volume (effort) for a certain trading period (bar).
* The way traders use this concept in chart analysis is to mainly look for imbalances or invalidation. for example, when we observe a large relative volume that is associated with very limited price change - that should trigger an early flag/warning sign that the current price trend is facing challenges and may be an early sign of "reversal" - this applies in both bearish and bullish conditions. on the other hand, when price starts to trend in a certain direction and that's associated with increasing volume, that can act as kind of validation, or a confirmation that the market supports that move.
How does EVEREX work
---------------------------------
* EVEREX inspects each bar and calculates a relative value for volume (effort) and "strength of price movement" (result) compared to a specified lookback period. The results are then visualized as stacked bands - the lower band represents the relative volume, the upper band represents the relative price strength - with clear color coding for easier analysis.
* The scale of the band is initially set to 100 (each band can occupy up to 50) - and that can be changed in the settings to 200 or 400 - mainly to allow a "zoom in" on the bands.
* Reading the resulting stacked bands makes it easier to see "balanced" volume/price action (where both bands are either equally strong, or equally weak), or when there's imbalance between volume and price (for example, a compression bar will show with high volume band and very small/tiny price action band) - another favorite pattern in VPA is the "Ease of Move", which will show as a relatively small volume band associated with a large "price action band" (either bullish or bearish) .. and so on.
* a bit of a techie piece: why the use of a custom "Normalize()" function to calculate "relative" values in EVEREX?
When we evaluate a certain value against an average (for example, volume) we need a mechanism to deal with "super high" values that largely exceed that average - I also needed a mechanism that mimics how a trader looks at a volume bar and decides that this volume value is super low, low, average, above average, high or super high -- the issue with using a stoch() function, which is the usual technique for comparing a data point against a lookback average, is that this function will produce a "zero" for low values, and cause a large distortion of the next few "ratios" when super large values occur in the data series - i researched multiple techniques here and decided to use the custom Normalize() function - and what i found is, as long as we're applying the same formula consistently to the data series, since it's all relative to itself, we can confidently use the result. Please feel free to play around with this part further if you like - the code is commented for those who would like to research this further.
* Overall, the hope is to make the bar-by-bar analysis easier and faster for traders who apply VPA concepts in their trading
What is RROF?
--------------------------
* Once we have the values of relative volume and relative price strength, it's easy from there to combine these values into a moving index that can be used to track overall strength and detect reversals in market direction - if you think about it this a very similar concept to a volume-weighted RSI. I call that index the "Relative Rate of Flow" - or RROF (cause we're not using the direct volume and price values in the calculation, but rather relative values that we calculated with the proprietary "Normalize" function in the script.
* You can show RROF as a single or double-period - and you can customize it in terms of smoothing, and signal line - and also utilize the basic alerts to get notified when a change in strength from one side to the other (bullish vs bearish) is detected
* In the chart above, you can see how the RROF was able to detect change in market condition from Bearsh to Bullish - then from Bullish to Bearish for TSLA with good accuracy.
Other Usage Options in EVEREX
------------------------------------
* I wrote EVEREX with a lot of flexibility and utilization in mind, while focusing on a clean and easy to use visual - EVEREX should work with any time frame and any instrument - in instruments with no volume data, only price data will be used.
* You can completely hide the "EVEREX bands" and use EVEREX as a single or dual period strength indicator (by exposing the Bias/Sentiment plot which is hidden by default) -
here's how this setup would look like - in this mode, you will basically be using EVEREX the same way you're using a volume-weighted RSI
* or you can hide the bias/sentiment, and expose the Bulls & Bears plots (using the indicator's "Style" tab), and trade it like a Bull/Bear Pressure Index like this
* you can choose Moving Average type for most plot elements in EVEREX, including how to deal with the Lookback averaging
* you can set EVEREX to a different time frame than the chart
* did i mention basic alerts in this v1.0 ?? There's room to add more VPA-specific alerts in future version (for example, when Ease-of-Move or Compression bars are detected...etc) - let me know if the comments what you want to see
Final Thoughts
--------------------
* EVEREX can be used for bar-by-bar VPA analysis - There are so much literature out there about VPA and it's highly recommended that traders read more about what VPA is and how it works - as it adds an interesting (and critical) dimension to technical analysis and will improve decision making
* RROF is a "strength indicator" - it does not track price values (levels) or momentum - as you will see when you use it, the price can be moving up, while the RROF signal line starts moving down, reflecting decreasing strength (or otherwise, increasing bear strength) - So if you incorporate EVEREX in your trading you will need to use it alongside other momentum and price value indicators (like MACD, MA's, Trend Channels, Support & Resistance Lines, Fib / Donchian..etc) - to use for trade confirmation

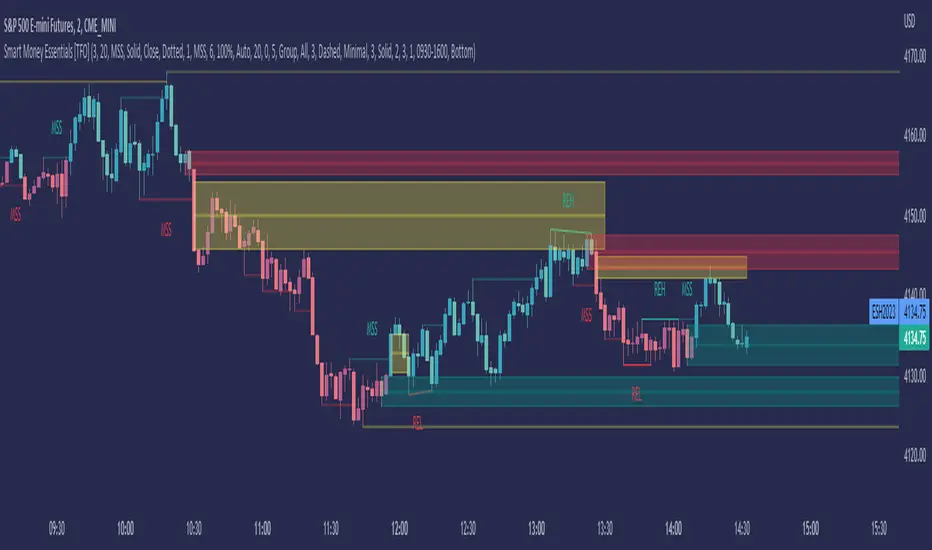
Smart Money Essentials [TFO]This indicator utilizes “Smart Money Concepts” like liquidity, order blocks, premium & discount, and more to analyze price action.
What’s included in the initial release:
Market Structure
Liquidity
Displacement
Order Blocks
Premium / Discount
Confluence Table
Alerts
Market structure logic objectively identifies whether the current trend is bullish or bearish, based on swing highs and lows. Liquidity levels offer insight into major pivots where we can assume many traders may place their stop loss, which can also serve as areas where “Smart Money” may be accumulating or distributing positions.
Displacement adds to this by spotting rapid price movement, often accompanied by imbalances where price may come back to before continuing in the direction of the displacement. These can be filtered based on whether the imbalance is accompanied by a Break of Structure (BOS) or Market Structure Shift (MSS), which may give additional insight into the draw on liquidity.
Order blocks (OB’s) are detected and treated as areas that may offer support for price in an uptrend or resistance in a downtrend. Premium and discount zones are essentially fitted by an “auto-fib” retracement that looks at recent liquidity levels, and optionally offers areas to look for an Optimal Trade Entry (OTE) where price retraces between 62-79% of the preceding displacement leg.
The confluence table provides an organized place to visualize and identify where any of the above concepts may be present at or around the same time. We can implement a threshold where, if the number of selected factors meets or exceeds this threshold, we can potentially identify bullish and bearish opportunities where multiple layers of confluence are overlapping.
And of course, alerts are built in for all significant events related to the above concepts, for example: runs on liquidity, BOS and MSS, rejections from OB and OTE, etc.
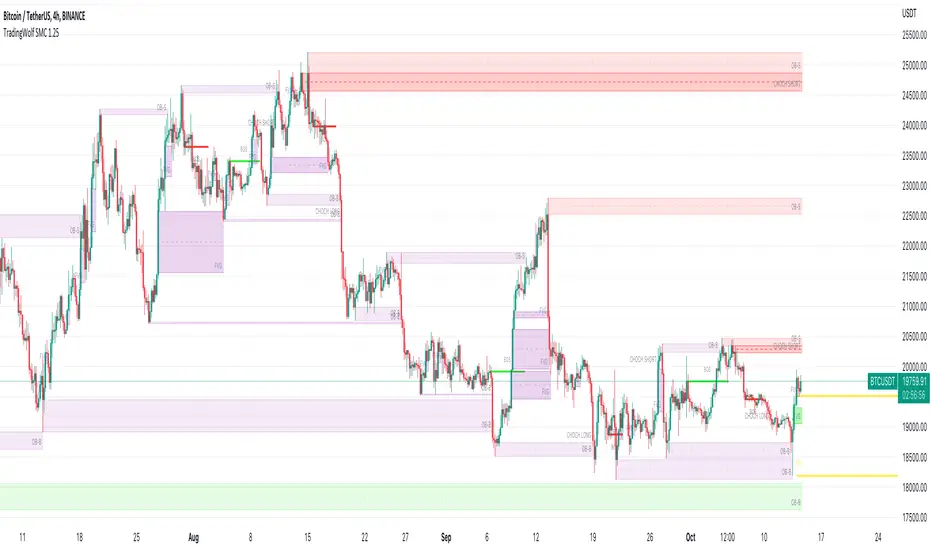
TradingWolf Smart Money
The TradingWolf Premium Smart Money Concept is a unique and enhanced selection of ideas designed to help give you an edge on the markets.
Within this one indicator you will have access to Fair Value Gap, Order Blocks, Break of Structure, Forecasting, Supply & Demand.
Below find each explanations on how to use each indicator
This script comes with the 'TradingWolf Premium' to get access, read the Author’s Instructions below.
There are extensive explanations on how to use this in our documentation on the website but we will give a simple overview here.
Order Blocks
There are several different ways people like to calculate order blocks, one of the ways we like is by using pivot points to identify levels of importance, from there we either highlight the highest/lowest closed candle or the wick. The user has the option to choose this in the settings.
As seen in the image above, you can see these levels are well respected and give people an opportunity to help where the market marker is placing their orders.
Fair Value Gaps
Fair value gaps can be a very useful concept in price action trading. They detect instances in which there are inefficiencies, or imbalances, in the market. In this case, we define imbalance as an instance in which buying and selling is not equal. This is often visualised as a large candle whose neighbouring candles’ wicks do not fully overlap the large candle. Below are a few examples of Fair Value Gap.
If price is in a downtrend and there is a fair value gap above, a trader might look to go short when that FVG fills. Inversely, if price is in an uptrend and there is a FVG below, a trader might look to go long when the FVG fills.
In this script we decided to highlight both types, one is simply marking up all technical FVGs which is the gap produced by the large candle, the other more commonly traded ones are market structure breaking ones.
These ones tend to be more respected so note they are highlighted in a separate colour to make them more visible.
If a FVG has been filled that box will dim away so it's not in your way.
ChoCh
‘Change of Character’ Hugely used by professional traders although they may not have heard of it called by this term. This is where price/market structure is trending in a certain direction but price starts to reverse.
This first happens when there is a break of structure, instead of another Lower High formed, price makes a Higher High like in the image above. This is where we highlight a break of structure or some people will just refer to this as the Choch line, once we have this we can look for an Order block / supply zone below to find an entry.
This is a hugely powerful tool dating back to one of the simplest and first concepts of trading where Market structure is King.
Peaks & Troughs
This tool helps you find potential reversal points in your support/resistance area, Simple candlestick patterns but incredibly powerful when used in confluence with our other tools.
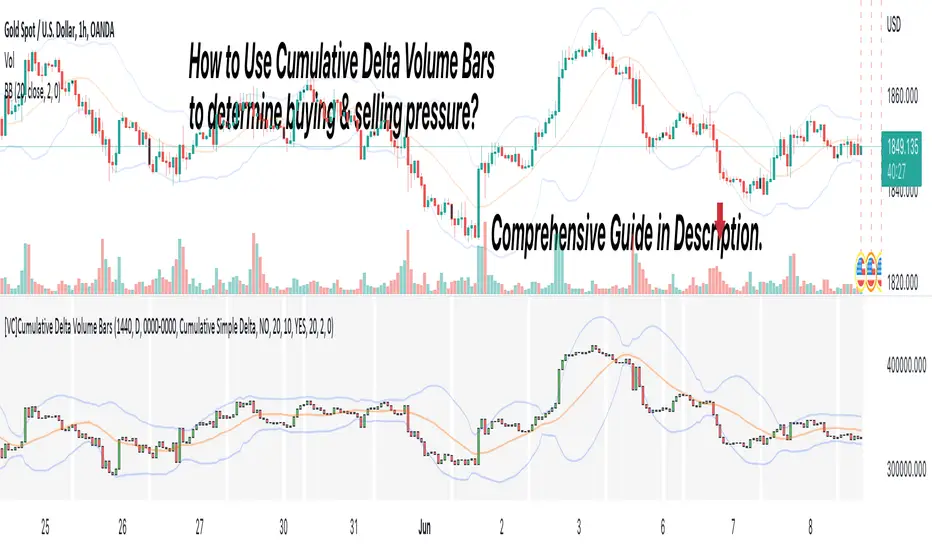
[VC] Cumulative Delta Volume BarsLet's first learn what is Delta & How to Use Cumulative Delta Volume Bars?
Cumulative Delta Volume Bars is one of the leading indicators that you can use when trading order flow. It gives you an instant snapshot of the buying and selling pressure in a market.
After reading the detailed description of "Cumulative Delta Volume Bars," you will understand how volume delta provides a critical edge by allowing you to spot significant potential reversals in the market. You will also learn to use this Cumulative Delta indicator in depth. (including rest session usability features)
What is Delta Volume?
Delta Volume is the difference between Buying and Selling Power. Delta Volume is calculated by taking the difference between the volume traded at the offer price and the volume traded at the bid price. (in simple words, the difference between buying pressure & selling pressure)
If delta volume is more than zero, you have more buying pressure than selling & vice versa, and if delta volume is less than zero, you have more selling pressure than buying.
In Order-Flow Analysis , traders used Cumulative Delta to measure the relationship between the Buying & Selling pressure Vs Price.
Cumulative delta volume takes the delta values for every bar and successively adds them together to provide a graph, as seen below visually.
Let me demonstrate by giving examples of how cumulative Delta can help measure the buying or selling pressure relative to the price move.
★ Trading Absorption & Exhaustion concepts with Delta
See the chart below & try to analyze the next possible move on the basses on the analysis mentioned on the chart.
➽➽ If you said Short, you were correct. ✅
Till Point A , both price & cumulative were aligned. (means there were no imbalances between Delta & Price).
But on Point B , the Cumulative Delta broke the previous resistance clearly and moved even further away from the resistance level, but the Price couldn't break the last resistance. It interprets that buyers applied a lot of buying pressure but no result. (Aggressive buying pressure absorbed by Passive sellers)
Due to this vast effort or failed attempt, buyers were exhausted and had no more strength to pull the Price up. That's why the Price reversed from Point B . See below image
★ Cumulative Delta Volume Bars is helpful when determining buying or selling pressure at different key price levels, such as swing highs or lows.
Let's recap on swing highs and swing lows.
➽ A swing high (S.H) is formed when the high reaches higher than the price action around it. Once the Price moves above a prior swing high and begins to retrace, a new swing high is formed.
➽ A swing low (S.L) is formed when the low reaches lower than price action around it. Once the Price moves below a prior swing low and begins to retrace, a new swing low is formed.
➽ When the Price makes higher highs and higher lows, a market is considered an uptrend.
➽ When the Price is making lower lows followed by lower highs, a market is considered a downtrend.
When evaluating Delta, it's beneficial to compare delta values at swing lows or swing highs to determine the amount of selling or buying pressure and how the market reacts.
The actual Power of Delta is revealed when we use it to determine the market's reaction to powerful buying or selling. We want to see if the market has reacted as we would expect or not.
In the above Example, you will notice that every time price breaks a swing, Delta does as well.
It makes sense as it takes selling pressure to break a swing low or buying pressure to break a swing high. In simple words, we can say that there is no anomaly between delta direction & price direction.
In simple words (No Absorption or Exhaustion)
But what's occurring when this isn't the case, and we have divergence between Price and Delta? Let's analyze it with real examples.
★ Understanding Delta Divergence.
(Lack of Harmony in Buying/Selling Pressure & Price Move)
Notice how the Price breaks out of the previous resistance level on the above chart, but the Delta didn't yet reach even close to its last resistance level. It's a clear divergence between Price and Delta. Buyers may be slightly exhausted at the previous resistance level, and Price & Delta may retrace slightly. But in a broader view, it reflects a strong bullish signal.
See the above chart & see when and why the Price moved. I hope it will help you understand the underlying relation & story between Price & Delta.
Cumulative Delta & Trade Management
Delta will help you spot significant reversals, but it can also be used to help manage your open trade. You want to see a high correlation between Delta and Price when in a long or short position.
Suppose you're short while the Price is breaking a new low. You want to see Delta breaking low if sellers aren't interested in selling at the recent lows, represented by Delta not breaking lows. The probability of a short term reversal or a significant retrace increases.
When in a position, always be on the lookout for exhaustion and absorption, signalling a reversal potential.
What Includes in V.C Cumulative Delta Volume Bars Indicator
Inputs & Settings
Reset accumulation on new session:
Allows you to rest accumulation at the start of each session (you may choose your customized starting & ending time as well by enabling ''Customize Rest Session Time''
Start/End of Session & During Session:
Allows you to show/hide & choose the background color & separator of each session
''Customize Rest Session Time''
When this setting is enabled, your customized given time will be applied, which can be set from the below box. Note: set your time in minutes. For Example, if you want to reset the session after every hour, you need to put 60. If you're going to reset after every 8 hours, you need to put 480. Additionally, your chart time frame must be lower than your customized rest time.
Reset Each Minutes:
Allows you to put your desired rest time in minutes. For Example, for 1 hour 60, for 8 hours 480. (8x60)
Reset Each:
Allows you to choose rest time from the drop-down menu. Note: To apply this setting, don't enable the ''CUSTOMIZE RESET SESSION TIME''.
Select Session:
Allows you to set customized starting & ending times of the session instead of the exchange's default time. For Example, the exchange reset time is 20:00, but if you want 22:00, first, you need to set your chart time as an exchange from the right bottom of the chart, and then you need to put 22:00 22:00 in both fields. Note: Put the same starting & ending time. In simple words, it should not be greater than or less than 24 hours.
Type:
It allows you to select Delta type. (there are two delta types you can choose from, 1st Simple Delta, 2nd Delta % or Volume Weighted Delta)
Candle Colors:
Allows you to change the color of candles.
Envelope Indicator:
Allows you to apply to Envelop Indicator on the delta candle. (all default settings of the Envelop Indicator can be customized as well)
See the below chart with Envelop applied to Delta Candles & Price Candles. (can be used to measure the Delta & Price movement at the micro-level)
Bollinger Bands Indicator:
Allows you to apply to Bollinger Bands Indicator on the delta candle. (all default settings of the Bollinger Bands Indicator can be customized as well)
See the below chart with Bollinger Bands applied to Delta Candles & Price Candles. (can be used to measure the Delta & Price movement at the micro-level)
Start/End of Session on Chart
Allows you to change the first & last candle of the session.
Style Settings:
Allows you to control all the visual settings of delta candles, Envelop & Bollinger bands.
-------------------------------------------------
➽Conclusion:
Cumulative Volume Delta Bars is one of the leading indicators you can include as an order flow trader in your arsenal. It gives you an inside look at buying and selling pressure and how the market reacts.
But Keep in mind, in trading & technical analysis, nothing is 100% certain. No indicator can give you a 100% success rate. There is no holy grail in the financial market. As a trader, with the help of technical & fundamental indicators, our goal is to find an edge over the market. A simple definition of an edge is: Anything that adds a few points to the winning side of an equation builds an edge that lasts a lifetime. A trading edge defines your technical or strategic advantage in the highly competitive market environment. Traders can establish multiple edges by starting with popular strategies and customizing rules to lower the risk of getting trapped with the emotional crowd.
Disclaimer Note:
V.C Cumulative Delta Volume Bars It is purely Volume, Delta, Demand & Supply imbalance and comparative analysis based tool. Before applying this Indicator to your study, you should know about Volume, Delta & Spread, Demand & Supply, and Aggressive & Passive behaviour of buyers/sellers.
Some basic understanding of Sir Richerd Wyckoff's Theory can also be helpful.
Koma-Indikator v2272,19
USD
+0,35
+0,13%
Apple, Inc. engages in the design, manufacture, and sale of smartphones, personal computers, tablets, wearables and accessories, and other varieties of related services. It operates through the following geographical segments: Americas, Europe, Greater China, Japan, and Rest of Asia Pacific. The Americas segment includes North and South America. The Europe segment consists of European countries, as well as India, the Middle East, and Africa. The Greater China segment comprises China, Hong Kong, and Taiwan. The Rest of Asia Pacific segment includes Australia and Asian countries. Its products and services include iPhone, Mac, iPad, AirPods, Apple TV, Apple Watch, Beats products, AppleCare, iCloud, digital content stores, streaming, and licensing services. The company was founded by Steven Paul Jobs, Ronald Gerald Wayne, and Stephen G. Wozniak in April 1976 and is headquartered in Cupertino, CA.
Es sind noch 14 Min. für die Script-Bearbeitung übrig
in dieser Minute
Koma-Indikator v2
Zu Favoriten hinzufügen
Auf Chart verwenden
0
0
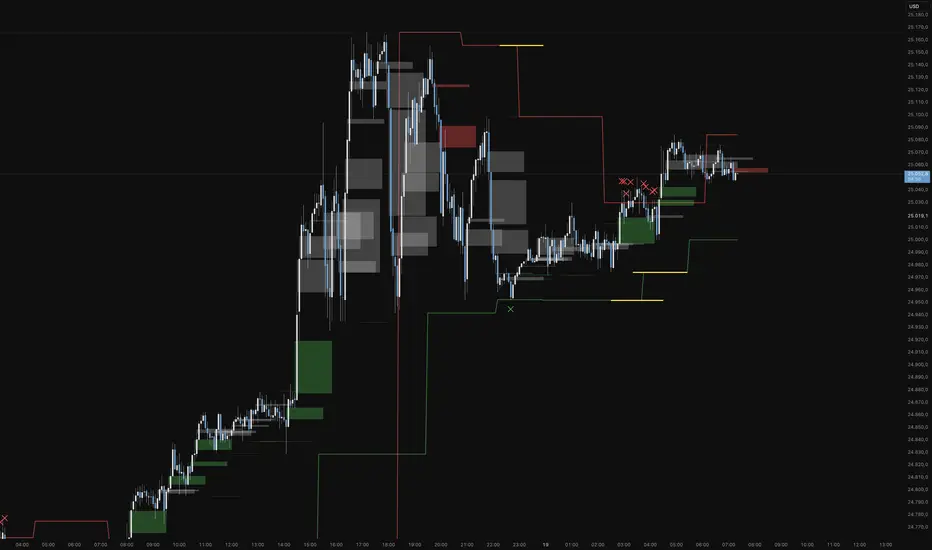
Functional Overview: Koma-Indikator V2
This indicator is a specialized analytical tool for Smart Money Concepts (SMC) trading. It is designed to automatically identify trend reversals, liquidity pools, and order flow shifts within the chart.
1. Liquidity Identification (BSL/SSL)
Major Range: The script automatically calculates significant highs and lows based on the "Major Lookback" period.
Buy-Side & Sell-Side Liquidity: These levels are plotted as red (BSL) and green (SSL) lines, serving as primary targets where the market often "hunts" for liquidity.
2. Sweep Detection (Liquidity Grabs)
The indicator detects when the price briefly exceeds a major high or low but closes back within the range.
Visuals: These potential reversal points are marked with an "X" icon above or below the candle (Sweep H/L).
3. Automated Market Structure Shifts (MSS)
The core logic tracks direction changes on two distinct levels:
Major MSS (Bold Yellow Line): Signals a significant trend reversal following a liquidity sweep. This is the primary confirmation for a new trend.
Minor MSS (Dotted Yellow Line): Highlights smaller structural breaks within a trend—ideal for aggressive "Sniper" entries on lower timeframes.
4. Dynamic Fair Value Gaps (FVG) & iFVGs
FVG Recognition: The indicator automatically draws boxes for bullish (green) and bearish (red) price imbalances.
Change in Delivery (iFVG): When a price candle closes through an existing FVG box, the box turns gray. This signals an Inverted FVG (iFVG), indicating that the order flow has officially shifted in the new direction.
5. Customization (Inputs)
Sensitivity: Users can adjust the lookback periods for both Trend (Major) and Entries (Minor) to suit different assets or timeframes.
Visual Hierarchy: All colors, line widths, and box lengths are configurable to maintain a clean and professional chart layout.
Trading Application:
By automating the "grunt work" of structural analysis, this tool allows you to focus on the trade execution:
Locate Liquidity: Identify BSL/SSL lines.
Watch for the Sweep: Look for the "X" marks.
Confirm the Shift: Wait for the yellow MSS lines.
Execute via Order Flow: Use the gray iFVG boxes as your Point of Interest (POI).
Geschütztes Skript
Dieses Script ist als Closed-Source veröffentlicht. Sie können es kostenlos und ohne Einschränkungen verwenden – erfahren Sie hier mehr.
Phantomas1
Haftungsausschluss
Die Informationen und Veröffentlichungen sind nicht als Finanz-, Anlage-, Handels- oder andere Arten von Ratschlägen oder Empfehlungen gedacht, die von TradingView bereitgestellt oder gebilligt werden, und stellen diese nicht dar. Lesen Sie mehr in den Nutzungsbedingungen.
Skript bearbeiten
Minimieren
Schließen
Koma-Indikator v2
Functional Overview: Koma-Indikator V2
This indicator is a specialized analytical tool for Smart Money Concepts (SMC) trading. It is designed to automatically identify trend reversals, liquidity pools, and order flow shifts within the chart.
1. Liquidity Identification (BSL/SSL)
Major Range: The script automatically calculates significant highs and lows based on the "Major Lookback" period.
Buy-Side & Sell-Side Liquidity: These levels are plotted as red (BSL) and green (SSL) lines, serving as primary targets where the market often "hunts" for liquidity.
2. Sweep Detection (Liquidity Grabs)
The indicator detects when the price briefly exceeds a major high or low but closes back within the range.
Visuals: These potential reversal points are marked with an "X" icon above or below the candle (Sweep H/L).
3. Automated Market Structure Shifts (MSS)
The core logic tracks direction changes on two distinct levels:
Major MSS (Bold Yellow Line): Signals a significant trend reversal following a liquidity sweep. This is the primary confirmation for a new trend.
Minor MSS (Dotted Yellow Line): Highlights smaller structural breaks within a trend—ideal for aggressive "Sniper" entries on lower timeframes.
4. Dynamic Fair Value Gaps (FVG) & iFVGs
FVG Recognition: The indicator automatically draws boxes for bullish (green) and bearish (red) price imbalances.
Change in Delivery (iFVG): When a price candle closes through an existing FVG box, the box turns gray. This signals an Inverted FVG (iFVG), indicating that the order flow has officially shifted in the new direction.
5. Customization (Inputs)
Sensitivity: Users can adjust the lookback periods for both Trend (Major) and Entries (Minor) to suit different assets or timeframes.
Visual Hierarchy: All colors, line widths, and box lengths are configurable to maintain a clean and professional chart layout.
Trading Application:
By automating the "grunt work" of structural analysis, this tool allows you to focus on the trade execution:
Locate Liquidity: Identify BSL/SSL lines.
Watch for the Sweep: Look for the "X" marks.
Confirm the Shift: Wait for the yellow MSS lines.
Execute via Order Flow: Use the gray iFVG boxes as your Point of Interest (POI).
Fortfahren
FVG Maxing - Fair Value Gaps, Equilibrium, and Candle Patterns
What this script does
This open-source indicator highlights 3-candle fair value gaps (FVGs) on the active chart timeframe, draws their midpoint ("equilibrium") line, tracks when each gap is mitigated, and optionally marks simple candle patterns (engulfing and doji) for confluence. It is intended as an educational tool to study how price interacts with imbalances.
3-candle bullish and bearish FVG zones drawn as forward-extending boxes.
Equilibrium line at 50% of each gap.
Different styling for mitigated vs unmitigated gaps.
Compact statistics panel showing how many gaps are currently active and filled.
Optional overlays for bullish/bearish engulfing patterns and doji candles.
1. FVG logic (3-candle gaps)
The script focuses on a strict 3-candle definition of a fair value gap:
Three consecutive candles with the same body direction.
The wick of candle 3 is separated from the wick of candle 1 (no overlap).
A bullish gap is created when price moves up fast enough to leave a gap between candle 1 and 3. A bearish gap is the mirror case to the downside.
In Pine, the core detection looks like this:
// Three candles with the same body direction
bull_seq = close > open and close > open and close > open
bear_seq = close < open and close < open and close < open
// Wick gap between candle 1 and candle 3
bull_gap = bull_seq and low > high
bear_gap = bear_seq and high < low
// Final FVG flags
is_bull_fvg = bull_gap
is_bear_fvg = bear_gap
For each detected FVG:
Bullish FVG range: from high up to low (gap below current price).
Bearish FVG range: from low down to high (gap above current price).
Each zone is stored in a custom FVGData structure so it can be updated when price later trades back inside it.
2. Equilibrium line (0.5 of the gap)
Every FVG box gets an optional equilibrium line plotted at the midpoint between its top and bottom:
eq_level = (top + bottom) / 2.0
right_index = extend_boxes ? bar_index + extend_length_bars : bar_index
bx = box.new(bar_index - 2, top, right_index, bottom)
eq_ln = line.new(bar_index - 2, eq_level, right_index, eq_level)
line.set_style(eq_ln, line.style_dashed)
line.set_color(eq_ln, eq_color)
You can use this line as a neutral “fair value” reference inside the zone, or as a simple way to think in terms of premium/discount within each gap.
3. Mitigation rules and styling
Each FVG stays active until price trades back into the gap:
Bullish FVG is considered mitigated when the low touches or moves below the top of the gap.
Bearish FVG is considered mitigated when the high touches or moves above the bottom of the gap.
When that happens, the script:
Marks the internal FVGData entry as mitigated.
Softens the box fill and border colors.
Optionally updates the label text from "BULL EQ / BEAR EQ" to "BULL FILLED / BEAR FILLED".
Can hide mitigated zones almost completely if you only want to see unfilled imbalances.
This allows you to distinguish between current areas of interest and zones that have already been traded through.
4. Candle pattern overlays (engulfing and doji)
For additional confluence, the script can mark simple candle patterns on top of the FVG view:
Bullish engulfing — current candle body fully wraps the previous bearish body and is larger in size.
Bearish engulfing — current candle body fully wraps the previous bullish body and is larger in size.
Doji — candles where the real body is small relative to the full range (high–low).
The detection is based on basic body and range geometry:
curr_body = math.abs(close - open)
prev_body = math.abs(close - open )
curr_range = high - low
body_ratio = curr_range > 0 ? curr_body / curr_range : 1.0
bull_engulfing = close > open and close < open and open <= close and close >= open and curr_body > prev_body
bear_engulfing = close < open and close > open and open >= close and close <= open and curr_body > prev_body
is_doji = curr_range > 0 and body_ratio <= doji_body_ratio
On the chart, they appear as:
Small triangle markers below bullish engulfing candles.
Small triangle markers above bearish engulfing candles.
Small circles above doji candles.
All three overlays are optional and can be turned on or off and recolored in the CANDLE PATTERNS group of inputs.
5. Inputs overview
The script organizes settings into clear groups:
DISPLAY SETTINGS : Show bullish/bearish FVGs, show/hide mitigated zones, box extension length, box border width, and maximum number of boxes.
EQUILIBRIUM : Toggle equilibrium lines, color, and line width.
LABELS : Enable labels, choose whether to label unmitigated and/or mitigated zones, and select label size.
BULLISH COLORS / BEARISH COLORS : Separate fill and border colors for bullish and bearish gaps.
MITIGATED STYLE : Opacity used when a gap is marked as mitigated.
STATISTICS : Toggle the on-chart FVG statistics panel.
CANDLE PATTERNS : Show engulfing patterns, show dojis, colors, and the body-to-range threshold that defines a doji.
6. Statistics panel
An optional table in the corner of the chart summarizes the current state of all tracked gaps:
Total number of FVGs still being tracked.
Number of bullish vs bearish FVGs.
Number of unfilled vs mitigated FVGs.
Simple fill rate: percentage of tracked FVGs that have been marked as mitigated.
This can help you study how a particular market tends to treat gaps over time.
7. How you might use it (examples)
These are usage ideas only, not recommendations:
Study how often your symbol mitigates gaps and where inside the zone price tends to react.
Use higher-timeframe context and then refine entries near the equilibrium line on your trading timeframe.
Combine FVG zones with basic candle patterns (engulfing/doji) as an extra visual anchor, if that fits your process.
Hope you enjoy, give your feedback in the comments!
- officialjackofalltrades

[Yorsh] BJN MTF FVG/iFVG v1.01. Executive Summary
The BJN MTF FVG/iFVG v1.0 is a highly specialized and performance-optimized tool for TradingView that provides a multi-layered view of market imbalances. Built on the modern PineScript v6, its sole purpose is to detect and display Fair Value Gaps (FVGs) from up to five user-defined higher timeframes directly onto a single chart.
In a market saturated with "all-in-one" tools that slow down trading platforms, this indicator's primary competitive advantage is its unrelenting focus on speed and clarity. It is engineered from the ground up to be a lightweight, efficient, and "noise-reducing" utility. It provides traders with essential higher-timeframe context without the lag, clutter, or performance degradation typical of other multi-timeframe (MTF) indicators.
2. Core Features Overview
The indicator is designed with a "do one thing well" philosophy, concentrating on the accurate and efficient plotting of multi-timeframe FVGs.
A. Multi-Timeframe (MTF) FVG Plotting
Up to Five Custom Timeframes: You can monitor FVGs from any five timeframes of your choice (e.g., 1m, 3m, 5m, 15m, 1H) simultaneously, all from your main trading chart. This eliminates the need to constantly switch between charts to understand the broader market structure.
Clear Labeling: Each FVG box is cleanly labeled with its corresponding timeframe (e.g., "5 ✔"), so you can instantly identify its origin and significance.
B. Intelligent FVG Validation & Sizing
Dynamic Sizing Rules: The indicator intelligently validates FVGs based on their size in points. It automatically applies a larger minimum size requirement during the volatile NY session and a smaller requirement for non-NY hours, effectively filtering out minor, insignificant gaps and focusing only on meaningful imbalances.
Validity Markers: FVGs that meet the minimum size criteria are marked with a checkmark ("✔") and extended slightly into the future, signifying them as potent support/resistance zones. Undersized FVGs are marked with an "✖" and treated as potential areas of weakness.
C. Unique "iFVG" Noise Reduction
This is a key feature for maintaining a clean chart. The indicator tracks undersized, "invalid" FVGs and waits to see how the market reacts to them.
Automatic Deletion or Recolor: When the price closes through an invalid FVG (creating an "iFVG" or inverted FVG), the user has two choices:
Delete Box (Default): The box is automatically removed from the chart. This is the "Noise Reduction" mode, designed to keep the workspace free of irrelevant, broken levels.
Recolor Box: The box is recolored to a faded gray. This option is ideal for traders who want to backtest and study how these broken, minor FVGs behave as future support or resistance.
D. Smart Visibility Options
Prevents Duplication: The indicator includes an intelligent option to automatically hide an MTF box if its timeframe matches your current chart's timeframe. This is designed to work seamlessly with a Current Timeframe (CTF) FVG indicator, preventing redundant, overlapping boxes.
3. The Performance Advantage: A Lag-Free MTF Experience
Multi-timeframe indicators are notoriously resource-intensive and are the primary cause of chart lag on TradingView. The BJN MTF FVG indicator was specifically engineered to solve this problem, making it far superior to its competitors.
Optimized timeframe.change() Trigger: Instead of recalculating its logic on every single price tick, the script only runs its intensive request.security calls when a candle closes on the specified higher timeframe. This reduces the number of calculations by over 99% compared to poorly coded MTF indicators, resulting in a dramatic performance increase.
Strict Historical Limits: The user can define a maximum history lookback (in hours or minutes) for each timeframe. For example, the 1-minute chart might only process the last 4 hours of data. This prevents the indicator from drawing thousands of historical boxes that are no longer relevant, which is the main cause of platform freezing and slow loading times.
Lightweight State Management: The script maintains a very small, active list of only the invalid FVGs it needs to monitor for inversion. Valid FVGs are simply "fire-and-forget" drawings, meaning they don't consume ongoing memory or processing power.
In short, this indicator delivers the critical higher-timeframe context traders need without ever compromising the speed and responsiveness of your trading platform.
4. Ideal User Profile
This indicator is the perfect tool for:
Day Traders and Scalpers: Who need to be aware of higher-timeframe support and resistance levels without leaving their execution chart.
SMC / ICT Traders: Who use multi-timeframe FVG confluence as a core part of their trading strategy.
Performance-Focused Traders: Anyone who has experienced chart lag from other indicators and desires a clean, fast, and reliable toolkit.
Traders Seeking Clarity: Individuals who prefer a decluttered workspace and want an indicator that intelligently removes irrelevant information.
5. Conclusion
The BJN MTF FVG/iFVG v1.0 excels through its simplicity, intelligence, and exceptional performance. It rejects the "kitchen-sink" approach of other tools and instead provides a refined, highly optimized solution to one of the most important tasks in modern trading: analyzing multi-timeframe market structure. It is a faster, cleaner, and more intelligent way to map higher-timeframe liquidity.
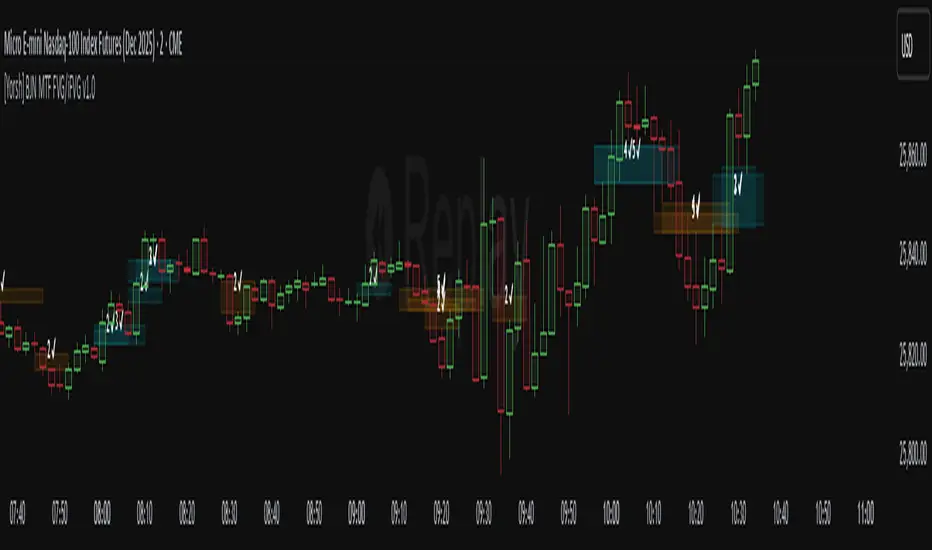
Dix$on's Weighted Volume Flow OverlayDixson's Weighted Volume Flow Overlay
OVERVIEW
Dixson's Weighted Volume Flow Overlay is an on-chart HUD that summarizes weighted buy vs sell volume flow, imbalance, Relative Volume (RVOL), and volume “temperature” (Z-Score) from a selectable higher timeframe. It’s designed to give you a fast read on whether buyers or sellers are actually driving the move—without adding a separate panel or clutter.
Optional V-Div labels highlight price vs imbalance EMA divergences (potential momentum shifts), and compact footer badges track pressure, session cumulative flow, and flow flips. Fully customizable placement, text size, bar resolution, and thresholds.
HOW IT WORKS
1) Weighted Buy / Sell Volume (HTF)
Buy/Sell volume is estimated by weighting volume based on where the candle closes inside its high/low range.
From this the overlay derives:
- Imbalance (normalized buy–sell difference)
- Net Flow (buy–sell difference)
2) Volume Temperature + RVOL
- Z-Score of volume (climax vs dry-up context)
- RVOL (current HTF volume relative to its average)
3) Session Cumulative Flow (SCF)
Tracks running net flow for the day (resets each day).
4) Pullback Quality (PB)
PB uses VWAP + RVOL + imbalance alignment:
- PB ✅ = cleaner pullback conditions
- PB ⚠️ = pullback detected but not fully qualified by the filter
5) Divergence Labels (V-Div)
- ▲ V-Div = Bullish divergence (price LL while imbalance EMA HL)
- ▼ V-Div = Bearish divergence (price HH while imbalance EMA LH)
NOTE: Pivot-based signals appear after confirmation (requires bars to the right).
INPUTS (QUICK GUIDE)
MASTER
- Enable overlay
SETTINGS
- Timeframe (HTF): aggregation timeframe (default 1D)
UI
- Corner (table placement)
- Show Header / Show Footer
- Show Imbalance Row
- Bar Resolution
- Text Size
NOTE: If changing Corner doesn’t reposition immediately, remove/re-add the indicator.
THRESHOLDS
- Z-Score lookback + Climax/Dry-Up thresholds
- Bull/Bear Imbalance thresholds
- RVOL High/Low thresholds
DIVERGENCE
- Enable V-Div
- Pivot Length
LEGEND (BADGES + FLAGS)
Footer badges:
- scf = Session Cumulative Flow
- p X/5 = Pressure score
- mo ↑ / ↓ / → = Imbalance momentum
Header badge:
- PB ✅ / PB ⚠️
Flags:
- 🔥 = Climax volume
- 🥶 = Dry-up volume
- 🟢 = Bullish imbalance threshold met
- 🔴 = Bearish imbalance threshold met
- 📈 = High RVOL threshold met
- 💤 = Low RVOL threshold met
- 🔀 = Flow flip (imbalance sign changed)
- ⚡ = Divergence triggered
- 🧱 = Absorption (green candle with negative imbalance on climax)
- 💨 = Exhaustion (red candle with positive imbalance on climax)
NOTES / DISCLAIMER
This script is for educational/informational purposes only and is not financial advice.
Buy/Sell volume is an estimate derived from candle structure, not true bid/ask order flow.
Use as confluence with your own levels, trend filters, and risk management.

CyberTradingV1.4 TRexCyberTradingV1.3 — Multi-TF Volatility/Structure + FVG Suite (by College Pips)
TL;DR
One utility to read volatility regime (ATR vs TH), map market structure & swings, and track FVG/CE imbalances—so you can gauge range, context and entries in one place. No signals or promises; it’s a contextual toolkit.
What it does
Volatility table (multi-TF): Shows ATR-style and TH proxies across 1m → Monthly, so you can compare current TF vs higher TFs.
Composite levels: LQC / GAM / Trigger / TRex quantify “how much is enough” for legs/impulses relative to the active TF.
Structure & swings: Validated swing highs/lows with optional time-anchored rectangles (height sized by LQC) and auto structure/diagonal lines.
Imbalances (FVG): Auto-detect UP/DOWN FVGs, extend forward, optional CE line; alerts fire on touches/entries/fills.
Candle sizing: Directional color map by fixed ATR-ratio buckets; Inside Bars are force-colored for clarity.
How components work together (mashup rationale)
Read regime with the table (ATR vs TH per TF).
Map structure with swings/lines to see HH/HL/LH/LL context.
Focus imbalances with FVG + optional CE; monitor with alerts.
Act with thresholds using LQC/GAM/Trigger/TRex to standardize expectations across symbols/TFs.
Method transparency
ATR/TH math: ATR is a smoothed multi-window blend; TH scales the daily range to TF via √time.
Composites: LQC ≈ √(ATR×TH) × C(TF); GAM2/3/4 and Trigger/TRex apply TF-specific scalars to min/max aggregates (see source for exact coefficients).
Multi-TF: Values come from request.security and finalize on higher-TF bar close (no look-ahead).
Swings: Confirmed using left/right strengths; labels are offset back to the pivot bar.
FVG/CE: Classic 3-bar definition; CE is the midpoint line. Boxes extend until touched/filled; optional auto-delete on fill.
Usage
Enable the table to gauge expansion/contraction.
Turn on swing rectangles for LQC-sized reaction zones.
Toggle FVG + CE on your execution TF; use alerts to catch re-entries/resolutions.
Combine with price action and your own trade plan.
Limitations & fair warnings (be honest)
Offsets/past plotting: Swing labels and rectangles are anchored to past bars (offset = -right_strength). They do not predict future bars.
Repainting notes: Swings confirm after right_strength bars; higher-TF values finalize on their close. Past markings can update as confirmations occur.
Tick handling: Uses syminfo.mintick (special cases for JPY/XAU/XAG). Validate on exotic symbols.
No promises: This is a context tool, not a buy/sell signal generator.
Alerts included
ABOVE/BELOW threshold: Price crossing CE or FVG bounds.
IOFED up/down: Price entering an FVG from above/below.
Inputs (high-level)
Layout/positioning, color palettes, swing rectangle styling (width/fill/border), detection strengths, label/line widths, FVG lookback, CE on/off & style, auto-delete filled boxes.
Credits & reuse
Concepts like FVG/CE are widely known in market-microstructure education.
This implementation—table architecture, LQC/GAM/Trigger framework, swing rectangles, candle bucketing, and alert logic—is original to College Pips / CyberTradingV1.4

ICT Confirmed FVG Indicator ICT FVG Indicator (Confirmed by Swings)
Summary
This indicator is designed to identify high-probability Fair Value Gaps (FVGs) by confirming them with market structure. It filters out random imbalances and only highlights the FVGs that are created at the same time as a confirmed ICT Swing High or Swing Low.
The core principle is to connect price imbalances directly to significant shifts in market structure, providing a cleaner and more powerful signal.
What It Does
Identifies Swing Points: Automatically detects and draws confirmed swing highs (resistance) and swing lows (support) on your chart based on the settings you choose.
Finds Fair Value Gaps: It scans the chart for the classic 3-candle FVG pattern (also known as a BISI or SIBI).
Confirms FVGs with Swings: This is the most important feature. The indicator will only draw an FVG box if one of the three candles that created the FVG is also a confirmed swing point. This ensures you are only seeing imbalances that are directly related to a break in market structure.
Invalidates Old FVGs: To keep the chart clean, the indicator will automatically remove an FVG box after the price has fully passed through it a certain number of times (customizable in the settings).
Settings Explained
ICT Swings Settings
Left/Right Strength: Controls the sensitivity of the swing detection. Higher numbers require a more significant, obvious swing point to be confirmed. Lower numbers will identify more minor swings.
Max Swing Lines: Sets the maximum number of swing high and swing low lines to display on the chart at one time.
Swing High/Low Color: Customize the color of the swing point lines.
FVG Settings
Show Bullish/Bearish FVG: Use these checkboxes to turn the bullish (green) or bearish (red) FVG boxes on or off.
Bullish/Bearish FVG Color: Customize the color of the FVG boxes.
FVG Invalidation Threshold: This sets how many times the price can fully close on the other side of an FVG before the box is automatically removed.
Max Active FVGs to Show: Sets the maximum number of FVG boxes to keep on the chart to prevent clutter.
Key Features
High-Probability Signals: Filters out noise by focusing only on FVGs that are confirmed by a shift in market structure.
Clean Visuals: Automatically draws and removes swing lines and FVG boxes to keep your chart uncluttered.
Fully Customizable: Adjust the sensitivity of the swing detection and the appearance of the FVGs to fit your trading style.
Pure ICT Concepts: Built strictly on the principles of Inner Circle Trader for a method-consistent analysis.

Fixed Range FootprintFixed Range Footprint allows you to analyze the Footprint over a specified time period. By enabling the "Extend Right" option, the Footprint transforms into a classic mode, extending from the starting point to the most recent bar in real-time.
Input Options:
Group: Coordinates
"Start range": Defines the starting coordinate for the Footprint period.
"End range": Defines the ending coordinate for the Footprint period.
Group: Row Size
"Ticks Per Row": Directly sets the price step, calculated by multiplying the input value by syminfo.mintick.
"Auto": Activates automatic mode for selecting the "Ticks Per Row" value.
"Max row": Relevant in auto mode; it limits the number of rows within a bar. The automatic calculation for "Ticks Per Row" is based on the first available bar and applied to subsequent bars.
Group: Imbalance
"Imbalance Percent": Sets a percentage-based coefficient to determine price level Imbalance by comparing the diagonal buy price to the previous sell price.
"Stacked levels": Defines the minimum number of consecutive Imbalance levels required to draw extended lines.
Group: Support
"Show Footprint Info": Toggles the display of Footprint information.
Group: Value Area
"Value Area": Sets the percentage for the Value Area.
"POC": Toggles the Point of Control (POC).
"VAH": Toggles the Value Area High (VAH).
"VAL": Toggles the Value Area Low (VAL).
"Show Volume Profile": Displays buy/sell volume at each level.
Group: Alerts
"Alert on New Imbalance": Enables alerts for the creation of new Imbalance levels.
"Alert on New Imbalance Line": Enables alerts for the creation of new Imbalance lines.
"Alert on Stop Past Imbalance Line": Enables alerts when price stops past an Imbalance line.
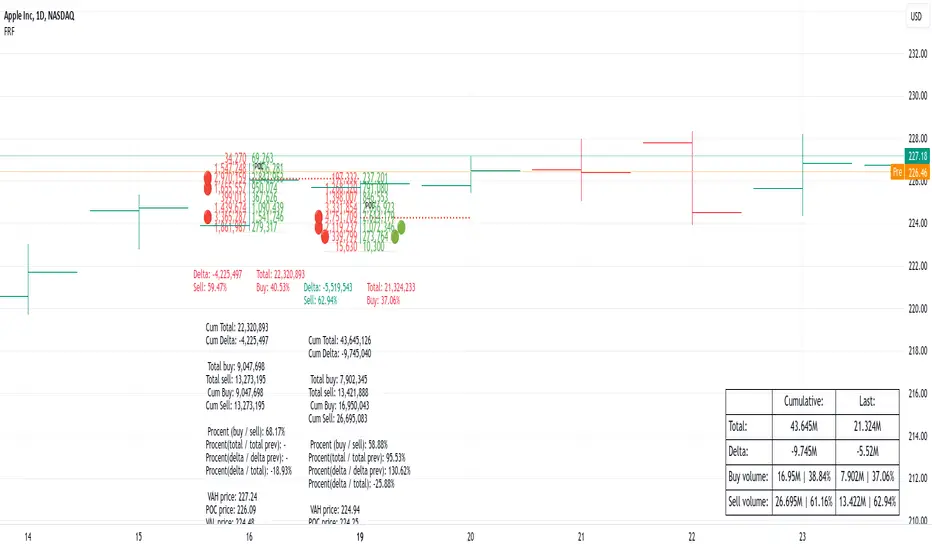
[F][IND] FVG IdentifierMastering Market Imbalances with Ease
The FVG Identifier stands as a groundbreaking TradingView indicator, crafted to illuminate the often-overlooked Fair Value Gaps (FVG) in the dynamic world of price action trading. Let’s dive into how this tool is transforming the approach to identifying market inefficiencies.
Decoding Fair Value Gaps
Central to the concept of FVGs is the identification of market imbalances — moments where the equilibrium between buying and selling pressures is disrupted. These gaps are typically seen in a sequence of three candles, where a dominant candle is surrounded by others whose wicks fail to fully overlap it. These formations are critical as they often influence future price directions, acting as potential magnets.
Simplifying the Detection of FVGs
The FVG Identifier is engineered to enhance the visibility of Fair Value Gaps, making them starkly apparent even in complex market charts. Its algorithms ensure that these vital market indicators are easily and promptly recognized, allowing traders to spot valuable trading opportunities with minimal effort.
Features of the FVG Identifier
1. Intuitive Interface: The indicator is designed for ease of use, accommodating both beginners and experienced traders.
2. Customizable Settings: It offers flexible configuration options, allowing for adaptation to various trading styles and strategies.
3. Strategic Trading Insight: By highlighting FVGs, the tool provides traders with actionable insights for strategic entry and exit points based on potential price movements.
Elevating Your Trading Strategy
Incorporating the FVG Identifier into your trading arsenal equips you with a nuanced perspective on market analysis. It not only assists in identifying significant market imbalances but also enriches your technical analysis with powerful, data-backed insights.
Revolutionizing Price Action Trading
The FVG Identifier transcends the role of a mere indicator; it represents a significant leap in trading methodology. Compatible with various trading platforms, this tool is ready to enhance your market understanding and application of Fair Value Gaps.
Embrace the FVG Identifier to uncover the hidden dynamics of market gaps and translate these insights into efficient and profitable trading strategies.
Disclaimer:
This indicator is provided for educational purposes only. Trading involves risk, and users should consult with a financial professional before making any trading decisions.
Your Feedback Matters!
Please feel free to comment or reach out if you have any improvement suggestions or if you would like to request the development of a specific indicator. Your feedback is invaluable!
