Search in scripts for "low"
HIGH LOW CLOSE Moving Average ExponentialThe Script is prepared for testing purpose the Added single indicator for getting high low and close.
HLM Trend Line (High-Low-Midpoint / Ichimoku Line)Ichimoku style trend line .
Some strategies call for a custom Ichimoku style line (midpoint of range's high/low).
This allows you to use or replace a single line without having to customize a full Ichimoku setup.

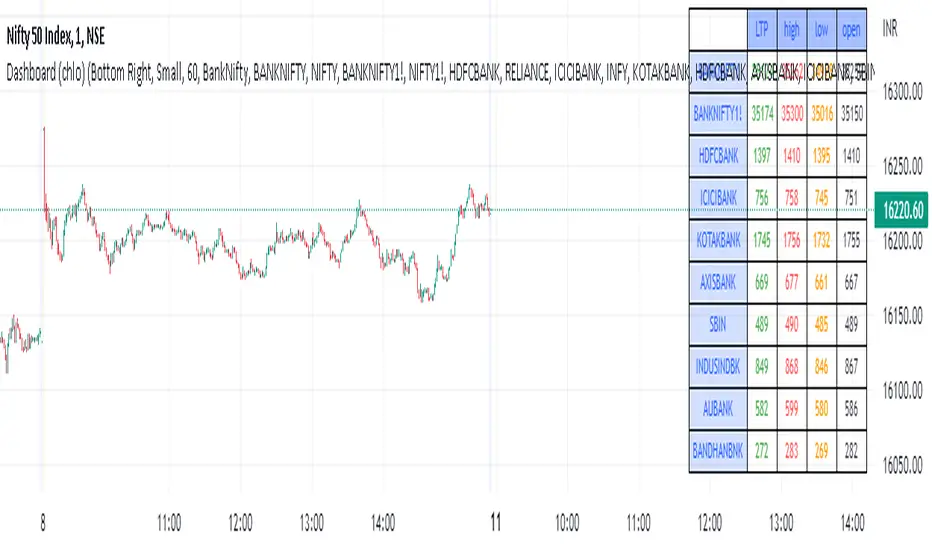
Dashboard (chlo) - v1I am an aircraft maintenance technician who is trying to get into software development in the financial sector.
This is a project in which a dashboard of other security(stocks) with open, close, high, and low will appear.
I could compile this after a detailed study of different dashboards and pine script for several hours
hope you like this.
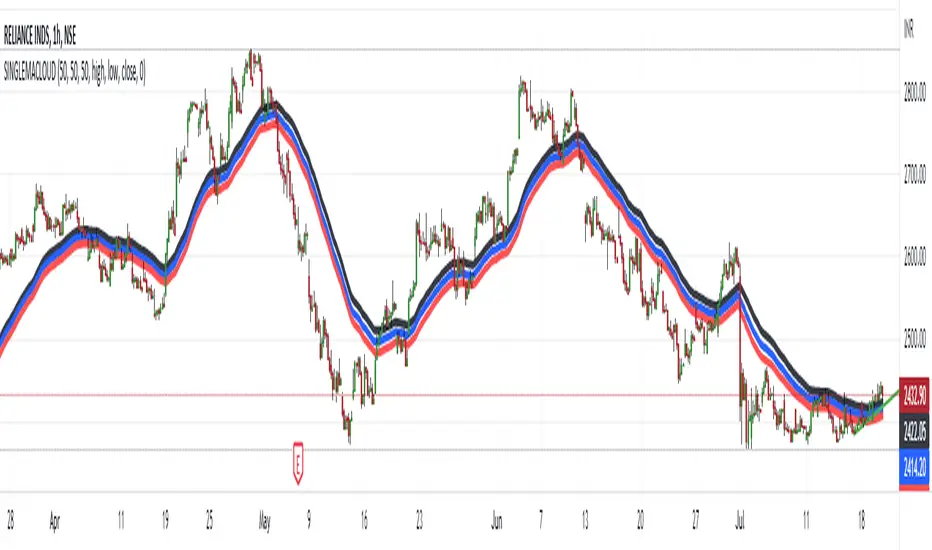
EMA 50 HIGH LOW BANDHi
This indicator displays a band of EMA 50 having high and low of the same ema.
This script works well on 5 min chart or lower time frames in intraday.
When any price is above this band, you may consider a buy position and whenever any price is below this band, you may consider a sell position.
You may also take help of EMA 200, which is shown in red color. Whenever price is above EMA200, it is considered bullish and when ever it is below EMA 200, it is considered bearish.
This will remove a lot of noise from your chart.
I hope it helps.
Thanks

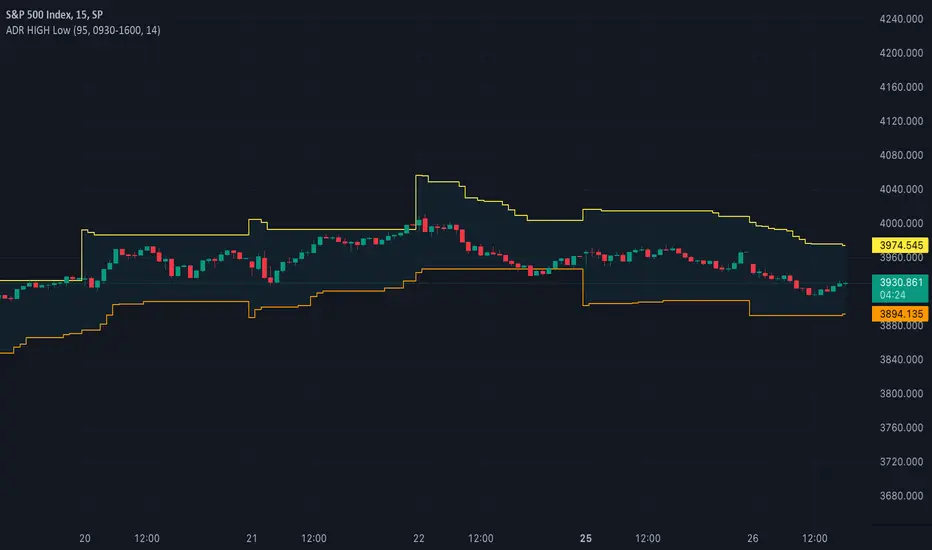
Time Anchored Intraday High/Low TrendlineOftentimes, intraday trendlines that are started at specific times, e.g. 8:00am or market open 9:30am, are well respected throughout the trading day.
This indicator draws up tp 3 intraday trendlines that are anchored at user defined times, respectively at the corresponding candle's high and low points.
From there, the line*s xy2 are connected in a way that all following candles are enclosed.
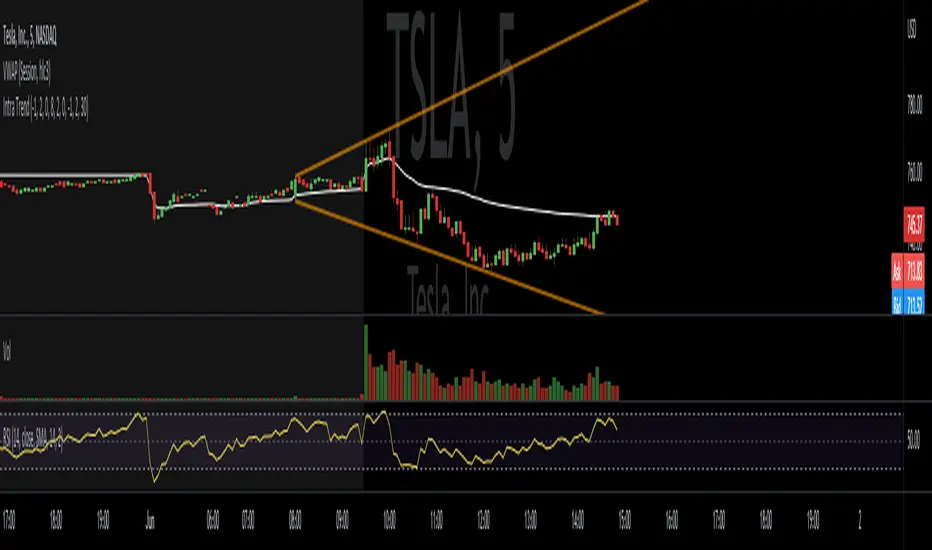
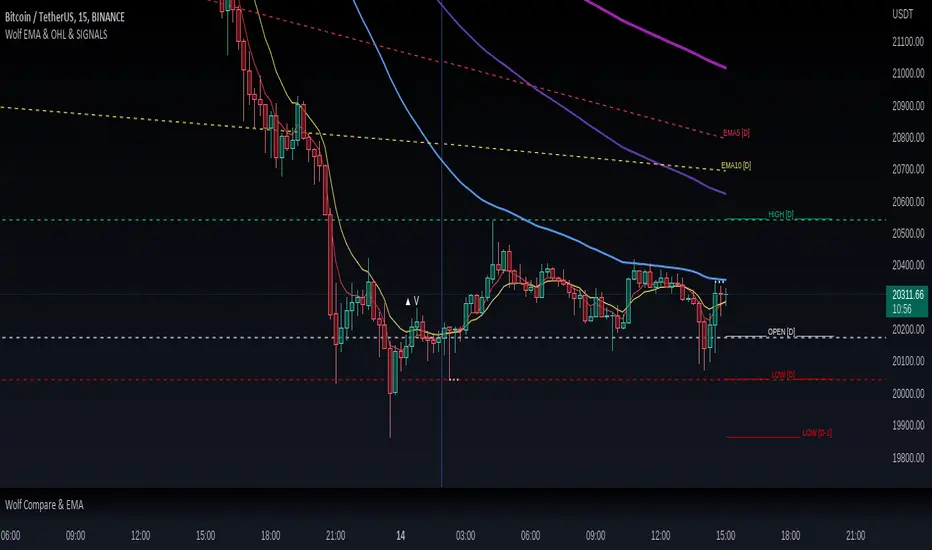
Wolf EMA & OHL & SIGNALSWolf EMA & OHL & SIGNALS
this indicator is mainly used for fast trading techniques (scalping). provides various tools for comprehensive trend analysis.
5 EMAs are used to have possible market entry or exit signals.
EMA
Thanks to the combination of the EMAs of different timeframes,
you can immediately get an idea of the resistances or supports
of the higher timeframes.
HOL
Lines are drawn on the right side indicating the maximum, minimum and opening
of the day, past day, week and past week respectively.
These levels are excellent as price acceleration points.
SIGNALS
There are three types of signals that are monitored by this indicator:
- Shimano
This signal is generated if the price remains compressed between two EMAs, more precisely between the third and the fifth, at the point where the price breaks one of these EMAs there can be a strong price movement.
- Viagra
This signal is generated if the price remains below the second EMA for a long time without ever closing above / below, at the point where it closes by climbing over the EMA there may be a change in trend.
-Bud
This signal is generated if a positive candle is formed and subsequently at least two that close within the high and low of the positive candle. Where the price breaks through the high of the positive candle is a great entry point.
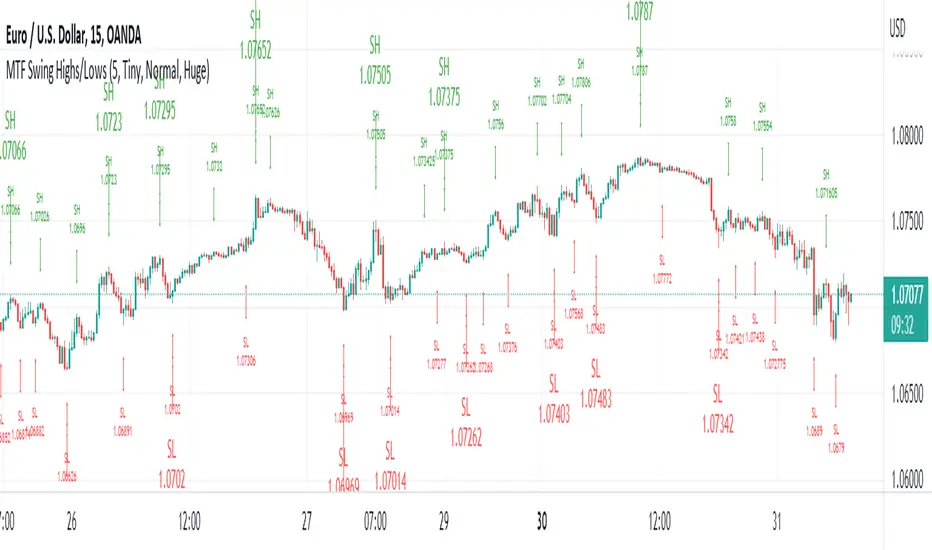
MTF Swing Highs/LowsI designed this indicator out of necessity for the Market structure/Price action trading strategy I use.
I thought I'd share. :)
This indicator displays Swing Highs and Lows an 3 timeframes based on the Chart timeframe, as follows:
Chart TF Higher TF Highest TF
1m 5m 15m
5m 15m 60m
15m 60m 240m
60m 240m Daily
You can change the font size of the labels as you'd prefer.
Lowest / Highest From WidgetRecent events inspired me to create a small widget that allows you to spot from when current value is lowest / highest.
Just add it to chart and script will compute most recent day when price was higher / lower than current and it will display:
Line coming from that value to the current one
A table with previous low/high information
Thanks to @MUQWISHI to help me coding it.
Disclaimer
Please remember that past performance may not be indicative of future results.
Due to various factors, including changing market conditions, the strategy may no longer perform as well as in historical backtesting.
This post and the script don’t provide any financial advice.

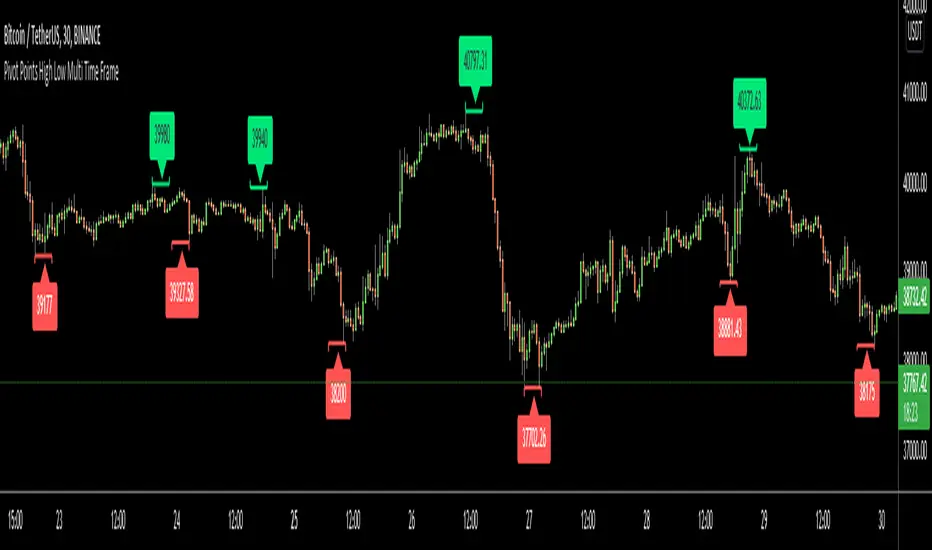
Pivot Points High Low Multi Time FrameHello All,
There are built-in and published Pivot Point High Low indicators in Public Library but as far as I see none of them is for Higher Time frames. so I decided to write & publish this script. I hope it would be useful while trading or developing your own scripts. I also did this to use in one of my future projects (we will see it in a few weeks/months ;) ).
I tried to make all settings optional, so you can play with them as you wish.
P.S. There is no control mechanism if the chart time frame is lower than the time frame in the options. So you better set higher time frame in the options than the chart time frame.
Enjoy!
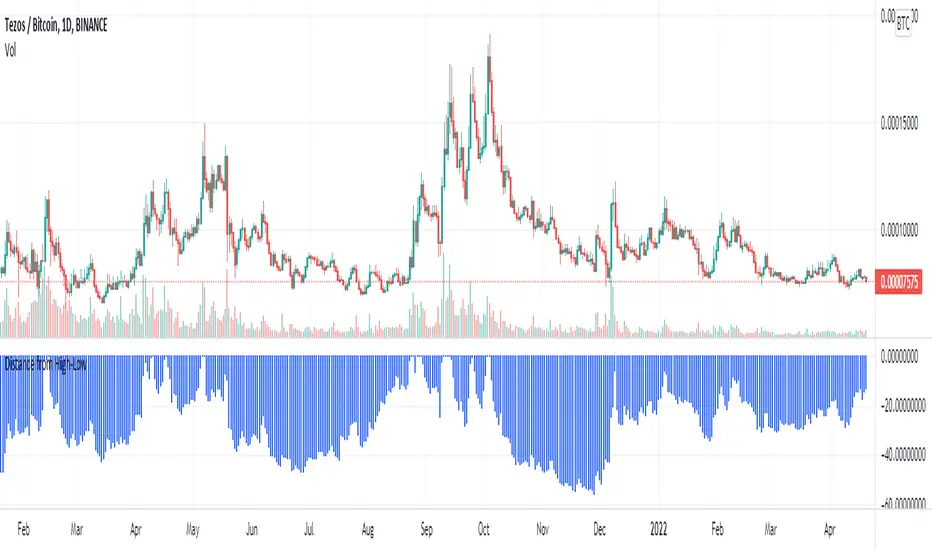
Distance/Drawdown from a period high/lowShow distance (%) from previous high/low in selected period.
daily high low close Levelsits different its day high and low indicator idgcaiucvai fUEFIFBIUE FWEFHEFBSD FSFHUFSIISDJHS DSDHSDINSDVJSD9 SDHSDVJNSDVSJDVH8S9DY SEFGSU BSIDVJBSDVIU S8DOHSDIVNSDV

Z Score (Close + High and Low bands)Basic z score with High and Low bands.
If z is positive = uptrend.
If z is negative = downtrend.
If z > +3 or z < -3 = reverse is possible.
H lines can act as a support/resistance.
Disclaimer:
Trading success is all about following your trading strategy and the indicators should fit within your trading strategy, and not to be traded upon solely
The script is for informational and educational purposes only. Use of the script does not constitute professional and/or financial advice. You alone have the sole responsibility of evaluating the script output and risks associated with the use of the script. In exchange for using the script, you agree not to hold dgtrd TradingView user liable for any possible claim for damages arising from any decision you make based on use of the script

Same high/low + DCA (only long)This is an update of the previous "same high/low" strategy. This strategy can be helpful for those who look for entrance price points after level retest based on the dollar cost averaging approach.
The retest of the level is defined by two candles with the same low.
4 entrance points were calculated based on volatility (not based on ATR though) and the weights were averaged in the middle of the volatility level.
As previously, stop loss is just one tick away from a level of support and take profit based on the ATR multiplier.

Open=High and Open=LowIndicates if the bar has Open=High or Open=Low
Colors and Description have been added as well

Percentage Levels by TimeframePlots the positive and negative percentage levels from a selection of timeframes and sources for any ticker. You can use this within a pullback trading system. For example, if you historically look at the average pullback of large cap stocks and ETF's, you can use this indicator to plot the levels it could pullback to for an entry to go long. It can be used as potential targets when trading a ticker short. Another use for this is to backtest the set percentage targets using TradingView's bar replay feature to see how ETF's and large cap stocks have reacted at these levels. Note: This is intended to be used at timeframes equal to higher than the chart's as it may cause re-painting issues.
Currently percentage levels are statically set to 1, 3, 5, 10, 15, 20, 25, and 30% levels above and below the chosen source (open, high, low, close). You can also display the data based on timeframes from Daily (1D) all the way up to Yearly (12M)
*Not financial advice but in my opinion the current percentage levels set (see above) are best used for ETF's and Large Cap Stocks.
Jan 2
Release Notes: Added the ability to select the historical bars to look back when plotting levels
Jan 2
Release Notes: To get a better display or proper resolution on your charts, change the view settings to "Scale Price Chart Only"
Jan 2
Release Notes: To add % labels for this indicator on the price axis, change your chart settings to include "Indicator Name Label" & "Indicator Last Value". You can find this under the Label section after hitting the gear icon in the bottom right of your chart.
Jan 2
Release Notes: Added: Custom Line Plot Extension Settings. Ideally both values should be equal to display optimal extended lines. To return to a base setting: '1' = Historical Lookback & '0' = Offset Lines. Also note this is dependent on the timeframe you are viewing on the chart.
Jan 2
Release Notes: Removed indicator from example chart that was not needed.
Jan 2
Release Notes: Updated some comments in the Pine Script
Jan 2
Release Notes: Update: Added commentary and instructions in the indicator settings to address recommended line plot settings for Stocks/ETF's vs Futures
Jan 2
Release Notes: Changed title from "Calculation Method" to "Calculation Source"
Jan 4 2021
Normal use of security() dictates that it only be used at timeframes equal to or higher than the chart's as it may cause re-painting

Cyclic RSI High Low With Noise Filter█ OVERVIEW
This indicator displays Cyclic Relative Strength Index based on Decoding the Hidden Market Rhythm, Part 1 written by Lars von Thienen.
To determine true or false for Overbought / Oversold are unnecessary, therefore these should be either strong or weak.
Noise for weak Overbought / Oversold can be filtered, especially for smaller timeframe.
█ FEATURES
Display calculated Cyclic Relative Strength Index.
Zigzag high low based on Cyclic Relative Strength Index.
Able to filter noise for high low.
█ LEGENDS
◍ Weak Overbought / Oversold
OB ▼ = Strong Overbought
OS ▲ = Strong Oversold
█ USAGE / TIPS
Recommend to be used for Harmonic Patterns such as XABCD and ABCD.
Condition 1 (XABCD) : When ▼ and ▲ exist side by side, usually this outline XA, while the next two ◍ can be BC.
Condition 2 (ABCD) : When ▼ and ▲ exist side by side, usually this outline AB, while the next one ◍ can be BC, strong ABCD.
Condition 3 (ABCD) : When ▼ or ▲ exist at Point A, the next two ◍ can be Point B and Point C, medium ABCD.
Condition 4 (ABCD) : When ◍ exist at Point a, the next two ◍ can be Point b and Point c, weak ABCD usually used as lower case as abcd.
█ CREDITS
LoneSomeTheBlue
WhenToTrade

High - Low Difference (Forex)This script is created to read and label the difference between High and Low of a candle in points term & in percentage term.
This is basically made for Forex Trading.
Do explore the settings of the scrip.

Pivots High-Low Screener & AlertsHi fellow traders ,
Pleased to share a Pivot High - Low Screener.
The script uses the TV inbuilt Pivot function.
It Screens 25 tickers default set, these can be modified in the input dialog box.
All you need to do is attach to any chart and set the periodicity or the resolution of the chart to your desired alert() frequency requirement.
Now go to the input settings icon of the script and set your Pivot right and left parameters!
Set the alert from the menu as usual click - Any alert() function call and bingo you are done!!
Similarily change the chart periodicity to the next timeframe and set the next alert.
No more opening multiple charts and setting individual time consuming alerts().
You will get concatenated alerts or summary alerts for your tickers.
Track 25tickers with a single alert for each timeframe(Supports 40 tickers).
Happy trading with TV..

Monthly/Weekly/Daily/High and LowsSimple script that marks the prior month/week/day highs and lows for finding key levels.
High - Low DifferenceThis script is created to read and label the difference between High and Low of a candle in percentage term.

Gann High Low Activator AlertsA Gann High Low Activator within a fixed range meant for alerts. A value of 1 means we're in an uptrend, a value of -1 a downtrend, and a value of 0 is neutral.
Thank you and happy trading
