MomentumIndicatorsLibrary "MomentumIndicators"
This is a library of 'Momentum Indicators', also denominated as oscillators.
The purpose of this library is to organize momentum indicators in just one place, making it easy to access.
In addition, it aims to allow customized versions, not being restricted to just the price value.
An example of this use case is the popular Stochastic RSI.
# Indicators:
1. Relative Strength Index (RSI):
Measures the relative strength of recent price gains to recent price losses of an asset.
2. Rate of Change (ROC):
Measures the percentage change in price of an asset over a specified time period.
3. Stochastic Oscillator (Stoch):
Compares the current price of an asset to its price range over a specified time period.
4. True Strength Index (TSI):
Measures the price change, calculating the ratio of the price change (positive or negative) in relation to the
absolute price change.
The values of both are smoothed twice to reduce noise, and the final result is normalized
in a range between 100 and -100.
5. Stochastic Momentum Index (SMI):
Combination of the True Strength Index with a signal line to help identify turning points in the market.
6. Williams Percent Range (Williams %R):
Compares the current price of an asset to its highest high and lowest low over a specified time period.
7. Commodity Channel Index (CCI):
Measures the relationship between an asset's current price and its moving average.
8. Ultimate Oscillator (UO):
Combines three different time periods to help identify possible reversal points.
9. Moving Average Convergence/Divergence (MACD):
Shows the difference between short-term and long-term exponential moving averages.
10. Fisher Transform (FT):
Normalize prices into a Gaussian normal distribution.
11. Inverse Fisher Transform (IFT):
Transform the values of the Fisher Transform into a smaller and more easily interpretable scale is through the
application of an inverse transformation to the hyperbolic tangent function.
This transformation takes the values of the FT, which range from -infinity to +infinity, to a scale limited
between -1 and +1, allowing them to be more easily visualized and compared.
12. Premier Stochastic Oscillator (PSO):
Normalizes the standard stochastic oscillator by applying a five-period double exponential smoothing average of
the %K value, resulting in a symmetric scale of 1 to -1
# Indicators of indicators:
## Stochastic:
1. Stochastic of RSI (Relative Strengh Index)
2. Stochastic of ROC (Rate of Change)
3. Stochastic of UO (Ultimate Oscillator)
4. Stochastic of TSI (True Strengh Index)
5. Stochastic of Williams R%
6. Stochastic of CCI (Commodity Channel Index).
7. Stochastic of MACD (Moving Average Convergence/Divergence)
8. Stochastic of FT (Fisher Transform)
9. Stochastic of Volume
10. Stochastic of MFI (Money Flow Index)
11. Stochastic of On OBV (Balance Volume)
12. Stochastic of PVI (Positive Volume Index)
13. Stochastic of NVI (Negative Volume Index)
14. Stochastic of PVT (Price-Volume Trend)
15. Stochastic of VO (Volume Oscillator)
16. Stochastic of VROC (Volume Rate of Change)
## Inverse Fisher Transform:
1.Inverse Fisher Transform on RSI (Relative Strengh Index)
2.Inverse Fisher Transform on ROC (Rate of Change)
3.Inverse Fisher Transform on UO (Ultimate Oscillator)
4.Inverse Fisher Transform on Stochastic
5.Inverse Fisher Transform on TSI (True Strength Index)
6.Inverse Fisher Transform on CCI (Commodity Channel Index)
7.Inverse Fisher Transform on Fisher Transform (FT)
8.Inverse Fisher Transform on MACD (Moving Average Convergence/Divergence)
9.Inverse Fisher Transfor on Williams R% (Williams Percent Range)
10.Inverse Fisher Transfor on CMF (Chaikin Money Flow)
11.Inverse Fisher Transform on VO (Volume Oscillator)
12.Inverse Fisher Transform on VROC (Volume Rate of Change)
## Stochastic Momentum Index:
1.Stochastic Momentum Index of RSI (Relative Strength Index)
2.Stochastic Momentum Index of ROC (Rate of Change)
3.Stochastic Momentum Index of VROC (Volume Rate of Change)
4.Stochastic Momentum Index of Williams R% (Williams Percent Range)
5.Stochastic Momentum Index of FT (Fisher Transform)
6.Stochastic Momentum Index of CCI (Commodity Channel Index)
7.Stochastic Momentum Index of UO (Ultimate Oscillator)
8.Stochastic Momentum Index of MACD (Moving Average Convergence/Divergence)
9.Stochastic Momentum Index of Volume
10.Stochastic Momentum Index of MFI (Money Flow Index)
11.Stochastic Momentum Index of CMF (Chaikin Money Flow)
12.Stochastic Momentum Index of On Balance Volume (OBV)
13.Stochastic Momentum Index of Price-Volume Trend (PVT)
14.Stochastic Momentum Index of Volume Oscillator (VO)
15.Stochastic Momentum Index of Positive Volume Index (PVI)
16.Stochastic Momentum Index of Negative Volume Index (NVI)
## Relative Strength Index:
1. RSI for Volume
2. RSI for Moving Average
rsi(source, length)
RSI (Relative Strengh Index). Measures the relative strength of recent price gains to recent price losses of an asset.
Parameters:
source : (float) Source of series (close, high, low, etc.)
length : (int) Period of loopback
Returns: (float) Series of RSI
roc(source, length)
ROC (Rate of Change). Measures the percentage change in price of an asset over a specified time period.
Parameters:
source : (float) Source of series (close, high, low, etc.)
length : (int) Period of loopback
Returns: (float) Series of ROC
stoch(kLength, kSmoothing, dSmoothing, maTypeK, maTypeD, almaOffsetKD, almaSigmaKD, lsmaOffSetKD)
Stochastic Oscillator. Compares the current price of an asset to its price range over a specified time period.
Parameters:
kLength
kSmoothing : (int) Period for smoothig stochastic
dSmoothing : (int) Period for signal (moving average of stochastic)
maTypeK : (int) Type of Moving Average for Stochastic Oscillator
maTypeD : (int) Type of Moving Average for Stochastic Oscillator Signal
almaOffsetKD : (float) Offset for Arnaud Legoux Moving Average for Oscillator and Signal
almaSigmaKD : (float) Sigma for Arnaud Legoux Moving Average for Oscillator and Signal
lsmaOffSetKD : (int) Offset for Least Squares Moving Average for Oscillator and Signal
Returns: A tuple of Stochastic Oscillator and Moving Average of Stochastic Oscillator
stoch(source, kLength, kSmoothing, dSmoothing, maTypeK, maTypeD, almaOffsetKD, almaSigmaKD, lsmaOffSetKD)
Stochastic Oscillator. Customized source. Compares the current price of an asset to its price range over a specified time period.
Parameters:
source : (float) Source of series (close, high, low, etc.)
kLength : (int) Period of loopback to calculate the stochastic
kSmoothing : (int) Period for smoothig stochastic
dSmoothing : (int) Period for signal (moving average of stochastic)
maTypeK : (int) Type of Moving Average for Stochastic Oscillator
maTypeD : (int) Type of Moving Average for Stochastic Oscillator Signal
almaOffsetKD : (float) Offset for Arnaud Legoux Moving Average for Stoch and Signal
almaSigmaKD : (float) Sigma for Arnaud Legoux Moving Average for Stoch and Signal
lsmaOffSetKD : (int) Offset for Least Squares Moving Average for Stoch and Signal
Returns: A tuple of Stochastic Oscillator and Moving Average of Stochastic Oscillator
tsi(source, shortLength, longLength, maType, almaOffset, almaSigma, lsmaOffSet)
TSI (True Strengh Index). Measures the price change, calculating the ratio of the price change (positive or negative) in relation to the absolute price change.
The values of both are smoothed twice to reduce noise, and the final result is normalized in a range between 100 and -100.
Parameters:
source : (float) Source of series (close, high, low, etc.)
shortLength : (int) Short length
longLength : (int) Long length
maType : (int) Type of Moving Average for TSI
almaOffset : (float) Offset for Arnaud Legoux Moving Average
almaSigma : (float) Sigma for Arnaud Legoux Moving Average
lsmaOffSet : (int) Offset for Least Squares Moving Average
Returns: (float) TSI
smi(sourceTSI, shortLengthTSI, longLengthTSI, maTypeTSI, almaOffsetTSI, almaSigmaTSI, lsmaOffSetTSI, maTypeSignal, smoothingLengthSignal, almaOffsetSignal, almaSigmaSignal, lsmaOffSetSignal)
SMI (Stochastic Momentum Index). A TSI (True Strengh Index) plus a signal line.
Parameters:
sourceTSI : (float) Source of series for TSI (close, high, low, etc.)
shortLengthTSI : (int) Short length for TSI
longLengthTSI : (int) Long length for TSI
maTypeTSI : (int) Type of Moving Average for Signal of TSI
almaOffsetTSI : (float) Offset for Arnaud Legoux Moving Average
almaSigmaTSI : (float) Sigma for Arnaud Legoux Moving Average
lsmaOffSetTSI : (int) Offset for Least Squares Moving Average
maTypeSignal
smoothingLengthSignal
almaOffsetSignal
almaSigmaSignal
lsmaOffSetSignal
Returns: A tuple with TSI, signal of TSI and histogram of difference
wpr(source, length)
Williams R% (Williams Percent Range). Compares the current price of an asset to its highest high and lowest low over a specified time period.
Parameters:
source : (float) Source of series (close, high, low, etc.)
length : (int) Period of loopback
Returns: (float) Series of Williams R%
cci(source, length, maType, almaOffset, almaSigma, lsmaOffSet)
CCI (Commodity Channel Index). Measures the relationship between an asset's current price and its moving average.
Parameters:
source : (float) Source of series (close, high, low, etc.)
length : (int) Period of loopback
maType : (int) Type of Moving Average
almaOffset : (float) Offset for Arnaud Legoux Moving Average
almaSigma : (float) Sigma for Arnaud Legoux Moving Average
lsmaOffSet : (int) Offset for Least Squares Moving Average
Returns: (float) Series of CCI
ultimateOscillator(fastLength, middleLength, slowLength)
UO (Ultimate Oscilator). Combines three different time periods to help identify possible reversal points.
Parameters:
fastLength : (int) Fast period of loopback
middleLength : (int) Middle period of loopback
slowLength : (int) Slow period of loopback
Returns: (float) Series of Ultimate Oscilator
ultimateOscillator(source, fastLength, middleLength, slowLength)
UO (Ultimate Oscilator). Customized source. Combines three different time periods to help identify possible reversal points.
Parameters:
source : (float) Source of series (close, high, low, etc.)
fastLength : (int) Fast period of loopback
middleLength : (int) Middle period of loopback
slowLength : (int) Slow period of loopback
Returns: (float) Series of Ultimate Oscilator
macd(source, fastLength, slowLength, signalLength, maTypeFast, maTypeSlow, maTypeMACD, almaOffset, almaSigma, lsmaOffSet)
MACD (Moving Average Convergence/Divergence). Shows the difference between short-term and long-term exponential moving averages.
Parameters:
source : (float) Source of series (close, high, low, etc.)
fastLength : (int) Period for fast moving average
slowLength : (int) Period for slow moving average
signalLength : (int) Signal length
maTypeFast : (int) Type of fast moving average
maTypeSlow : (int) Type of slow moving average
maTypeMACD : (int) Type of MACD moving average
almaOffset : (float) Offset for Arnaud Legoux Moving Average
almaSigma : (float) Sigma for Arnaud Legoux Moving Average
lsmaOffSet : (int) Offset for Least Squares Moving Average
Returns: A tuple with MACD, Signal, and Histgram
fisher(length)
Fisher Transform. Normalize prices into a Gaussian normal distribution.
Parameters:
length
Returns: A tuple with Fisher Transform and signal
fisher(source, length)
Fisher Transform. Customized source. Normalize prices into a Gaussian normal distribution.
Parameters:
source : (float) Source of series (close, high, low, etc.)
length
Returns: A tuple with Fisher Transform and signal
inverseFisher(source, length, subtrahend, denominator)
Inverse Fisher Transform.
Transform the values of the Fisher Transform into a smaller and more easily interpretable scale is
through the application of an inverse transformation to the hyperbolic tangent function.
This transformation takes the values of the FT, which range from -infinity to +infinity,
to a scale limited between -1 and +1, allowing them to be more easily visualized and compared.
Parameters:
source : (float) Source of series (close, high, low, etc.)
length : (int) Period for loopback
subtrahend : (int) Denominator. Useful in unbounded indicators. For example, in CCI.
denominator
Returns: (float) Series of Inverse Fisher Transform
premierStoch(length, smoothlen)
Premier Stochastic Oscillator (PSO).
Normalizes the standard stochastic oscillator by applying a five-period double exponential smoothing
average of the %K value, resulting in a symmetric scale of 1 to -1.
Parameters:
length : (int) Period for loopback
smoothlen : (int) Period for smoothing
Returns: (float) Series of PSO
premierStoch(source, smoothlen, subtrahend, denominator)
Premier Stochastic Oscillator (PSO) of custom source.
Normalizes the source by applying a five-period double exponential smoothing average.
Parameters:
source : (float) Source of series (close, high, low, etc.)
smoothlen : (int) Period for smoothing
subtrahend : (int) Denominator. Useful in unbounded indicators. For example, in CCI.
denominator
Returns: (float) Series of PSO
stochRsi(sourceRSI, lengthRSI, kLength, kSmoothing, dSmoothing, maTypeK, maTypeD, almaOffsetKD, almaSigmaKD, lsmaOffSetKD)
Parameters:
sourceRSI
lengthRSI
kLength
kSmoothing
dSmoothing
maTypeK
maTypeD
almaOffsetKD
almaSigmaKD
lsmaOffSetKD
stochRoc(sourceROC, lengthROC, kLength, kSmoothing, dSmoothing, maTypeK, maTypeD, almaOffsetKD, almaSigmaKD, lsmaOffSetKD)
Parameters:
sourceROC
lengthROC
kLength
kSmoothing
dSmoothing
maTypeK
maTypeD
almaOffsetKD
almaSigmaKD
lsmaOffSetKD
stochUO(fastLength, middleLength, slowLength, kLength, kSmoothing, dSmoothing, maTypeK, maTypeD, almaOffsetKD, almaSigmaKD, lsmaOffSetKD)
Parameters:
fastLength
middleLength
slowLength
kLength
kSmoothing
dSmoothing
maTypeK
maTypeD
almaOffsetKD
almaSigmaKD
lsmaOffSetKD
stochTSI(source, shortLength, longLength, maType, almaOffset, almaSigma, lsmaOffSet, kLength, kSmoothing, dSmoothing, maTypeK, maTypeD, almaOffsetKD, almaSigmaKD, lsmaOffSetKD)
Parameters:
source
shortLength
longLength
maType
almaOffset
almaSigma
lsmaOffSet
kLength
kSmoothing
dSmoothing
maTypeK
maTypeD
almaOffsetKD
almaSigmaKD
lsmaOffSetKD
stochWPR(source, length, kLength, kSmoothing, dSmoothing, maTypeK, maTypeD, almaOffsetKD, almaSigmaKD, lsmaOffSetKD)
Parameters:
source
length
kLength
kSmoothing
dSmoothing
maTypeK
maTypeD
almaOffsetKD
almaSigmaKD
lsmaOffSetKD
stochCCI(source, length, maType, almaOffset, almaSigma, lsmaOffSet, kLength, kSmoothing, dSmoothing, maTypeK, maTypeD, almaOffsetKD, almaSigmaKD, lsmaOffSetKD)
Parameters:
source
length
maType
almaOffset
almaSigma
lsmaOffSet
kLength
kSmoothing
dSmoothing
maTypeK
maTypeD
almaOffsetKD
almaSigmaKD
lsmaOffSetKD
stochMACD(source, fastLength, slowLength, signalLength, maTypeFast, maTypeSlow, maTypeMACD, almaOffset, almaSigma, lsmaOffSet, kLength, kSmoothing, dSmoothing, maTypeK, maTypeD, almaOffsetKD, almaSigmaKD, lsmaOffSetKD)
Parameters:
source
fastLength
slowLength
signalLength
maTypeFast
maTypeSlow
maTypeMACD
almaOffset
almaSigma
lsmaOffSet
kLength
kSmoothing
dSmoothing
maTypeK
maTypeD
almaOffsetKD
almaSigmaKD
lsmaOffSetKD
stochFT(length, kLength, kSmoothing, dSmoothing, maTypeK, maTypeD, almaOffsetKD, almaSigmaKD, lsmaOffSetKD)
Parameters:
length
kLength
kSmoothing
dSmoothing
maTypeK
maTypeD
almaOffsetKD
almaSigmaKD
lsmaOffSetKD
stochVolume(kLength, kSmoothing, dSmoothing, maTypeK, maTypeD, almaOffsetKD, almaSigmaKD, lsmaOffSetKD)
Parameters:
kLength
kSmoothing
dSmoothing
maTypeK
maTypeD
almaOffsetKD
almaSigmaKD
lsmaOffSetKD
stochMFI(source, length, kLength, kSmoothing, dSmoothing, maTypeK, maTypeD, almaOffsetKD, almaSigmaKD, lsmaOffSetKD)
Parameters:
source
length
kLength
kSmoothing
dSmoothing
maTypeK
maTypeD
almaOffsetKD
almaSigmaKD
lsmaOffSetKD
stochOBV(source, kLength, kSmoothing, dSmoothing, maTypeK, maTypeD, almaOffsetKD, almaSigmaKD, lsmaOffSetKD)
Parameters:
source
kLength
kSmoothing
dSmoothing
maTypeK
maTypeD
almaOffsetKD
almaSigmaKD
lsmaOffSetKD
stochPVI(source, kLength, kSmoothing, dSmoothing, maTypeK, maTypeD, almaOffsetKD, almaSigmaKD, lsmaOffSetKD)
Parameters:
source
kLength
kSmoothing
dSmoothing
maTypeK
maTypeD
almaOffsetKD
almaSigmaKD
lsmaOffSetKD
stochNVI(source, kLength, kSmoothing, dSmoothing, maTypeK, maTypeD, almaOffsetKD, almaSigmaKD, lsmaOffSetKD)
Parameters:
source
kLength
kSmoothing
dSmoothing
maTypeK
maTypeD
almaOffsetKD
almaSigmaKD
lsmaOffSetKD
stochPVT(source, kLength, kSmoothing, dSmoothing, maTypeK, maTypeD, almaOffsetKD, almaSigmaKD, lsmaOffSetKD)
Parameters:
source
kLength
kSmoothing
dSmoothing
maTypeK
maTypeD
almaOffsetKD
almaSigmaKD
lsmaOffSetKD
stochVO(shortLen, longLen, maType, almaOffset, almaSigma, lsmaOffSet, kLength, kSmoothing, dSmoothing, maTypeK, maTypeD, almaOffsetKD, almaSigmaKD, lsmaOffSetKD)
Parameters:
shortLen
longLen
maType
almaOffset
almaSigma
lsmaOffSet
kLength
kSmoothing
dSmoothing
maTypeK
maTypeD
almaOffsetKD
almaSigmaKD
lsmaOffSetKD
stochVROC(length, kLength, kSmoothing, dSmoothing, maTypeK, maTypeD, almaOffsetKD, almaSigmaKD, lsmaOffSetKD)
Parameters:
length
kLength
kSmoothing
dSmoothing
maTypeK
maTypeD
almaOffsetKD
almaSigmaKD
lsmaOffSetKD
iftRSI(sourceRSI, lengthRSI, lengthIFT)
Parameters:
sourceRSI
lengthRSI
lengthIFT
iftROC(sourceROC, lengthROC, lengthIFT)
Parameters:
sourceROC
lengthROC
lengthIFT
iftUO(fastLength, middleLength, slowLength, lengthIFT)
Parameters:
fastLength
middleLength
slowLength
lengthIFT
iftStoch(kLength, kSmoothing, dSmoothing, maTypeK, maTypeD, almaOffsetKD, almaSigmaKD, lsmaOffSetKD, lengthIFT)
Parameters:
kLength
kSmoothing
dSmoothing
maTypeK
maTypeD
almaOffsetKD
almaSigmaKD
lsmaOffSetKD
lengthIFT
iftTSI(source, shortLength, longLength, maType, almaOffset, almaSigma, lsmaOffSet, lengthIFT)
Parameters:
source
shortLength
longLength
maType
almaOffset
almaSigma
lsmaOffSet
lengthIFT
iftCCI(source, length, maType, almaOffset, almaSigma, lsmaOffSet, lengthIFT)
Parameters:
source
length
maType
almaOffset
almaSigma
lsmaOffSet
lengthIFT
iftFisher(length, lengthIFT)
Parameters:
length
lengthIFT
iftMACD(source, fastLength, slowLength, signalLength, maTypeFast, maTypeSlow, maTypeMACD, almaOffset, almaSigma, lsmaOffSet, lengthIFT)
Parameters:
source
fastLength
slowLength
signalLength
maTypeFast
maTypeSlow
maTypeMACD
almaOffset
almaSigma
lsmaOffSet
lengthIFT
iftWPR(source, length, lengthIFT)
Parameters:
source
length
lengthIFT
iftMFI(source, length, lengthIFT)
Parameters:
source
length
lengthIFT
iftCMF(length, lengthIFT)
Parameters:
length
lengthIFT
iftVO(shortLen, longLen, maType, almaOffset, almaSigma, lsmaOffSet, lengthIFT)
Parameters:
shortLen
longLen
maType
almaOffset
almaSigma
lsmaOffSet
lengthIFT
iftVROC(length, lengthIFT)
Parameters:
length
lengthIFT
smiRSI(source, length, shortLengthTSI, longLengthTSI, maTypeTSI, almaOffsetTSI, almaSigmaTSI, lsmaOffSetTSI, maTypeSignal, smoothingLengthSignal, almaOffsetSignal, almaSigmaSignal, lsmaOffSetSignal)
Parameters:
source
length
shortLengthTSI
longLengthTSI
maTypeTSI
almaOffsetTSI
almaSigmaTSI
lsmaOffSetTSI
maTypeSignal
smoothingLengthSignal
almaOffsetSignal
almaSigmaSignal
lsmaOffSetSignal
smiROC(source, length, shortLengthTSI, longLengthTSI, maTypeTSI, almaOffsetTSI, almaSigmaTSI, lsmaOffSetTSI, maTypeSignal, smoothingLengthSignal, almaOffsetSignal, almaSigmaSignal, lsmaOffSetSignal)
Parameters:
source
length
shortLengthTSI
longLengthTSI
maTypeTSI
almaOffsetTSI
almaSigmaTSI
lsmaOffSetTSI
maTypeSignal
smoothingLengthSignal
almaOffsetSignal
almaSigmaSignal
lsmaOffSetSignal
smiVROC(length, shortLengthTSI, longLengthTSI, maTypeTSI, almaOffsetTSI, almaSigmaTSI, lsmaOffSetTSI, maTypeSignal, smoothingLengthSignal, almaOffsetSignal, almaSigmaSignal, lsmaOffSetSignal)
Parameters:
length
shortLengthTSI
longLengthTSI
maTypeTSI
almaOffsetTSI
almaSigmaTSI
lsmaOffSetTSI
maTypeSignal
smoothingLengthSignal
almaOffsetSignal
almaSigmaSignal
lsmaOffSetSignal
smiWPR(source, length, shortLengthTSI, longLengthTSI, maTypeTSI, almaOffsetTSI, almaSigmaTSI, lsmaOffSetTSI, maTypeSignal, smoothingLengthSignal, almaOffsetSignal, almaSigmaSignal, lsmaOffSetSignal)
Parameters:
source
length
shortLengthTSI
longLengthTSI
maTypeTSI
almaOffsetTSI
almaSigmaTSI
lsmaOffSetTSI
maTypeSignal
smoothingLengthSignal
almaOffsetSignal
almaSigmaSignal
lsmaOffSetSignal
smiFT(length, shortLengthTSI, longLengthTSI, maTypeTSI, almaOffsetTSI, almaSigmaTSI, lsmaOffSetTSI, maTypeSignal, smoothingLengthSignal, almaOffsetSignal, almaSigmaSignal, lsmaOffSetSignal)
Parameters:
length
shortLengthTSI
longLengthTSI
maTypeTSI
almaOffsetTSI
almaSigmaTSI
lsmaOffSetTSI
maTypeSignal
smoothingLengthSignal
almaOffsetSignal
almaSigmaSignal
lsmaOffSetSignal
smiFT(source, length, shortLengthTSI, longLengthTSI, maTypeTSI, almaOffsetTSI, almaSigmaTSI, lsmaOffSetTSI, maTypeSignal, smoothingLengthSignal, almaOffsetSignal, almaSigmaSignal, lsmaOffSetSignal)
Parameters:
source
length
shortLengthTSI
longLengthTSI
maTypeTSI
almaOffsetTSI
almaSigmaTSI
lsmaOffSetTSI
maTypeSignal
smoothingLengthSignal
almaOffsetSignal
almaSigmaSignal
lsmaOffSetSignal
smiCCI(source, length, maTypeCCI, almaOffsetCCI, almaSigmaCCI, lsmaOffSetCCI, shortLengthTSI, longLengthTSI, maTypeTSI, almaOffsetTSI, almaSigmaTSI, lsmaOffSetTSI, maTypeSignal, smoothingLengthSignal, almaOffsetSignal, almaSigmaSignal, lsmaOffSetSignal)
Parameters:
source
length
maTypeCCI
almaOffsetCCI
almaSigmaCCI
lsmaOffSetCCI
shortLengthTSI
longLengthTSI
maTypeTSI
almaOffsetTSI
almaSigmaTSI
lsmaOffSetTSI
maTypeSignal
smoothingLengthSignal
almaOffsetSignal
almaSigmaSignal
lsmaOffSetSignal
smiUO(fastLength, middleLength, slowLength, shortLengthTSI, longLengthTSI, maTypeTSI, almaOffsetTSI, almaSigmaTSI, lsmaOffSetTSI, maTypeSignal, smoothingLengthSignal, almaOffsetSignal, almaSigmaSignal, lsmaOffSetSignal)
Parameters:
fastLength
middleLength
slowLength
shortLengthTSI
longLengthTSI
maTypeTSI
almaOffsetTSI
almaSigmaTSI
lsmaOffSetTSI
maTypeSignal
smoothingLengthSignal
almaOffsetSignal
almaSigmaSignal
lsmaOffSetSignal
smiMACD(source, fastLength, slowLength, signalLength, maTypeFast, maTypeSlow, maTypeMACD, almaOffset, almaSigma, lsmaOffSet, shortLengthTSI, longLengthTSI, maTypeTSI, almaOffsetTSI, almaSigmaTSI, lsmaOffSetTSI, maTypeSignal, smoothingLengthSignal, almaOffsetSignal, almaSigmaSignal, lsmaOffSetSignal)
Parameters:
source
fastLength
slowLength
signalLength
maTypeFast
maTypeSlow
maTypeMACD
almaOffset
almaSigma
lsmaOffSet
shortLengthTSI
longLengthTSI
maTypeTSI
almaOffsetTSI
almaSigmaTSI
lsmaOffSetTSI
maTypeSignal
smoothingLengthSignal
almaOffsetSignal
almaSigmaSignal
lsmaOffSetSignal
smiVol(shortLengthTSI, longLengthTSI, maTypeTSI, almaOffsetTSI, almaSigmaTSI, lsmaOffSetTSI, maTypeSignal, smoothingLengthSignal, almaOffsetSignal, almaSigmaSignal, lsmaOffSetSignal)
Parameters:
shortLengthTSI
longLengthTSI
maTypeTSI
almaOffsetTSI
almaSigmaTSI
lsmaOffSetTSI
maTypeSignal
smoothingLengthSignal
almaOffsetSignal
almaSigmaSignal
lsmaOffSetSignal
smiMFI(source, length, shortLengthTSI, longLengthTSI, maTypeTSI, almaOffsetTSI, almaSigmaTSI, lsmaOffSetTSI, maTypeSignal, smoothingLengthSignal, almaOffsetSignal, almaSigmaSignal, lsmaOffSetSignal)
Parameters:
source
length
shortLengthTSI
longLengthTSI
maTypeTSI
almaOffsetTSI
almaSigmaTSI
lsmaOffSetTSI
maTypeSignal
smoothingLengthSignal
almaOffsetSignal
almaSigmaSignal
lsmaOffSetSignal
smiCMF(length, shortLengthTSI, longLengthTSI, maTypeTSI, almaOffsetTSI, almaSigmaTSI, lsmaOffSetTSI, maTypeSignal, smoothingLengthSignal, almaOffsetSignal, almaSigmaSignal, lsmaOffSetSignal)
Parameters:
length
shortLengthTSI
longLengthTSI
maTypeTSI
almaOffsetTSI
almaSigmaTSI
lsmaOffSetTSI
maTypeSignal
smoothingLengthSignal
almaOffsetSignal
almaSigmaSignal
lsmaOffSetSignal
smiOBV(source, shortLengthTSI, longLengthTSI, maTypeTSI, almaOffsetTSI, almaSigmaTSI, lsmaOffSetTSI, maTypeSignal, smoothingLengthSignal, almaOffsetSignal, almaSigmaSignal, lsmaOffSetSignal)
Parameters:
source
shortLengthTSI
longLengthTSI
maTypeTSI
almaOffsetTSI
almaSigmaTSI
lsmaOffSetTSI
maTypeSignal
smoothingLengthSignal
almaOffsetSignal
almaSigmaSignal
lsmaOffSetSignal
smiPVT(source, shortLengthTSI, longLengthTSI, maTypeTSI, almaOffsetTSI, almaSigmaTSI, lsmaOffSetTSI, maTypeSignal, smoothingLengthSignal, almaOffsetSignal, almaSigmaSignal, lsmaOffSetSignal)
Parameters:
source
shortLengthTSI
longLengthTSI
maTypeTSI
almaOffsetTSI
almaSigmaTSI
lsmaOffSetTSI
maTypeSignal
smoothingLengthSignal
almaOffsetSignal
almaSigmaSignal
lsmaOffSetSignal
smiVO(shortLen, longLen, maType, almaOffset, almaSigma, lsmaOffSet, shortLengthTSI, longLengthTSI, maTypeTSI, almaOffsetTSI, almaSigmaTSI, lsmaOffSetTSI, maTypeSignal, smoothingLengthSignal, almaOffsetSignal, almaSigmaSignal, lsmaOffSetSignal)
Parameters:
shortLen
longLen
maType
almaOffset
almaSigma
lsmaOffSet
shortLengthTSI
longLengthTSI
maTypeTSI
almaOffsetTSI
almaSigmaTSI
lsmaOffSetTSI
maTypeSignal
smoothingLengthSignal
almaOffsetSignal
almaSigmaSignal
lsmaOffSetSignal
smiPVI(source, shortLengthTSI, longLengthTSI, maTypeTSI, almaOffsetTSI, almaSigmaTSI, lsmaOffSetTSI, maTypeSignal, smoothingLengthSignal, almaOffsetSignal, almaSigmaSignal, lsmaOffSetSignal)
Parameters:
source
shortLengthTSI
longLengthTSI
maTypeTSI
almaOffsetTSI
almaSigmaTSI
lsmaOffSetTSI
maTypeSignal
smoothingLengthSignal
almaOffsetSignal
almaSigmaSignal
lsmaOffSetSignal
smiNVI(source, shortLengthTSI, longLengthTSI, maTypeTSI, almaOffsetTSI, almaSigmaTSI, lsmaOffSetTSI, maTypeSignal, smoothingLengthSignal, almaOffsetSignal, almaSigmaSignal, lsmaOffSetSignal)
Parameters:
source
shortLengthTSI
longLengthTSI
maTypeTSI
almaOffsetTSI
almaSigmaTSI
lsmaOffSetTSI
maTypeSignal
smoothingLengthSignal
almaOffsetSignal
almaSigmaSignal
lsmaOffSetSignal
rsiVolume(length)
Parameters:
length
rsiMA(sourceMA, lengthMA, maType, almaOffset, almaSigma, lsmaOffSet, lengthRSI)
Parameters:
sourceMA
lengthMA
maType
almaOffset
almaSigma
lsmaOffSet
lengthRSI
Search in scripts for "low"

TRADING MADE SIMPLEThis indicator shows market structure. The standard method of using Williams Highs and Lows as pivots, is something of an approximation.
What's original here is that we follow rules to confirm Local Highs and Local Lows, and strictly enforce that a Low can only follow a confirmed High and vice-versa.
-- Highs and Lows
To confirm a candle as a Local High, you need a later candle to Close below its Low. To confirm a Local Low, you need a Close above its High.
A Low can only follow a High (after it's been confirmed). You can't go e.g High, High, Low, Low, only High, Low, High, Low.
When price makes Higher Highs and Higher Lows, market structure is said to be bullish. When price makes Lower Lows and Lower Highs, it's bearish.
I've defined the in-between Highs and Lows as "Ranging", meaning, neutral. They could be trend continuation or reversal.
-- Bullish/Bearish Breaks
A Bullish break in market structure is when the Close of the current candle goes higher than the previous confirmed Local High.
A Bearish Break is when the Close of the current candle goes lower than the most recent confirmed Local Low.
I chose to use Close rather than High to reduce edge case weirdness. The breaking candle often ends up being a big one, thus the close of that candle can be a poor entry.
You can get live warnings by setting the alert to Options: Only Once, because during a candle, the current price is taken as the Close.
Breaks are like early warnings of a change in market bias, because you're not waiting for a High or Low to be formed and confirmed.
Buy The Dip / Sell The Rally
Buy The Dip is a label I gave to the first Higher Low in a bullish market structure. Sell The Rally is the first Lower High in a bearish market structure.
These *might* be good buying/selling opportunities, but you still need to do your own analysis to confirm that.
== USAGE ==
The point of knowing market structure is so you don't make bullish bets in a bearish market and vice versa -
or if you do at least you're aware that that's what you're doing, and hopefully have some overwhelmingly good reason to do so.
These are not signals to be traded on their own. You still need a trade thesis. Use with support & resistance and your other favourite indicators.
Works on any market on any timeframe. Be aware that market structure will be different on different timeframes.
IMPORTANT: If you're not seeing what you expect, check your settings and re-read this entire description carefully. Confirming Highs and Lows can get deceptively complex.

Bollinger Band Width PercentileIntroducing the Bollinger Band Width Percentile
Definitions :
Bollinger Band Width Percentile is derived from the Bollinger Band Width indicator.
It shows the percentage of bars over a specified lookback period that the Bollinger Band Width was less than the current Bollinger Band Width.
Bollinger Band Width is derived from the Bollinger Bands® indicator.
It quantitatively measures the width between the Upper and Lower Bands of the Bollinger Bands.
Bollinger Bands® is a volatility-based indicator.
It consists of three lines which are plotted in relation to a security's price.
The Middle Line is typically a Simple Moving Average.
The Upper and Lower Bands are typically 2 standard deviations above, and below the SMA (Middle Line).
Volatility is a statistical measure of the dispersion of returns for a given security or market index, measured by the standard deviation of logarithmic returns.
The Broad Concept :
Quoting Tradingview specifically for commonly noted limitations of the BBW indicator which I have based this indicator on....
“ Bollinger Bands Width (BBW) outputs a Percentage Difference between the Upper Band and the Lower Band.
This value is used to define the narrowness of the bands.
What needs to be understood however is that a trader cannot simply look at the BBW value and determine if the Band is truly narrow or not.
The significance of an instruments relative narrowness changes depending on the instrument or security in question.
What is considered narrow for one security may not be for another.
What is considered narrow for one security may even change within the scope of the same security depending on the timeframe.
In order to accurately gauge the significance of a narrowing of the bands, a technical analyst will need to research past BBW fluctuations and price performance to increase trading accuracy. ”
Here I present the Bollinger Band Width Percentile as a refinement of the BBW to somewhat overcome the limitations cited above.
Much of the work researching past BBW fluctuations, and making relative comparisons is done naturally by calculating the Bollinger Band Width Percentile.
This calculation also means that it can be read in a similar fashion across assets, greatly simplifying the interpretation of it.
Plotted Components of the Bollinger Band Width Percentile indicator :
Scale High
Mid Line
Scale Low
BBWP plot
Moving Average 1
Moving Average 2
Extreme High Alert
Extreme Low Alert
Bollinger Band Width Percentile Properties:
BBWP Length
The time period to be used in calculating the Moving average which creates the Basis for the BBW component of the BBWP.
Basis Type
The type of moving average to be used as the Basis for the BBW component of the BBWP.
BBWP Lookback
The lookback period to be used in calculating the BBWP itself.
BBWP Plot settings
The BBWP plot settings give a choice between a user defined solid color, and a choice of "Blue Green Red", or "Blue Red" spectrum palettes.
Moving Averages
Has 2 Optional User definable and adjustable moving averages of the BBWP.
Visual Alerts
Optional User adjustable High and low Signal columns.
How to read the BBWP :
A BBWP read of 95 % ... means that the current BBW level is greater than 95% of the lookback period.
A BBWP read of 5 % .... means that the current BBW level is lower than 95% of the lookback period.
Proposed interpretations :
When the BBWP gets above 90 % and particularly when it hits 100% ... this can be a signal that volatility is reaching a maximum and that a macro High or Low is about to be set.
When the BBWP gets below 10 % and particularly when it hits 0% ...... this can be a signal that volatility is reaching a minimum and that there could be a violent range breakout into a trending move.
When the BBWP hits a low level < 5 % and then gets above its moving average ...... this can be an early signal that a consolidation phase is ending and a trending move is beginning.
When the BBWP hits a high level > 95 % and then falls below its moving average ... this can be an early signal that a trending move is ending and a consolidation phase is beginning.
Essential knowledge :
The BBWP was designed with the daily timeframe in mind, but technical analysists may find use for it on other time frames also.
High and Low BBWP readings do not entail any direction bias.
Deeper Concepts :
In finance, “mean reversion” is the assumption that a financial instrument's price will tend to move towards the average price over time.
If we apply that same logic to volatility as represented here by the Bollinger band width percentile, the assumption is that the Bollinger band width percentile will tend to contract from extreme highs, and expand from extreme lows over time corresponding to repeated phases of contraction and expansion of volatility.
It is clear that for most assets there are periods of directional trending behavior followed by periods of “consolidation” ( trading sideways in a range ).
This often ends with a tightening range under reducing volume and volatility ( popularly known as “the squeeze” ).
The squeeze typically ends with a “breakout” from the range characterized by a rapid increase in volume, and volatility when price action again trends directionally, and the cycle repeats.
Typical Use Cases :
The Bollinger Band Width Percentile may be especially useful for Options traders, as it can provide a bias for when Options are relatively expensive, or inexpensive from a Volatility (Vega) perspective.
When the Bollinger Band Width Percentile is relatively high ( 85 percentile or above ) it may be more advantageous to be a net seller of Vega.
When the Bollinger Band Width Percentile is relatively low ( 15 percentile or below ) it may be advantageous to be net long Vega.
Here we examine a number of actionable signals on BTCUSD daily timeframe using the BBWP and a momentum oscillator ( using the TSI here but can equally be used with Bollinger bands, moving averages, or the traders preferred momentum oscillator ).
In this first case we will examine how a spot trader and an options trader could each use a low BBWP read to alert them to a good potential trade setup.
note: using a period of 30 for both the Bollinger bands and the BBWP period ( approximately a month ) and a BBWP lookback of 350 ( approximately a year )
As we see the Bollinger Bands have gradually contracted while price action trended down and the BBWP also fell consistently while below its moving average ( denoting falling volatility ) down to an extremely low level <5% until it broke above its moving average along with a break of range to the upside ( signaling the end of the consolidation at a low level and the beginning of a new trending move to the upside with expanding volatility).
In this next case we will continue to follow the price action presuming that the traders have taken or locked in profit at reasonable take profit levels from the previous trade setup.
Here we see the contraction of the Bollinger bands, and the BBWP alongside price action breaking below the BB Basis giving a warning that the trending move to the upside is likely over.
We then see the BBWP rising and getting above its moving average while price action fails to get above the BB Basis, likewise the TSI fails to get above its signal line and actually crosses below its zeroline.
The trader would normally take this as a signal that the next trending move could be to the downside.
The next trending move turns out to be a dramatic downside move which causes the BBWP to hit 100% signaling that volatility is likely to hit a maximum giving good opportunities for profitable trades to the skilled trader as outlined.
Limitations :
Here we will look at 2 cases where blindly taking BBWP signals could cause the trader to take a failed trade.
In this first example we will look at blindly taking a low volatility options trade
Low Volatility and corresponding low BBWP levels do not automatically mean there has to be expansion immediately, these periods of extreme low volatility can go on for quite some time.
In this second example we will look at blindly taking a high volatility spot short trade
High volatility and corresponding high BBWP levels do not automatically mean there has to be a macro high and contraction of volatility immediately, these periods of extreme high volatility can also go on for quite some time, hence the famous saying "The trend is your friend until the end of the trend" and lesser well known, but equally valid saying "never try to short the top of a parabolic blow off top"
Markets are variable and past performance is no guarantee of future results, this is not financial advice, I am not a financial advisor.
Final thoughts
The BBWP is an improvement over the BBW in my opinion, and is a novel, and useful addition to a Technical Analysts toolkit.
It is not a standalone indicator and is meant to be used in conjunction with other tools for direction bias, and Good Risk Management to base sound trades off.
John Bollinger has suggested using Bolliger bands, and its related indicators with two or three other non-correlated indicators that provide more direct market signals.
He believes it is crucial to use indicators based on different types of data.
Some of his favored technical techniques are moving average divergence/convergence (MACD), on-balance volume and relative strength index (RSI).
Thanks
Massive respect to John Bollinger, long-time technician of the markets, and legendary creator of both the Bollinger Bands® in the 1980´s, and the Bollinger band Width indicator in 2010 which this indicator is based on.
His work continues to inspire, decades after he brought the original Bollinger Bands to the market.
Much respect also to Eric Crown who gave me the fundamental knowledge of Technical Analysis, and Options trading.

Ichimoku Kinkō HyōThe Ichimoku Kinko Hyo is an trading system developed by the late Goichi Hosoda (pen name "Ichimokusanjin") when he was the general manager of the business conditions department of Miyako Shinbun, the predecessor of the Tokyo Shimbun. Currently, it is a registered trademark of Economic Fluctuation Research Institute Co., Ltd., which is run by the bereaved family of Hosoda as a private research institute.
The Ichimoku Kinko Hyo is composed of time theory, price range theory (target price theory) and wave movement theory. Ichimoku means "At One Glace". The equilibrium table is famous for its span, but the first in the equilibrium table is the time relationship.
In the theory of time, the change date is the day after the number of periods classified into the basic numerical value such as 9, 17, 26, etc., the equal numerical value that takes the number of periods of the past wave motion, and the habit numerical value that appears for each issue is there. The market is based on the idea that the buying and selling equilibrium will move in the wrong direction. Another feature is that time is emphasized in order to estimate when changes will occur.
In the price range theory, there are E・V・N・NT calculated values and multiple values of 4 to 8E as target values. In addition, in order to determine the momentum and direction of the market, we will consider other price ranges and ying and yang numbers.
If the calculated value is realized on the change date calculated by each numerical value, the market price is likely to reverse.
転換線 (Tenkansen) (Conversion Line) = (highest price in the past 9 periods + lowest price) ÷ 2
基準線 (Kijunsen) (Base Line) = (highest price in the past 26 periods + lowest price) ÷ 2
It represents Support/Resistance for 16 bars. It is a 50% Fibonacci Retracement. The Kijun sen is knows as the "container" of the trend. It is prefect to use as an initial stop and/or trailing stop.
先行スパン1 (Senkou span 1) (Lagging Span 1) = {(conversion value + reference value) ÷ 2} 25 periods ahead (26 periods ahead including the current day, that is)
先行スパン2 (Senkou span 2) (Lagging Span 2) = {(highest price in the past 52 periods + lowest price) ÷ 2} 25 periods ahead (26 periods ahead including the current day, that is)
遅行スパン (Chikou span) (Lagging Span) = (current candle closing price) plotted 26 periods before (that is, including the current day) 25 periods ago
It is the only Ichimoku indicator that uses the closing price. It is used for momentum of the trend.
The area surrounded by the two lagging span lines is called a cloud. This is the foundation of the system. It determines the sentiment (Bull/Bear) for the insrument. If price is above the cloud, the instrument is bullish. If price is below the cloud, the instrument is bearish.
-
The wave theory of the Ichimoku Kinko Hyo has the following waves.
All about the rising market. If it is the falling market, the opposite is true.
I wave rise one market price.
V wave the market price that raises and lowers.
N wave the market price for raising, lowering, and raising.
P wave the high price depreciates and the low price rises with the passage of time. Leave either.
Y wave the high price rises and the low price falls with the passage of time. Leave either.
S wave A market in which the lowered market rebounds and rises at the previous high level.
There are the above 6 types but the basis of the Ichimoku Kinko Hyo is the N wave of 3 waves.
In Elliott wave theory and similar theories, basically there are 5 waves but 5 waves are a series of 2 and 3 waves N, 3 for 7 waves, 4 for 9 waves and so on.
Even if it keep continuing, it will be based on N wave. In addition, since the P wave and the Y wave are separated from each other, they can be seen as N waves from a large perspective.
-
There are basic E・V・N・NT calculated values and several other calculation methods for the Ichimoku Kinko Hyo. It is the only calculated value that gives a concrete value in the Ichimoku Kinko Hyo, which is difficult to understand, but since we focus only on the price difference and do not consider the supply and demand, it is forbidden to stick to the calculated value alone.
(The calculation method of the following five calculated values is based on the rising market price, which is raised from the low price A to the high price B and lowered from the high price B to the low price C. Therefore, the low price C is higher than the low price A)
E calculated value The amount of increase from the low price A to the high price B is added to the high price B. = B + (BA)
V calculated value Adds the amount of decline from the high price B to the low price C to the high price B. = B + (BC)
N calculated value The amount of increase from the low price A to the high price B is added to the low price C. = C + (BA)
NT calculated value Adds the amount of increase from the low price A to the low price C to the low price C. = C + (CA)
4E calculated value (four-layer double / quadruple value) Adds three times the amount of increase from the low price A to the high price B to the high price B. = B + 3 × (BA)
Calculated value of P wave The upper price is devalued and the lower price is rounded up, and the price range of both is the same.
Calculated value of Y wave The upper price is rounded up and the lower price is rounded down, and the price range of both is the same.

Smart Money Flow Index (SMFI) - Advanced SMC [PhenLabs]📊Smart Money Flow Index (SMFI)
Version: PineScript™v6
📌Description
The Smart Money Flow Index (SMFI) is an advanced Smart Money Concepts implementation that tracks institutional trading behavior through multi-dimensional analysis. This comprehensive indicator combines volume-validated Order Block detection, Fair Value Gap identification with auto-mitigation tracking, dynamic Liquidity Zone mapping, and Break of Structure/Change of Character detection into a unified system.
Unlike basic SMC indicators, SMFI employs a proprietary scoring algorithm that weighs five critical factors: Order Block strength (validated by volume), Fair Value Gap size and recency, proximity to Liquidity Zones, market structure alignment (BOS/CHoCH), and multi-timeframe confluence. This produces a Smart Money Score (0-100) where readings above 70 represent optimal institutional setup conditions.
🚀Points of Innovation
Volume-Validated Order Block Detection – Only displays Order Blocks when formation candle exceeds customizable volume multiplier (default 1.5x average), filtering weak zones and highlighting true institutional accumulation/distribution
Auto-Mitigation Tracking System – Fair Value Gaps and Order Blocks automatically update status when price mitigates them, with visual distinction between active and filled zones preventing trades on dead levels
Proprietary Smart Money Score Algorithm – Combines weighted factors (OB strength 25%, FVG proximity 20%, Liquidity 20%, Structure 20%, MTF 15%) into single 0-100 confidence rating updating in real-time
ATR-Based Adaptive Calculations – All distance measurements use 14-period Average True Range ensuring consistent function across any instrument, timeframe, or volatility regime without manual recalibration
Dynamic Age Filtering – Automatically removes liquidity levels and FVGs older than configurable thresholds preventing chart clutter while maintaining relevant levels
Multi-Timeframe Confluence Integration – Analyzes higher timeframe bias with customizable multipliers (2-10x) and incorporates HTF trend direction into Smart Money Score for institutional alignment
🔧Core Components
Order Block Engine – Detects institutional supply/demand zones using characteristic patterns (down-move-then-strong-up for bullish, up-move-then-strong-down for bearish) with minimum volume threshold validation, tracks mitigation when price closes through zones
Fair Value Gap Scanner – Identifies price imbalances where current candle's low/high leaves gap with two-candle-prior high/low, filters by minimum size percentage, monitors 50% fill for mitigation status
Liquidity Zone Mapper – Uses pivot high/low detection with configurable lookback to mark swing points where stop losses cluster, extends horizontal lines to visualize sweep targets, manages lifecycle through age-based removal
Market Structure Analyzer – Tracks pivot progression to identify trend through higher-highs/higher-lows (bullish) or lower-highs/lower-lows (bearish), detects Break of Structure and Change of Character for trend/reversal confirmation
Scoring Calculation Engine – Evaluates proximity to nearest Order Blocks using ATR-normalized distance, assesses FVG recency and distance, calculates liquidity proximity with age weighting, combines structure bias and MTF trend into smoothed final score
🔥Key Features
Customizable Display Limits – Control maximum Order Blocks (1-10), Liquidity Zones (1-10), and FVG age (10-200 bars) to maintain clean charts focused on most relevant institutional levels
Gradient Strength Visualization – All zones render with transparency-adjustable coloring where stronger/newer zones appear more solid and weaker/older zones fade progressively providing instant visual hierarchy
Educational Label System – Optional labels identify each zone type (Bullish OB, Bearish OB, Bullish FVG, Bearish FVG, BOS) with color-coded text helping traders learn SMC concepts through practical application
Real-Time Smart Money Score Dashboard – Top-right table displays current score (0-100) with color coding (green >70, yellow 30-70, red <30) plus trend arrow for at-a-glance confidence assessment
Comprehensive Alert Suite – Configurable notifications for Order Block formation, Fair Value Gap detection, Break of Structure events, Change of Character signals, and high Smart Money Score readings (>70)
Buy/Sell Signal Integration – Automatically plots triangle markers when Smart Money Score exceeds 70 with aligned market structure and fresh Order Block detection providing clear entry signals
🎨Visualization
Order Block Boxes – Shaded rectangles extend from formation bar spanning high-to-low of institutional candle, bullish zones in green, bearish in red, with customizable transparency (80-98%)
Fair Value Gap Zones – Rectangular areas marking imbalances, active FVGs display in bright colors with adjustable transparency, mitigated FVGs switch to gray preventing trades on filled zones
Liquidity Level Lines – Dashed horizontal lines extend from pivot creation points, swing highs in bearish color (short targets above), swing lows in bullish color (long targets below), opacity decreases with age
Structure Labels – "BOS" labels appear above/below price when Break of Structure confirmed, colored by direction (green bullish, red bearish), positioned at 1% beyond highs/lows for visibility
Educational Info Panel – Bottom-right table explains key terminology (OB, FVG, BOS, CHoCH) and score interpretation (>70 high probability) with semi-transparent background for readability
📖Usage Guidelines
General Settings
Show Order Blocks – Default: On, toggles visibility of institutional supply/demand zones, disable when focusing solely on FVGs or Liquidity
Show Fair Value Gaps – Default: On, controls FVG zone display including active and mitigated imbalances
Show Liquidity Zones – Default: On, manages liquidity line visibility, disable on lower timeframes to reduce clutter
Show Market Structure – Default: On, toggles BOS/CHoCH label display
Show Smart Money Score – Default: On, controls score dashboard visibility
Order Block Settings
OB Lookback Period – Default: 20, Range: 5-100, controls bars scanned for Order Block patterns, lower values detect recent activity, higher values find older blocks
Min Volume Multiplier – Default: 1.5, Range: 1.0-5.0, sets minimum volume threshold as multiple of 20-period average, higher values (2.0+) filter for strongest institutional candles
Max Order Blocks to Display – Default: 3, Range: 1-10, limits simultaneous Order Blocks shown, lower settings (1-3) maintain focus on most recent zones
Fair Value Gap Settings
Min FVG Size (%) – Default: 0.3, Range: 0.1-2.0, defines minimum gap size as percentage of close price, lower values detect micro-imbalances, higher values focus on significant gaps
Max FVG Age (bars) – Default: 50, Range: 10-200, removes FVGs older than specified bars, lower settings (10-30) for scalping, higher (100-200) for swing trading
Show FVG Mitigation – Default: On, displays filled FVGs in gray providing visual history, disable to show only active untouched imbalances
Liquidity Zone Settings
Liquidity Lookback – Default: 50, Range: 20-200, sets pivot detection period for swing highs/lows, lower values (20-50) mark shorter-term liquidity, higher (100-200) identify major swings
Max Liquidity Age (bars) – Default: 100, Range: 20-500, removes liquidity lines older than specified bars, adjust based on timeframe
Liquidity Sensitivity – Default: 0.5, Range: 0.1-1.0, controls pivot detection sensitivity, lower values mark only major swings, higher values identify minor swings
Max Liquidity Zones to Display – Default: 3, Range: 1-10, limits total liquidity levels shown maintaining chart clarity
Market Structure Settings
Pivot Length – Default: 5, Range: 3-15, defines bars to left/right for pivot validation, lower values (3-5) create sensitive structure breaks, higher (10-15) filter for major shifts
Min Structure Move (%) – Default: 1.0, Range: 0.1-5.0, sets minimum percentage move required between pivots to confirm structure change
Multi-Timeframe Settings
Enable MTF Analysis – Default: On, activates higher timeframe trend analysis incorporation into Smart Money Score
Higher Timeframe Multiplier – Default: 4, Range: 2-10, multiplies current timeframe to determine analysis timeframe (4x on 15min = 1hour)
Visual Settings
Bullish Color – Default: Green (#089981), sets color for bullish Order Blocks, FVGs, and structure elements
Bearish Color – Default: Red (#f23645), defines color for bearish elements
Neutral Color – Default: Gray (#787b86), controls color of mitigated zones and neutral elements
Show Educational Labels – Default: On, displays text labels on zones identifying type (OB, FVG, BOS), disable once familiar with patterns
Order Block Transparency – Default: 92, Range: 80-98, controls Order Block box transparency
FVG Transparency – Default: 92, Range: 80-98, sets Fair Value Gap zone transparency independently from Order Blocks
Alert Settings
Alert on Order Block Formation – Default: On, triggers notification when new volume-validated Order Block detected
Alert on FVG Formation – Default: On, sends alert when Fair Value Gap appears enabling quick response to imbalances
Alert on Break of Structure – Default: On, notifies when BOS or CHoCH confirmed
Alert on High Smart Money Score – Default: On, alerts when Smart Money Score crosses above 70 threshold indicating high-probability setup
✅Best Use Cases
Order Block Retest Entries – After Break of Structure, wait for price retrace into fresh bullish Order Block with Smart Money Score >70, enter long on zone reaction targeting next liquidity level
Fair Value Gap Retracement Trading – When price creates FVG during strong move then retraces, enter as price approaches unfilled gap expecting institutional orders to continue trend
Liquidity Sweep Reversals – Monitor price approaching swing high/low liquidity zones against prevailing Smart Money Score trend, after stop hunt sweep watch for rejection into premium Order Block/FVG
Multi-Timeframe Confluence Setups – Identify alignment when current timeframe Order Block coincides with higher timeframe FVG plus MTF analysis showing matching trend bias
Break of Structure Continuations – After BOS confirms trend direction, trade pullbacks to nearest Order Block or FVG in direction of structure break using Smart Money Score >70 as entry filter
Change of Character Reversal Plays – When CHoCH detected indicating potential reversal, look for Smart Money Score pivot with opposing Order Block formation then enter on structure confirmation
⚠️Limitations
Lagging Pivot Calculations – Pivot-based features (Liquidity Zones, Market Structure) require bars to right of pivot for confirmation, meaning these elements identify levels retrospectively with delay equal to lookback period
Whipsaw in Ranging Markets – During choppy conditions, Order Blocks fail frequently and structure breaks produce false signals as Smart Money Score fluctuates without clear institutional bias, best used in trending markets
Volume Data Dependency – Order Block volume validation requires accurate volume data which may be incomplete on Forex pairs or limited in crypto exchange feeds
Subjectivity in Scoring Weights – Proprietary 25-20-20-20-15 weighting reflects general institutional behavior but may not optimize for specific instruments or market regimes, user cannot adjust factor weights
Visual Complexity on Lower Timeframes – Sub-hour timeframes generate excessive zones creating cluttered charts, requires aggressive display limit reduction and higher minimum thresholds
No Fundamental Integration – Indicator analyzes purely technical price action and volume without incorporating economic events, news catalysts, or fundamental shifts that override technical levels
💡What Makes This Unique
Unified SMC Ecosystem – Unlike indicators displaying Order Blocks OR FVGs OR Liquidity separately, SMFI combines all three institutional concepts plus market structure into single cohesive system
Proprietary Confidence Scoring – Rather than manual setup assessment, automated Smart Money Score quantifies probability by weighting five institutional dimensions into actionable 0-100 rating
Volume-Filtered Quality – Eliminates weak Order Blocks forming without institutional volume confirmation, ensuring displayed zones represent genuine accumulation/distribution
Adaptive Lifecycle Management – Automatically updates mitigation status and removes aged zones preventing trades on dead levels through continuous validity and age monitoring
Educational Integration – Built-in tooltips, labeled zones, and reference panel make indicator functional for both learning Smart Money Concepts and executing strategies
🔬How It Works
Order Block Detection – Scans for patterns where strong directional move follows counter-move creating last down-candle before rally (bullish OB) or last up-candle before sell-off (bearish OB), validates formations only when candle exhibits volume exceeding configurable multiple (default 1.5x) of 20-bar average volume
Fair Value Gap Identification – Compares current candle’s high/low against two-candles-prior low/high to detect price imbalances, calculates gap size as percentage of close and filters micro-gaps below minimum threshold (default 0.3%), monitors whether subsequent price fills 50% triggering mitigation status
Liquidity Zone Mapping – Employs pivot detection using configurable lookback (default 50 bars) to identify swing highs/lows where retail stops cluster, extends horizontal reference lines from pivot creation and applies age-based filtering to remove stale zones
Market Structure Analysis – Tracks pivot progression using structure-specific lookback (default 5 bars) to determine trend, confirms uptrend when new pivot high exceeds previous by minimum move percentage, detects Break of Structure when price breaks recent pivot level, flags Change of Character for potential reversals
Multi-Timeframe Confluence – When enabled, requests security data from higher timeframe (current TF × HTF multiplier, default 4x), compares HTF close against HTF 20-period MA to determine bias, contributes ±50 points to score ensuring alignment with institutional positioning on superior timeframe
Smart Money Score Calculation – Evaluates Order Block component via ATR-normalized distance producing max 100-point contribution weighted at 25%, assesses FVG factor through age penalty and distance at 20% weight, calculates Liquidity proximity at 20%, incorporates structure bias (±50-100 points) at 20%, adds MTF component at 15%, applies 3-period smoothing to reduce volatility
Visual Rendering and Lifecycle – Draws Order Block boxes, Fair Value Gap rectangles with color coding (green/red active, gray mitigated), extends liquidity dashed lines with fade-by-age opacity, plots BOS labels, displays Smart Money Score dashboard, continuously updates checking mitigation conditions and removing elements exceeding age/display limits
💡Note:
The Smart Money Flow Index combines multiple Smart Money Concepts into unified institutional order flow analysis. For optimal results, use the Smart Money Score as confluence filter rather than standalone entry signal – scores above 70 indicate high-probability setups but should be combined with risk management, higher timeframe bias, and market regime understanding.

Hidden Impulse═══════════════════════════════════════════════════════════════════
HIDDEN IMPULSE - Multi-Timeframe Momentum Detection System
═══════════════════════════════════════════════════════════════════
OVERVIEW
Hidden Impulse is an advanced momentum oscillator that combines the Schaff Trend Cycle (STC) and Force Index into a comprehensive multi-timeframe trading system. Unlike standard implementations of these indicators, this script introduces three distinct trading setups with specific entry conditions, multi-timeframe confirmation, and trend filtering.
═══════════════════════════════════════════════════════════════════
ORIGINALITY & KEY FEATURES
This indicator is original in the following ways:
1. DUAL-TIMEFRAME STC ANALYSIS
Standard STC implementations work on a single timeframe. This script
simultaneously analyzes STC on both your trading timeframe and a higher
timeframe, providing trend context and filtering out low-probability signals.
2. FORCE INDEX INTEGRATION
The script combines STC with Force Index (volume-weighted price momentum)
to confirm the strength behind price moves. This combination helps identify
when momentum shifts are backed by genuine buying/selling pressure.
3. THREE DISTINCT TRADING SETUPS
Rather than generic overbought/oversold signals, the indicator provides
three specific, rule-based setups:
- Setup A: Classic trend-following entries with multi-timeframe confirmation
- Setup B: Divergence-based reversal entries (highest probability)
- Setup C: Mean-reversion bounce trades at extreme levels
4. INTELLIGENT FILTERING
All signals are filtered through:
- 50 EMA trend direction (prevents counter-trend trades)
- Higher timeframe STC alignment (ensures macro trend agreement)
- Force Index confirmation (validates volume support)
═══════════════════════════════════════════════════════════════════
HOW IT WORKS - TECHNICAL EXPLANATION
SCHAFF TREND CYCLE (STC) CALCULATION:
The STC is a cyclical oscillator that combines MACD concepts with stochastic
smoothing to create earlier and smoother trend signals.
Step 1: Calculate MACD
- Fast MA = EMA(close, Length1) — default 23
- Slow MA = EMA(close, Length2) — default 50
- MACD Line = Fast MA - Slow MA
Step 2: First Stochastic Smoothing
- Apply stochastic calculation to MACD
- Stoch1 = 100 × (MACD - Lowest(MACD, Smoothing)) / (Highest(MACD, Smoothing) - Lowest(MACD, Smoothing))
- Smooth result with EMA(Stoch1, Smoothing) — default 10
Step 3: Second Stochastic Smoothing
- Apply stochastic calculation again to the smoothed stochastic
- This creates the final STC value between 0-100
The dual stochastic smoothing makes STC more responsive than MACD while
being smoother than traditional stochastics.
FORCE INDEX CALCULATION:
Force Index measures the power behind price movements by incorporating volume:
Force Raw = (Close - Close ) × Volume
Force Index = EMA(Force Raw, Period) — default 13
Interpretation:
- Positive Force Index = Buying pressure (bulls in control)
- Negative Force Index = Selling pressure (bears in control)
- Force Index crossing zero = Momentum shift
- Divergences with price = Weakening momentum (reversal signal)
TREND FILTER:
A 50-period EMA serves as the trend filter:
- Price above EMA50 = Uptrend → Only LONG signals allowed
- Price below EMA50 = Downtrend → Only SHORT signals allowed
This prevents counter-trend trading which accounts for most losing trades.
═══════════════════════════════════════════════════════════════════
THE THREE TRADING SETUPS - DETAILED
SETUP A: CLASSIC MOMENTUM ENTRY
Concept: Enter when STC exits oversold/overbought zones with trend confirmation
LONG CONDITIONS:
1. Higher timeframe STC > 25 (macro trend is up)
2. Primary timeframe STC crosses above 25 (momentum turning up)
3. Force Index crosses above 0 OR already positive (volume confirms)
4. Price above 50 EMA (local trend is up)
SHORT CONDITIONS:
1. Higher timeframe STC < 75 (macro trend is down)
2. Primary timeframe STC crosses below 75 (momentum turning down)
3. Force Index crosses below 0 OR already negative (volume confirms)
4. Price below 50 EMA (local trend is down)
Best for: Trending markets, continuation trades
Win rate: Moderate (60-65%)
Risk/Reward: 1:2 to 1:3
───────────────────────────────────────────────────────────────────
SETUP B: DIVERGENCE REVERSAL (HIGHEST PROBABILITY)
Concept: Identify exhaustion points where price makes new extremes but
momentum (Force Index) fails to confirm
BULLISH DIVERGENCE:
1. Price makes a lower low (LL) over 10 bars
2. Force Index makes a higher low (HL) — refuses to follow price down
3. STC is below 25 (oversold condition)
Trigger: STC starts rising AND Force Index crosses above zero
BEARISH DIVERGENCE:
1. Price makes a higher high (HH) over 10 bars
2. Force Index makes a lower high (LH) — refuses to follow price up
3. STC is above 75 (overbought condition)
Trigger: STC starts falling AND Force Index crosses below zero
Why this works: Divergences signal that the current trend is losing steam.
When volume (Force Index) doesn't confirm new price extremes, a reversal
is likely.
Best for: Reversal trading, range-bound markets
Win rate: High (70-75%)
Risk/Reward: 1:3 to 1:5
───────────────────────────────────────────────────────────────────
SETUP C: QUICK BOUNCE AT EXTREMES
Concept: Catch rapid mean-reversion moves when price touches EMA50 in
extreme STC zones
LONG CONDITIONS:
1. Price touches 50 EMA from above (pullback in uptrend)
2. STC < 15 (extreme oversold)
3. Force Index > 0 (buyers stepping in)
SHORT CONDITIONS:
1. Price touches 50 EMA from below (pullback in downtrend)
2. STC > 85 (extreme overbought)
3. Force Index < 0 (sellers stepping in)
Best for: Scalping, quick mean-reversion trades
Win rate: Moderate (55-60%)
Risk/Reward: 1:1 to 1:2
Note: Use tighter stops and quick profit-taking
═══════════════════════════════════════════════════════════════════
HOW TO USE THE INDICATOR
STEP 1: CONFIGURE TIMEFRAMES
Primary Timeframe (STC - Primary Timeframe):
- Leave empty to use your current chart timeframe
- This is where you'll take trades
Higher Timeframe (STC - Higher Timeframe):
- Default: 30 minutes
- Recommended ratios:
* 5min chart → 30min higher TF
* 15min chart → 1H higher TF
* 1H chart → 4H higher TF
* Daily chart → Weekly higher TF
───────────────────────────────────────────────────────────────────
STEP 2: ADJUST STC PARAMETERS FOR YOUR MARKET
Default (23/50/10) works well for stocks and forex, but adjust for:
CRYPTO (volatile):
- Length 1: 15
- Length 2: 35
- Smoothing: 8
(Faster response for rapid price movements)
STOCKS (standard):
- Length 1: 23
- Length 2: 50
- Smoothing: 10
(Balanced settings)
FOREX MAJORS (slower):
- Length 1: 30
- Length 2: 60
- Smoothing: 12
(Filters out noise in 24/7 markets)
───────────────────────────────────────────────────────────────────
STEP 3: ENABLE YOUR PREFERRED SETUPS
Toggle setups based on your trading style:
Conservative Trader:
✓ Setup B (Divergence) — highest win rate
✗ Setup A (Classic) — only in strong trends
✗ Setup C (Bounce) — too aggressive
Trend Trader:
✓ Setup A (Classic) — primary signals
✓ Setup B (Divergence) — for entries on pullbacks
✗ Setup C (Bounce) — not suitable for trending
Scalper:
✓ Setup C (Bounce) — quick in-and-out
✓ Setup B (Divergence) — high probability scalps
✗ Setup A (Classic) — too slow
───────────────────────────────────────────────────────────────────
STEP 4: READ THE SIGNALS
ON THE CHART:
Labels appear when conditions are met:
Green labels:
- "LONG A" — Setup A long entry
- "LONG B DIV" — Setup B divergence long (best signal)
- "LONG C" — Setup C bounce long
Red labels:
- "SHORT A" — Setup A short entry
- "SHORT B DIV" — Setup B divergence short (best signal)
- "SHORT C" — Setup C bounce short
IN THE INDICATOR PANEL (bottom):
- Blue line = Primary timeframe STC
- Orange dots = Higher timeframe STC (optional)
- Green/Red bars = Force Index histogram
- Dashed lines at 25/75 = Entry/Exit zones
- Background shading = Oversold (green) / Overbought (red)
INFO TABLE (top-right corner):
Shows real-time status:
- STC values for both timeframes
- Force Index direction
- Price position vs EMA
- Current trend direction
- Active signal type
═══════════════════════════════════════════════════════════════════
TRADING STRATEGY & RISK MANAGEMENT
ENTRY RULES:
Priority ranking (best to worst):
1st: Setup B (Divergence) — wait for these
2nd: Setup A (Classic) — in confirmed trends only
3rd: Setup C (Bounce) — scalping only
Confirmation checklist before entry:
☑ Signal label appears on chart
☑ TREND in info table matches signal direction
☑ Higher timeframe STC aligned (check orange dots or table)
☑ Force Index confirming (check histogram color)
───────────────────────────────────────────────────────────────────
STOP LOSS PLACEMENT:
Setup A (Classic):
- LONG: Below recent swing low
- SHORT: Above recent swing high
- Typical: 1-2 ATR distance
Setup B (Divergence):
- LONG: Below the divergence low
- SHORT: Above the divergence high
- Typical: 0.5-1.5 ATR distance
Setup C (Bounce):
- LONG: 5-10 pips below EMA50
- SHORT: 5-10 pips above EMA50
- Typical: 0.3-0.8 ATR distance
───────────────────────────────────────────────────────────────────
TAKE PROFIT TARGETS:
Conservative approach:
- Exit when STC reaches opposite level
- LONG: Exit when STC > 75
- SHORT: Exit when STC < 25
Aggressive approach:
- Hold until opposite signal appears
- Trail stop as STC moves in your favor
Partial profits:
- Take 50% at 1:2 risk/reward
- Let remaining 50% run to target
───────────────────────────────────────────────────────────────────
WHAT TO AVOID:
❌ Trading Setup A in sideways/choppy markets
→ Wait for clear trend or use Setup B only
❌ Ignoring higher timeframe STC
→ Always check orange dots align with your direction
❌ Taking signals against the major trend
→ If weekly trend is down, be cautious with longs
❌ Overtrading Setup C
→ Maximum 2-3 bounce trades per session
❌ Trading during low volume periods
→ Force Index becomes unreliable
═══════════════════════════════════════════════════════════════════
ALERTS CONFIGURATION
The indicator includes 8 alert types:
Individual setup alerts:
- "Setup A - LONG" / "Setup A - SHORT"
- "Setup B - DIV LONG" / "Setup B - DIV SHORT" ⭐ recommended
- "Setup C - BOUNCE LONG" / "Setup C - BOUNCE SHORT"
Combined alerts:
- "ANY LONG" — fires on any long signal
- "ANY SHORT" — fires on any short signal
Recommended alert setup:
- Create "Setup B - DIV LONG" and "Setup B - DIV SHORT" alerts
- These are the highest probability signals
- Set "Once Per Bar Close" to avoid false alerts
═══════════════════════════════════════════════════════════════════
VISUALIZATION SETTINGS
Show Labels on Chart:
Toggle on/off the signal labels (green/red)
Disable for cleaner chart once you're familiar with the indicator
Show Higher TF STC:
Toggle the orange dots showing higher timeframe STC
Useful for visual confirmation of multi-timeframe alignment
Info Panel:
Cannot be disabled — always shows current status
Positioned top-right to avoid chart interference
═══════════════════════════════════════════════════════════════════
EXAMPLE TRADE WALKTHROUGH
SETUP B DIVERGENCE LONG EXAMPLE:
1. Market Context:
- Price in downtrend, below 50 EMA
- Multiple lower lows forming
- STC below 25 (oversold)
2. Divergence Formation:
- Price makes new low at $45.20
- Force Index refuses to make new low (higher low forms)
- This indicates selling pressure weakening
3. Signal Trigger:
- STC starts turning up
- Force Index crosses above zero
- Label appears: "LONG B DIV"
4. Trade Execution:
- Entry: $45.50 (current price at signal)
- Stop Loss: $44.80 (below divergence low)
- Target 1: $47.90 (STC reaches 75) — risk/reward 1:3.4
- Target 2: Opposite signal or trail stop
5. Trade Management:
- Price rallies to $47.20
- STC reaches 68 (approaching target zone)
- Take 50% profit, move stop to breakeven
- Exit remaining at $48.10 when STC crosses 75
Result: 3.7R gain
═══════════════════════════════════════════════════════════════════
ADVANCED TIPS
1. MULTI-TIMEFRAME CONFLUENCE
For highest probability trades, wait for:
- Primary TF signal
- Higher TF STC aligned (>25 for longs, <75 for shorts)
- Even higher TF trend in same direction (manual check)
2. VOLUME CONFIRMATION
Watch the Force Index histogram:
- Increasing bar size = Strengthening momentum
- Decreasing bar size = Weakening momentum
- Use this to gauge signal strength
3. AVOID THESE MARKET CONDITIONS
- Major news events (Force Index becomes erratic)
- Market open first 30 minutes (volatility spikes)
- Low liquidity instruments (Force Index unreliable)
- Extreme trending days (wait for pullbacks)
4. COMBINE WITH SUPPORT/RESISTANCE
Best signals occur near:
- Key horizontal levels
- Fibonacci retracements
- Previous day's high/low
- Psychological round numbers
5. SESSION AWARENESS
- Asia session: Use lower timeframes, Setup C works well
- London session: Setup A and B both effective
- New York session: All setups work, highest volume
═══════════════════════════════════════════════════════════════════
INDICATOR WINDOWS LAYOUT
MAIN CHART:
- Price action
- 50 EMA (green/red)
- Signal labels
- Info panel
INDICATOR WINDOW:
- STC oscillator (blue line, 0-100 scale)
- Higher TF STC (orange dots, optional)
- Force Index histogram (green/red bars)
- Reference levels (25, 50, 75)
- Background zones (green oversold, red overbought)
═══════════════════════════════════════════════════════════════════
PERFORMANCE OPTIMIZATION
For best results:
Backtesting:
- Test on your specific instrument and timeframe
- Adjust STC parameters if win rate < 55%
- Record which setup works best for your market
Position Sizing:
- Risk 1-2% per trade
- Setup B can use 2% risk (higher win rate)
- Setup C should use 1% risk (lower win rate)
Trade Frequency:
- Setup B: 2-5 signals per week (be patient)
- Setup A: 5-10 signals per week
- Setup C: 10+ signals per week (scalping)
═══════════════════════════════════════════════════════════════════
CREDITS & REFERENCES
This indicator builds upon established technical analysis concepts:
Schaff Trend Cycle:
- Developed by Doug Schaff (1996)
- Original concept published in Technical Analysis of Stocks & Commodities
- Implementation based on standard STC formula
Force Index:
- Developed by Dr. Alexander Elder
- Described in "Trading for a Living" (1993)
- Classic volume-momentum indicator
The multi-timeframe integration, three-setup system, and specific
entry conditions are original contributions of this indicator.
═══════════════════════════════════════════════════════════════════
DISCLAIMER
This indicator is a technical analysis tool and does not guarantee profits.
Past performance is not indicative of future results. Always:
- Use proper risk management
- Test on demo account first
- Combine with fundamental analysis
- Never risk more than you can afford to lose
═══════════════════════════════════════════════════════════════════
SUPPORT & QUESTIONS
If you find this indicator helpful, please:
- Leave a like and comment
- Share your feedback and results
- Report any bugs or issues
For questions about usage or optimization for specific markets,
feel free to comment below.
═════════════════════════════════════════════════════════════

Luxy Momentum, Trend, Bias and Breakout Indicators V7
TABLE OF CONTENTS
This is Version 7 (V7) - the latest and most optimized release. If you are using any older versions (V6, V5, V4, V3, etc.), it is highly recommended to replace them with V7.
Why This Indicator is Different
Who Should Use This
Core Components Overview
The UT Bot Trading System
Understanding the Market Bias Table
Candlestick Pattern Recognition
Visual Tools and Features
How to Use the Indicator
Performance and Optimization
FAQ
---
### CREDITS & ATTRIBUTION
This indicator implements proven trading concepts using entirely original code developed specifically for this project.
### CONCEPTUAL FOUNDATIONS
• UT Bot ATR Trailing System
- Original concept by @QuantNomad: (search "UT-Bot-Strategy"
- Our version is a complete reimplementation with significant enhancements:
- Volume-weighted momentum adjustment
- Composite stop loss from multiple S/R layers
- Multi-filter confirmation system (swing, %, 2-bar, ZLSMA)
- Full integration with multi-timeframe bias table
- Visual audit trail with freeze-on-touch
- NOTE: No code was copied - this is a complete reimplementation with enhancements.
• Standard Technical Indicators (Public Domain Formulas):
- Supertrend: ATR-based trend calculation with custom gradient fills
- MACD: Gerald Appel's formula with separation filters
- RSI: J. Welles Wilder's formula with pullback zone logic
- ADX/DMI: Custom trend strength formula inspired by Wilder's directional movement concept, reimplemented with volume weighting and efficiency metrics
- ZLSMA: Zero-lag formula enhanced with Hull MA and momentum prediction
### Custom Implementations
- Trend Strength: Inspired by Wilder's ADX concept but using volume-weighted pressure calculation and efficiency metrics (not traditional +DI/-DI smoothing)
- All code implementations are original
### ORIGINAL FEATURES (70%+ of codebase)
- Multi-Timeframe Bias Table with live updates
- Risk Management System (R-multiple TPs, freeze-on-touch)
- Opening Range Breakout tracker with session management
- Composite Stop Loss calculator using 6+ S/R layers
- Performance optimization system (caching, conditional calcs)
- VIX Fear Index integration
- Previous Day High/Low auto-detection
- Candlestick pattern recognition with interactive tooltips
- Smart label and visual management
- All UI/UX design and table architecture
### DEVELOPMENT PROCESS
**AI Assistance:** This indicator was developed over 2+ months with AI assistance (ChatGPT/Claude) used for:
- Writing Pine Script code based on design specifications
- Optimizing performance and fixing bugs
- Ensuring Pine Script v6 compliance
- Generating documentation
**Author's Role:** All trading concepts, system design, feature selection, integration logic, and strategic decisions are original work by the author. The AI was a coding tool, not the system designer.
**Transparency:** We believe in full disclosure - this project demonstrates how AI can be used as a powerful development tool while maintaining creative and strategic ownership.
---
1. WHY THIS INDICATOR IS DIFFERENT
Most traders use multiple separate indicators on their charts, leading to cluttered screens, conflicting signals, and analysis paralysis. The Suite solves this by integrating proven technical tools into a single, cohesive system.
Key Advantages:
All-in-One Design: Instead of loading 5-10 separate indicators, you get everything in one optimized script. This reduces chart clutter and improves TradingView performance.
Multi-Timeframe Bias Table: Unlike standard indicators that only show the current timeframe, the Bias Table aggregates trend signals across multiple timeframes simultaneously. See at a glance whether 1m, 5m, 15m, 1h are aligned bullish or bearish - no more switching between charts.
Smart Confirmations: The indicator doesn't just give signals - it shows you WHY. Every entry has multiple layers of confirmation (MA cross, MACD momentum, ADX strength, RSI pullback, volume, etc.) that you can toggle on/off.
Dynamic Stop Loss System: Instead of static ATR stops, the SL is calculated from multiple support/resistance layers: UT trailing line, Supertrend, VWAP, swing structure, and MA levels. This creates more intelligent, price-action-aware stops.
R-Multiple Take Profits: Built-in TP system calculates targets based on your initial risk (1R, 1.5R, 2R, 3R). Lines freeze when touched with visual checkmarks, giving you a clean audit trail of partial exits.
Educational Tooltips Everywhere: Every single input has detailed tooltips explaining what it does, typical values, and how it impacts trading. You're not guessing - you're learning as you configure.
Performance Optimized: Smart caching, conditional calculations, and modular design mean the indicator runs fast despite having 15+ features. Turn off what you don't use for even better performance.
No Repainting: All signals respect bar close. Alerts fire correctly. What you see in history is what you would have gotten in real-time.
What Makes It Unique:
Integrated UT Bot + Bias Table: No other indicator combines UT Bot's ATR trailing system with a live multi-timeframe dashboard. You get precision entries with macro trend context.
Candlestick Pattern Recognition with Interactive Tooltips: Patterns aren't just marked - hover over any emoji for a full explanation of what the pattern means and how to trade it.
Opening Range Breakout Tracker: Built-in ORB system for intraday traders with customizable session times and real-time status updates in the Bias Table.
Previous Day High/Low Auto-Detection: Automatically plots PDH/PDL on intraday charts with theme-aware colors. Updates daily without manual input.
Dynamic Row Labels in Bias Table: The table shows your actual settings (e.g., "EMA 10 > SMA 20") not generic labels. You know exactly what's being evaluated.
Modular Filter System: Instead of forcing a fixed methodology, the indicator lets you build your own strategy. Start with just UT Bot, add filters one at a time, test what works for your style.
---
2. WHO WHOULD USE THIS
Designed For:
Intermediate to Advanced Traders: You understand basic technical analysis (MAs, RSI, MACD) and want to combine multiple confirmations efficiently. This isn't a "one-click profit" system - it's a professional toolkit.
Multi-Timeframe Traders: If you trade one asset but check multiple timeframes for confirmation (e.g., enter on 5m after checking 15m and 1h alignment), the Bias Table will save you hours every week.
Trend Followers: The indicator excels at identifying and following trends using UT Bot, Supertrend, and MA systems. If you trade breakouts and pullbacks in trending markets, this is built for you.
Intraday and Swing Traders: Works equally well on 5m-1h charts (day trading) and 4h-D charts (swing trading). Scalpers can use it too with appropriate settings adjustments.
Discretionary Traders: This isn't a black-box system. You see all the components, understand the logic, and make final decisions. Perfect for traders who want tools, not automation.
Works Across All Markets:
Stocks (US, international)
Cryptocurrency (24/7 markets supported)
Forex pairs
Indices (SPY, QQQ, etc.)
Commodities
NOT Ideal For :
Complete Beginners: If you don't know what a moving average or RSI is, start with basics first. This indicator assumes foundational knowledge.
Algo Traders Seeking Black Box: This is discretionary. Signals require context and confirmation. Not suitable for blind automated execution.
Mean-Reversion Only Traders: The indicator is trend-following at its core. While VWAP bands support mean-reversion, the primary methodology is trend continuation.
---
3. CORE COMPONENTS OVERVIEW
The indicator combines these proven systems:
Trend Analysis:
Moving Averages: Four customizable MAs (Fast, Medium, Medium-Long, Long) with six types to choose from (EMA, SMA, WMA, VWMA, RMA, HMA). Mix and match for your style.
Supertrend: ATR-based trend indicator with unique gradient fill showing trend strength. One-sided ribbon visualization makes it easier to see momentum building or fading.
ZLSMA : Zero-lag linear-regression smoothed moving average. Reduces lag compared to traditional MAs while maintaining smooth curves.
Momentum & Filters:
MACD: Standard MACD with separation filter to avoid weak crossovers.
RSI: Pullback zone detection - only enter longs when RSI is in your defined "buy zone" and shorts in "sell zone".
ADX/DMI: Trend strength measurement with directional filter. Ensures you only trade when there's actual momentum.
Volume Filter: Relative volume confirmation - require above-average volume for entries.
Donchian Breakout: Optional channel breakout requirement.
Signal Systems:
UT Bot: The primary signal generator. ATR trailing stop that adapts to volatility and gives clear entry/exit points.
Base Signals: MA cross system with all the above filters applied. More conservative than UT Bot alone.
Market Bias Table: Multi-timeframe dashboard showing trend alignment across 7 timeframes plus macro bias (3-day, weekly, monthly, quarterly, VIX).
Candlestick Patterns: Six major reversal patterns auto-detected with interactive tooltips.
ORB Tracker: Opening range high/low with breakout status (intraday only).
PDH/PDL: Previous day levels plotted automatically on intraday charts.
VWAP + Bands : Session-anchored VWAP with up to three standard deviation band pairs.
---
4. THE UT BOT TRADING SYSTEM
The UT Bot is the heart of the indicator's signal generation. It's an advanced ATR trailing stop that adapts to market volatility.
Why UT Bot is Superior to Fixed Stops:
Traditional ATR stops use a fixed multiplier (e.g., "stop = entry - 2×ATR"). UT Bot is smarter:
It TRAILS the stop as price moves in your favor
It WIDENS during high volatility to avoid premature stops
It TIGHTENS during consolidation to lock in profits
It FLIPS when price breaks the trailing line, signaling reversals
Visual Elements You'll See:
Orange Trailing Line: The actual UT stop level that adapts bar-by-bar
Buy/Sell Labels: Aqua triangle (long) or orange triangle (short) when the line flips
ENTRY Line: Horizontal line at your entry price (optional, can be turned off)
Suggested Stop Loss: A composite SL calculated from multiple support/resistance layers:
- UT trailing line
- Supertrend level
- VWAP
- Swing structure (recent lows/highs)
- Long-term MA (200)
- ATR-based floor
Take Profit Lines: TP1, TP1.5, TP2, TP3 based on R-multiples. When price touches a TP, it's marked with a checkmark and the line freezes for audit trail purposes.
Status Messages: "SL Touched ❌" or "SL Frozen" when the trade leg completes.
How UT Bot Differs from Other ATR Systems:
Multiple Filters Available: You can require 2-bar confirmation, minimum % price change, swing structure alignment, or ZLSMA directional filter. Most UT implementations have none of these.
Smart SL Calculation: Instead of just using the UT line as your stop, the indicator suggests a better SL based on actual support/resistance. This prevents getting stopped out by wicks while keeping risk controlled.
Visual Audit Trail: All SL/TP lines freeze when touched with clear markers. You can review your trades weeks later and see exactly where entries, stops, and targets were.
Performance Options: "Draw UT visuals only on bar close" lets you reduce rendering load without affecting logic or alerts - critical for slower machines or 1m charts.
Trading Logic:
UT Bot flips direction (Buy or Sell signal appears)
Check Bias Table for multi-timeframe confirmation
Optional: Wait for Base signal or candlestick pattern
Enter at signal bar close or next bar open
Place stop at "Suggested Stop Loss" line
Scale out at TP levels (TP1, TP2, TP3)
Exit remaining position on opposite UT signal or stop hit
---
5. UNDERSTANDING THE MARKET BIAS TABLE
This is the indicator's unique multi-timeframe intelligence layer. Instead of looking at one chart at a time, the table aggregates signals across seven timeframes plus macro trend bias.
Why Multi-Timeframe Analysis Matters:
Professional traders check higher and lower timeframes for context:
Is the 1h uptrend aligning with my 5m entry?
Are all short-term timeframes bullish or just one?
Is the daily trend supportive or fighting me?
Doing this manually means opening multiple charts, checking each indicator, and making mental notes. The Bias Table does it automatically in one glance.
Table Structure:
Header Row:
On intraday charts: 1m, 5m, 15m, 30m, 1h, 2h, 4h (toggle which ones you want)
On daily+ charts: D, W, M (automatic)
Green dot next to title = live updating
Headline Rows - Macro Bias:
These show broad market direction over longer periods:
3 Day Bias: Trend over last 3 trading sessions (uses 1h data)
Weekly Bias: Trend over last 5 trading sessions (uses 4h data)
Monthly Bias: Trend over last 30 daily bars
Quarterly Bias: Trend over last 13 weekly bars
VIX Fear Index: Market regime based on VIX level - bullish when low, bearish when high
Opening Range Breakout: Status of price vs. session open range (intraday only)
These rows show text: "BULLISH", "BEARISH", or "NEUTRAL"
Indicator Rows - Technical Signals:
These evaluate your configured indicators across all active timeframes:
Fast MA > Medium MA (shows your actual MA settings, e.g., "EMA 10 > SMA 20")
Price > Long MA (e.g., "Price > SMA 200")
Price > VWAP
MACD > Signal
Supertrend (up/down/neutral)
ZLSMA Rising
RSI In Zone
ADX ≥ Minimum
These rows show emojis: GREEB (bullish), RED (bearish), GRAY/YELLOW (neutral/NA)
AVG Column:
Shows percentage of active timeframes that are bullish for that row. This is the KEY metric:
AVG > 70% = strong multi-timeframe bullish alignment
AVG 40-60% = mixed/choppy, no clear trend
AVG < 30% = strong multi-timeframe bearish alignment
How to Use the Table:
For a long trade:
Check AVG column - want to see > 60% ideally
Check headline bias rows - want to see BULLISH, not BEARISH
Check VIX row - bullish market regime preferred
Check ORB row (intraday) - want ABOVE for longs
Scan indicator rows - more green = better confirmation
For a short trade:
Check AVG column - want to see < 40% ideally
Check headline bias rows - want to see BEARISH, not BULLISH
Check VIX row - bearish market regime preferred
Check ORB row (intraday) - want BELOW for shorts
Scan indicator rows - more red = better confirmation
When AVG is 40-60%:
Market is choppy, mixed signals. Either stay out or reduce position size significantly. These are low-probability environments.
Unique Features:
Dynamic Labels: Row names show your actual settings (e.g., "EMA 10 > SMA 20" not generic "Fast > Slow"). You know exactly what's being evaluated.
Customizable Rows: Turn off rows you don't care about. Only show what matters to your strategy.
Customizable Timeframes: On intraday charts, disable 1m or 4h if you don't trade them. Reduces calculation load by 20-40%.
Automatic HTF Handling: On Daily/Weekly/Monthly charts, the table automatically switches to D/W/M columns. No configuration needed.
Performance Smart: "Hide BIAS table on 1D or above" option completely skips all table calculations on higher timeframes if you only trade intraday.
---
6. CANDLESTICK PATTERN RECOGNITION
The indicator automatically detects six major reversal patterns and marks them with emojis at the relevant bars.
Why These Six Patterns:
These are the most statistically significant reversal patterns according to trading literature:
High win rate when appearing at support/resistance
Clear visual structure (not subjective)
Work across all timeframes and assets
Studied extensively by institutions
The Patterns:
Bullish Patterns (appear at bottoms):
Bullish Engulfing: Green candle completely engulfs prior red candle's body. Strong reversal signal.
Hammer: Small body with long lower wick (at least 2× body size). Shows rejection of lower prices by buyers.
Morning Star: Three-candle pattern (large red → small indecision → large green). Very strong bottom reversal.
Bearish Patterns (appear at tops):
Bearish Engulfing: Red candle completely engulfs prior green candle's body. Strong reversal signal.
Shooting Star: Small body with long upper wick (at least 2× body size). Shows rejection of higher prices by sellers.
Evening Star: Three-candle pattern (large green → small indecision → large red). Very strong top reversal.
Interactive Tooltips:
Unlike most pattern indicators that just draw shapes, this one is educational:
Hover your mouse over any pattern emoji
A tooltip appears explaining: what the pattern is, what it means, when it's most reliable, and how to trade it
No need to memorize - learn as you trade
Noise Filter:
"Min candle body % to filter noise" setting prevents false signals:
Patterns require minimum body size relative to price
Filters out tiny candles that don't represent real buying/selling pressure
Adjust based on asset volatility (higher % for crypto, lower for low-volatility stocks)
How to Trade Patterns:
Patterns are NOT standalone entry signals. Use them as:
Confirmation: UT Bot gives signal + pattern appears = stronger entry
Reversal Warning: In a trade, opposite pattern appears = consider tightening stop or taking profit
Support/Resistance Validation: Pattern at key level (PDH, VWAP, MA 200) = level is being respected
Best combined with:
UT Bot or Base signal in same direction
Bias Table alignment (AVG > 60% or < 40%)
Appearance at obvious support/resistance
---
7. VISUAL TOOLS AND FEATURES
VWAP (Volume Weighted Average Price):
Session-anchored VWAP with standard deviation bands. Shows institutional "fair value" for the trading session.
Anchor Options: Session, Day, Week, Month, Quarter, Year. Choose based on your trading timeframe.
Bands: Up to three pairs (X1, X2, X3) showing statistical deviation. Price at outer bands often reverses.
Auto-Hide on HTF: VWAP hides on Daily/Weekly/Monthly charts automatically unless you enable anchored mode.
Use VWAP as:
Directional bias (above = bullish, below = bearish)
Mean reversion levels (outer bands)
Support/resistance (the VWAP line itself)
Previous Day High/Low:
Automatically plots yesterday's high and low on intraday charts:
Updates at start of each new trading day
Theme-aware colors (dark text for light charts, light text for dark charts)
Hidden automatically on Daily/Weekly/Monthly charts
These levels are critical for intraday traders - institutions watch them closely as support/resistance.
Opening Range Breakout (ORB):
Tracks the high/low of the first 5, 15, 30, or 60 minutes of the trading session:
Customizable session times (preset for NYSE, LSE, TSE, or custom)
Shows current breakout status in Bias Table row (ABOVE, BELOW, INSIDE, BUILDING)
Intraday only - auto-disabled on Daily+ charts
ORB is a classic day trading strategy - breakout above opening range often leads to continuation.
Extra Labels:
Change from Open %: Shows how far price has moved from session open (intraday) or daily open (HTF). Green if positive, red if negative.
ADX Badge: Small label at bottom of last bar showing current ADX value. Green when above your minimum threshold, red when below.
RSI Badge: Small label at top of last bar showing current RSI value with zone status (buy zone, sell zone, or neutral).
These labels provide quick at-a-glance confirmation without needing separate indicator windows.
---
8. HOW TO USE THE INDICATOR
Step 1: Add to Chart
Load the indicator on your chosen asset and timeframe
First time: Everything is enabled by default - the chart will look busy
Don't panic - you'll turn off what you don't need
Step 2: Start Simple
Turn OFF everything except:
UT Bot labels (keep these ON)
Bias Table (keep this ON)
Moving Averages (Fast and Medium only)
Suggested Stop Loss and Take Profits
Hide everything else initially. Get comfortable with the basic UT Bot + Bias Table workflow first.
Step 3: Learn the Core Workflow
UT Bot gives a Buy or Sell signal
Check Bias Table AVG column - do you have multi-timeframe alignment?
If yes, enter the trade
Place stop at Suggested Stop Loss line
Scale out at TP levels
Exit on opposite UT signal
Trade this simple system for a week. Get a feel for signal frequency and win rate with your settings.
Step 4: Add Filters Gradually
If you're getting too many losing signals (whipsaws in choppy markets), add filters one at a time:
Try: "Require 2-Bar Trend Confirmation" - wait for 2 bars to confirm direction
Try: ADX filter with minimum threshold - only trade when trend strength is sufficient
Try: RSI pullback filter - only enter on pullbacks, not chasing
Try: Volume filter - require above-average volume
Add one filter, test for a week, evaluate. Repeat.
Step 5: Enable Advanced Features (Optional)
Once you're profitable with the core system, add:
Supertrend for additional trend confirmation
Candlestick patterns for reversal warnings
VWAP for institutional anchor reference
ORB for intraday breakout context
ZLSMA for low-lag trend following
Step 6: Optimize Settings
Every setting has a detailed tooltip explaining what it does and typical values. Hover over any input to read:
What the parameter controls
How it impacts trading
Suggested ranges for scalping, day trading, and swing trading
Start with defaults, then adjust based on your results and style.
Step 7: Set Up Alerts
Right-click chart → Add Alert → Condition: "Luxy Momentum v6" → Choose:
"UT Bot — Buy" for long entries
"UT Bot — Sell" for short entries
"Base Long/Short" for filtered MA cross signals
Optionally enable "Send real-time alert() on UT flip" in settings for immediate notifications.
Common Workflow Variations:
Conservative Trader:
UT signal + Base signal + Candlestick pattern + Bias AVG > 70%
Enter only at major support/resistance
Wider UT sensitivity, multiple filters
Aggressive Trader:
UT signal + Bias AVG > 60%
Enter immediately, no waiting
Tighter UT sensitivity, minimal filters
Swing Trader:
Focus on Daily/Weekly Bias alignment
Ignore intraday noise
Use ORB and PDH/PDL less (or not at all)
Wider stops, patient approach
---
9. PERFORMANCE AND OPTIMIZATION
The indicator is optimized for speed, but with 15+ features running simultaneously, chart load time can add up. Here's how to keep it fast:
Biggest Performance Gains:
Disable Unused Timeframes: In "Time Frames" settings, turn OFF any timeframe you don't actively trade. Each disabled TF saves 10-15% calculation time. If you only day trade 5m, 15m, 1h, disable 1m, 2h, 4h.
Hide Bias Table on Daily+: If you only trade intraday, enable "Hide BIAS table on 1D or above". This skips ALL table calculations on higher timeframes.
Draw UT Visuals Only on Bar Close: Reduces intrabar rendering of SL/TP/Entry lines. Has ZERO impact on logic or alerts - purely visual optimization.
Additional Optimizations:
Turn off VWAP bands if you don't use them
Disable candlestick patterns if you don't trade them
Turn off Supertrend fill if you find it distracting (keep the line)
Reduce "Limit to 10 bars" for SL/TP lines to minimize line objects
Performance Features Built-In:
Smart Caching: Higher timeframe data (3-day bias, weekly bias, etc.) updates once per day, not every bar
Conditional Calculations: Volume filter only calculates when enabled. Swing filter only runs when enabled. Nothing computes if turned off.
Modular Design: Every component is independent. Turn off what you don't need without breaking other features.
Typical Load Times:
5m chart, all features ON, 7 timeframes: ~2-3 seconds
5m chart, core features only, 3 timeframes: ~1 second
1m chart, all features: ~4-5 seconds (many bars to calculate)
If loading takes longer, you likely have too many indicators on the chart total (not just this one).
---
10. FAQ
Q: How is this different from standard UT Bot indicators?
A: Standard UT Bot (originally by @QuantNomad) is just the ATR trailing line and flip signals. This implementation adds:
- Volume weighting and momentum adjustment to the trailing calculation
- Multiple confirmation filters (swing, %, 2-bar, ZLSMA)
- Smart composite stop loss system from multiple S/R layers
- R-multiple take profit system with freeze-on-touch
- Integration with multi-timeframe Bias Table
- Visual audit trail with checkmarks
Q: Can I use this for automated trading?
A: The indicator is designed for discretionary trading. While it has clear signals and alerts, it's not a mechanical system. Context and judgment are required.
Q: Does it repaint?
A: No. All signals respect bar close. UT Bot logic runs intrabar but signals only trigger on confirmed bars. Alerts fire correctly with no lookahead.
Q: Do I need to use all the features?
A: Absolutely not. The indicator is modular. Many profitable traders use just UT Bot + Bias Table + Moving Averages. Start simple, add complexity only if needed.
Q: How do I know which settings to use?
A: Every single input has a detailed tooltip. Hover over any setting to see:
What it does
How it affects trading
Typical values for scalping, day trading, swing trading
Start with defaults, adjust gradually based on results.
Q: Can I use this on crypto 24/7 markets?
A: Yes. ORB will not work (no defined session), but everything else functions normally. Use "Day" anchor for VWAP instead of "Session".
Q: The Bias Table is blank or not showing.
A: Check:
"Show Table" is ON
Table position isn't overlapping another indicator's table (change position)
At least one row is enabled
"Hide BIAS table on 1D or above" is OFF (if on Daily+ chart)
Q: Why are candlestick patterns not appearing?
A: Patterns are relatively rare by design - they only appear at genuine reversal points. Check:
Pattern toggles are ON
"Min candle body %" isn't too high (try 0.05-0.10)
You're looking at a chart with actual reversals (not strong trending market)
Q: UT Bot is too sensitive/not sensitive enough.
A: Adjust "Sensitivity (Key×ATR)". Lower number = tighter stop, more signals. Higher number = wider stop, fewer signals. Read the tooltip for guidance.
Q: Can I get alerts for the Bias Table?
A: The Bias Table is a dashboard for visual analysis, not a signal generator. Set alerts on UT Bot or Base signals, then manually check Bias Table for confirmation.
Q: Does this work on stocks with low volume?
A: Yes, but turn OFF the volume filter. Low volume stocks will never meet relative volume requirements.
Q: How often should I check the Bias Table?
A: Before every entry. It takes 2 seconds to glance at the AVG column and headline rows. This one check can save you from fighting the trend.
Q: What if UT signal and Base signal disagree?
A: UT Bot is more aggressive (ATR trailing). Base signals are more conservative (MA cross + filters). If they disagree, either:
Wait for both to align (safest)
Take the UT signal but with smaller size (aggressive)
Skip the trade (conservative)
There's no "right" answer - depends on your risk tolerance.
---
FINAL NOTES
The indicator gives you an edge. How you use that edge determines results.
For questions, feedback, or support, comment on the indicator page or message the author.
Happy Trading!

cd_VWAP_mtg_CxCd_VWAP_mtg_Cx
Overview
The most important condition for being successful and profitable in the market is to consistently follow the same rules without compromise, while the price constantly moves in countless different ways.
Regardless of the concept or trading school, those who have rules win.
In this indicator, we will define and use three main sections to set and apply our rules.
The indicator uses the VWAP (Volume Weighted Average Price) — price weighted by volume.
Two VWAPs can be displayed either by manually entering date and time, or by selecting from the menu.
From the menu, you can select the following reference levels:
• HTF Open: Opening candle of the higher timeframe
• ATH / ATL: All-Time High / All-Time Low candles
• PMH / PML, PWH / PWL, PDH / PDL, PH4H / PH4L: Previous Month, Week, Day, or H4 Highs/Lows
• MH / ML, WH / WL, DH / DL, H4H / H4L: Current Month, Week, Day, or H4 Highs/Lows
Additionally, it includes:
• Mitigation / Order Block zones (local buyer-seller balance) across two timeframes.
• Buy/Sell Side Liquidity levels (BSL / SSL) from the aligned higher timeframe (target levels).
________________________________________
Components and Usage
1 – VWAP
Calculated using the classical method:
• High + Volume for the upper value
• Close + Volume for the middle value
• Low + Volume for the lower value
The VWAP is displayed as a colored band, where the coloring represents the bias.
Let’s call this band FVB (Fair Value Band) for ease of explanation.
The FVB represents the final line of defense, the buyer/seller boundary, and in technical terms, it can be viewed as premium/discount zones or support/resistance levels.
Within this critical area, the strong side continues its move, while the weaker side is forced to retreat.
But does the side that breaks beyond the band always keep going?
We all know that’s not always the case — in different pairs and timeframes, price often violates both the upper and lower edges multiple times.
To achieve more consistent analysis, we’ll define a new set of rules.
________________________________________
2 – Mitigation / Order Blocks
In trading literature, there are dozens of different definitions and uses of mitigation or order blocks.
Here, we will interpret the candlesticks to create our own definition, and we’ll use the zones defined by candles that fit this pattern.
For simplicity, let’s abbreviate mitigation as “mtg.”
For a candle to be selected as an mtg, it must clearly show strength from one side (buyers or sellers) — which can also be observed visually on the chart.
________________________________________
Bullish mtg criteria:
1. The first candle must be bullish (close > open) → buyers are strong.
2. The next candle makes a new high (buyers push higher) but fails to close above and pulls back to close inside the previous range → sellers react.
It also must not break the previous low → buyers defend.
3. In the following candle(s), as long as the first candle’s low is protected and the second candle’s high is broken, it indicates buyer strength → a bullish mtg is confirmed.
When price returns to this zone later (gets mitigated), the expectation is that the zone holds and price pushes upward again.
If the low is violated, the mtg becomes invalid.
In technical terms:
If the previous candle’s high is broken but no close occurs above it, the expectation is a reversal move that will retest its low.
Question:
What if the low is protected and in the next candle(s) a new high forms?
Answer: → Bullish mtg.
Bearish mtg (opposite)
3 – Buy/Sell Side Liquidity Levels
With the help of the aligned higher timeframe (swing points), we will define our market structure framework and set our liquidity targets accordingly.
Let’s put the pieces together.
If we continue explaining from a trade-focused perspective, our first priority should be our bias — our projection or expectation of the market’s potential movement.
We will determine this bias using the FVB.
Since we know the band often gets violated on both sides, we want the price action to convince us of its strength.
To do that, we’ll use the first candle that closes beyond the band.
The distance from that candle’s high to low will be our threshold range
Bullish level = high + (candle length × coefficient)
Bearish level = low - (candle length × coefficient)
When the price closes beyond this threshold, it demonstrates strength, and our bias will now align in that direction.
How long will this bias remain valid?
→ Until a closing candle appears on the opposite side of the band.
If a close occurs on the opposite side, then a new bias will only be confirmed once the new threshold level is broken.
During the period in between, we have no bias.
Let’s continue on the chart:
Now that our bias has been established, where and how do we look for trade opportunities?
There are two possible entry approaches:
• Aggressive entry: Enter immediately with the breakout.
• Conservative entry: Wait for a pullback and enter once a suitable structure forms.
(The choice depends on the user’s preference.)
At this stage, the user can apply their own entry model. Let’s give an example:
Let’s assume we’re looking for setups using HTF sweep + LTF CISD confirmation.
Once our bias turns bearish, we look for an HTF sweep forming on or near an FVB or mtg block, and then confirm the entry with a CISD signal.
In summary:
• FVB defines the bias, the entry zone, and the target zone.
• Mtg blocks represent entry zones.
• BSL / SSL levels suggest target zones.
Overlapping FVB and mtg blocks are expected to be more effective.
The indicator also provides an option for a second FVB.
A band attached to a lower timeframe can be used as confirmation.
• Main band: Bias + FVB
• Extra band: Entry trigger confirmed by a close beyond it.
Mtg blocks can provide trade entry opportunities, especially when the price is moving strongly in one direction (flow).
Consecutive or complementary mtg blocks indicate that the price is decisive in one direction, while sometimes also showing areas where we should wait before entering.
Mtg blocks that contain an FVG (Fair Value Gap) within their body are expected to be more effective.
Settings:
The default values are set to 1-3-5m, optimized for scalping trades.
VWAP settings:
Main VWAP (FVB):
• Can be set by selecting a start time, manually entering date and time, or choosing a predefined level.
Extra VWAP (FVB):
• Set from the menu. If not needed, select “none.”
• Visibility, color, and fill settings for VWAP are located here.
• Threshold levels visibility and color options are also in this section.
• The multiplier is used for calculating the threshold level.
Important:
• If the Extra VWAP is selected but not displayed, you need to increase the chart timeframe.
o Example: If the chart is on 3m and you select WH from the extra options, it will not display correctly.
• Upper limits for VWAP:
o 1m and 3m charts: daily High/Low
o 5m chart: weekly High/Low
________________________________________
Mtg Settings:
• Visibility and color settings for blocks are configured here.
• To display on a second timeframe, the box must be checked and the timeframe specified.
• Optional display modes: “only active blocks,” “only last violated mtg,” or “all.”
• For confirmation and removal criteria, choosing high/low or close determines the source used for mtg block formation and deletion conditions.
BSL/SSL Settings:
• Visibility, color, font size, and line style can be configured in this section.
When “Auto” is selected, the aligned timeframe is determined automatically by the indicator, while in manual mode, the user defines the timeframe.
Final Words:
Simply opening trades every time the price touches the VWAP or mtg blocks will not make you a profitable trader. Searching for setups with similar structures while maintaining proper risk management will yield better results in the long run.
I would be happy to hear your feedback and suggestions.
Happy trading!

Trend Gauge [BullByte]Trend Gauge
Summary
A multi-factor trend detection indicator that aggregates EMA alignment, VWMA momentum scaling, volume spikes, ATR breakout strength, higher-timeframe confirmation, ADX-based regime filtering, and RSI pivot-divergence penalty into one normalized trend score. It also provides a confidence meter, a Δ Score momentum histogram, divergence highlights, and a compact, scalable dashboard for at-a-glance status.
________________________________________
## 1. Purpose of the Indicator
Why this was built
Traders often monitor several indicators in parallel - EMAs, volume signals, volatility breakouts, higher-timeframe trends, ADX readings, divergence alerts, etc., which can be cumbersome and sometimes contradictory. The “Trend Gauge” indicator was created to consolidate these complementary checks into a single, normalized score that reflects the prevailing market bias (bullish, bearish, or neutral) and its strength. By combining multiple inputs with an adaptive regime filter, scaling contributions by magnitude, and penalizing weakening signals (divergence), this tool aims to reduce noise, highlight genuine trend opportunities, and warn when momentum fades.
Key Design Goals
Signal Aggregation
Merged trend-following signals (EMA crossover, ATR breakout, higher-timeframe confirmation) and momentum signals (VWMA thrust, volume spikes) into a unified score that reflects directional bias more holistically.
Market Regime Awareness
Implemented an ADX-style filter to distinguish between trending and ranging markets, reducing the influence of trend signals during sideways phases to avoid false breakouts.
Magnitude-Based Scaling
Replaced binary contributions with scaled inputs: VWMA thrust and ATR breakout are weighted relative to recent averages, allowing for more nuanced score adjustments based on signal strength.
Momentum Divergence Penalty
Integrated pivot-based RSI divergence detection to slightly reduce the overall score when early signs of momentum weakening are detected, improving risk-awareness in entries.
Confidence Transparency
Added a live confidence metric that shows what percentage of enabled sub-indicators currently agree with the overall bias, making the scoring system more interpretable.
Momentum Acceleration Visualization
Plotted the change in score (Δ Score) as a histogram bar-to-bar, highlighting whether momentum is increasing, flattening, or reversing, aiding in more timely decision-making.
Compact Informational Dashboard
Presented a clean, scalable dashboard that displays each component’s status, the final score, confidence %, detected regime (Trending/Ranging), and a labeled strength gauge for quick visual assessment.
________________________________________
## 2. Why a Trader Should Use It
Main benefits and use cases
1. Unified View: Rather than juggling multiple windows or panels, this indicator delivers a single score synthesizing diverse signals.
2. Regime Filtering: In ranging markets, trend signals often generate false entries. The ADX-based regime filter automatically down-weights trend-following components, helping you avoid chasing false breakouts.
3. Nuanced Momentum & Volatility: VWMA and ATR breakout contributions are normalized by recent averages, so strong moves register strongly while smaller fluctuations are de-emphasized.
4. Early Warning of Weakening: Pivot-based RSI divergence is detected and used to slightly reduce the score when price/momentum diverges, giving a cautionary signal before a full reversal.
5. Confidence Meter: See at a glance how many sub-indicators align with the aggregated bias (e.g., “80% confidence” means 4 out of 5 components agree ). This transparency avoids black-box decisions.
6. Trend Acceleration/Deceleration View: The Δ Score histogram visualizes whether the aggregated score is rising (accelerating trend) or falling (momentum fading), supplementing the main oscillator.
7. Compact Dashboard: A corner table lists each check’s status (“Bull”, “Bear”, “Flat” or “Disabled”), plus overall Score, Confidence %, Regime, Trend Strength label, and a gauge bar. Users can scale text size (Normal, Small, Tiny) without removing elements, so the full picture remains visible even in compact layouts.
8. Customizable & Transparent: All components can be enabled/disabled and parameterized (lengths, thresholds, weights). The full Pine code is open and well-commented, letting users inspect or adapt the logic.
9. Alert-ready: Built-in alert conditions fire when the score crosses weak thresholds to bullish/bearish or returns to neutral, enabling timely notifications.
________________________________________
## 3. Component Rationale (“Why These Specific Indicators?”)
Each sub-component was chosen because it adds complementary information about trend or momentum:
1. EMA Cross
o Basic trend measure: compares a faster EMA vs. a slower EMA. Quickly reflects trend shifts but by itself can whipsaw in sideways markets.
2. VWMA Momentum
o Volume-weighted moving average change indicates momentum with volume context. By normalizing (dividing by a recent average absolute change), we capture the strength of momentum relative to recent history. This scaling prevents tiny moves from dominating and highlights genuinely strong momentum.
3. Volume Spikes
o Sudden jumps in volume combined with price movement often accompany stronger moves or reversals. A binary detection (+1 for bullish spike, -1 for bearish spike) flags high-conviction bars.
4. ATR Breakout
o Detects price breaking beyond recent highs/lows by a multiple of ATR. Measures breakout strength by how far beyond the threshold price moves relative to ATR, capped to avoid extreme outliers. This gives a volatility-contextual trend signal.
5. Higher-Timeframe EMA Alignment
o Confirms whether the shorter-term trend aligns with a higher timeframe trend. Uses request.security with lookahead_off to avoid future data. When multiple timeframes agree, confidence in direction increases.
6. ADX Regime Filter (Manual Calculation)
o Computes directional movement (+DM/–DM), smoothes via RMA, computes DI+ and DI–, then a DX and ADX-like value. If ADX ≥ threshold, market is “Trending” and trend components carry full weight; if ADX < threshold, “Ranging” mode applies a configurable weight multiplier (e.g., 0.5) to trend-based contributions, reducing false signals in sideways conditions. Volume spikes remain binary (optional behavior; can be adjusted if desired).
7. RSI Pivot-Divergence Penalty
o Uses ta.pivothigh / ta.pivotlow with a lookback to detect pivot highs/lows on price and corresponding RSI values. When price makes a higher high but RSI makes a lower high (bearish divergence), or price makes a lower low but RSI makes a higher low (bullish divergence), a divergence signal is set. Rather than flipping the trend outright, the indicator subtracts (or adds) a small penalty (configurable) from the aggregated score if it would weaken the current bias. This subtle adjustment warns of weakening momentum without overreacting to noise.
8. Confidence Meter
o Counts how many enabled components currently agree in direction with the aggregated score (i.e., component sign × score sign > 0). Displays this as a percentage. A high percentage indicates strong corroboration; a low percentage warns of mixed signals.
9. Δ Score Momentum View
o Plots the bar-to-bar change in the aggregated score (delta_score = score - score ) as a histogram. When positive, bars are drawn in green above zero; when negative, bars are drawn in red below zero. This reveals acceleration (rising Δ) or deceleration (falling Δ), supplementing the main oscillator.
10. Dashboard
• A table in the indicator pane’s top-right with 11 rows:
1. EMA Cross status
2. VWMA Momentum status
3. Volume Spike status
4. ATR Breakout status
5. Higher-Timeframe Trend status
6. Score (numeric)
7. Confidence %
8. Regime (“Trending” or “Ranging”)
9. Trend Strength label (e.g., “Weak Bullish Trend”, “Strong Bearish Trend”)
10. Gauge bar visually representing score magnitude
• All rows always present; size_opt (Normal, Small, Tiny) only changes text size via text_size, not which elements appear. This ensures full transparency.
________________________________________
## 4. What Makes This Indicator Stand Out
• Regime-Weighted Multi-Factor Score: Trend and momentum signals are adaptively weighted by market regime (trending vs. ranging) , reducing false signals.
• Magnitude Scaling: VWMA and ATR breakout contributions are normalized by recent average momentum or ATR, giving finer gradation compared to simple ±1.
• Integrated Divergence Penalty: Divergence directly adjusts the aggregated score rather than appearing as a separate subplot; this influences alerts and trend labeling in real time.
• Confidence Meter: Shows the percentage of sub-signals in agreement, providing transparency and preventing blind trust in a single metric.
• Δ Score Histogram Momentum View: A histogram highlights acceleration or deceleration of the aggregated trend score, helping detect shifts early.
• Flexible Dashboard: Always-visible component statuses and summary metrics in one place; text size scaling keeps the full picture available in cramped layouts.
• Lookahead-Safe HTF Confirmation: Uses lookahead_off so no future data is accessed from higher timeframes, avoiding repaint bias.
• Repaint Transparency: Divergence detection uses pivot functions that inherently confirm only after lookback bars; description documents this lag so users understand how and when divergence labels appear.
• Open-Source & Educational: Full, well-commented Pine v6 code is provided; users can learn from its structure: manual ADX computation, conditional plotting with series = show ? value : na, efficient use of table.new in barstate.islast, and grouped inputs with tooltips.
• Compliance-Conscious: All plots have descriptive titles; inputs use clear names; no unnamed generic “Plot” entries; manual ADX uses RMA; all request.security calls use lookahead_off. Code comments mention repaint behavior and limitations.
________________________________________
## 5. Recommended Timeframes & Tuning
• Any Timeframe: The indicator works on small (e.g., 1m) to large (daily, weekly) timeframes. However:
o On very low timeframes (<1m or tick charts), noise may produce frequent whipsaws. Consider increasing smoothing lengths, disabling certain components (e.g., volume spike if volume data noisy), or using a larger pivot lookback for divergence.
o On higher timeframes (daily, weekly), consider longer lookbacks for ATR breakout or divergence, and set Higher-Timeframe trend appropriately (e.g., 4H HTF when on 5 Min chart).
• Defaults & Experimentation: Default input values are chosen to be balanced for many liquid markets. Users should test with replay or historical analysis on their symbol/timeframe and adjust:
o ADX threshold (e.g., 20–30) based on instrument volatility.
o VWMA and ATR scaling lengths to match average volatility cycles.
o Pivot lookback for divergence: shorter for faster markets, longer for slower ones.
• Combining with Other Analysis: Use in conjunction with price action, support/resistance, candlestick patterns, order flow, or other tools as desired. The aggregated score and alerts can guide attention but should not be the sole decision-factor.
________________________________________
## 6. How Scoring and Logic Works (Step-by-Step)
1. Compute Sub-Scores
o EMA Cross: Evaluate fast EMA > slow EMA ? +1 : fast EMA < slow EMA ? -1 : 0.
o VWMA Momentum: Calculate vwma = ta.vwma(close, length), then vwma_mom = vwma - vwma . Normalize: divide by recent average absolute momentum (e.g., ta.sma(abs(vwma_mom), lookback)), clip to .
o Volume Spike: Compute vol_SMA = ta.sma(volume, len). If volume > vol_SMA * multiplier AND price moved up ≥ threshold%, assign +1; if moved down ≥ threshold%, assign -1; else 0.
o ATR Breakout: Determine recent high/low over lookback. If close > high + ATR*mult, compute distance = close - (high + ATR*mult), normalize by ATR, cap at a configured maximum. Assign positive contribution. Similarly for bearish breakout below low.
o Higher-Timeframe Trend: Use request.security(..., lookahead=barmerge.lookahead_off) to fetch HTF EMAs; assign +1 or -1 based on alignment.
2. ADX Regime Weighting
o Compute manual ADX: directional movements (+DM, –DM), smoothed via RMA, DI+ and DI–, then DX and ADX via RMA. If ADX ≥ threshold, market is considered “Trending”; otherwise “Ranging.”
o If trending, trend-based contributions (EMA, VWMA, ATR, HTF) use full weight = 1.0. If ranging, use weight = ranging_weight (e.g., 0.5) to down-weight them. Volume spike stays binary ±1 (optional to change if desired).
3. Aggregate Raw Score
o Sum weighted contributions of all enabled components. Count the number of enabled components; if zero, default count = 1 to avoid division by zero.
4. Divergence Penalty
o Detect pivot highs/lows on price and corresponding RSI values, using a lookback. When price and RSI diverge (bearish or bullish divergence), check if current raw score is in the opposing direction:
If bearish divergence (price higher high, RSI lower high) and raw score currently positive, subtract a penalty (e.g., 0.5).
If bullish divergence (price lower low, RSI higher low) and raw score currently negative, add a penalty.
o This reduces score magnitude to reflect weakening momentum, without flipping the trend outright.
5. Normalize and Smooth
o Normalized score = (raw_score / number_of_enabled_components) * 100. This yields a roughly range.
o Optional EMA smoothing of this normalized score to reduce noise.
6. Interpretation
o Sign: >0 = net bullish bias; <0 = net bearish bias; near zero = neutral.
o Magnitude Zones: Compare |score| to thresholds (Weak, Medium, Strong) to label trend strength (e.g., “Weak Bullish Trend”, “Medium Bearish Trend”, “Strong Bullish Trend”).
o Δ Score Histogram: The histogram bars from zero show change from previous bar’s score; positive bars indicate acceleration, negative bars indicate deceleration.
o Confidence: Percentage of sub-indicators aligned with the score’s sign.
o Regime: Indicates whether trend-based signals are fully weighted or down-weighted.
________________________________________
## 7. Oscillator Plot & Visualization: How to Read It
Main Score Line & Area
The oscillator plots the aggregated score as a line, with colored fill: green above zero for bullish area, red below zero for bearish area. Horizontal reference lines at ±Weak, ±Medium, and ±Strong thresholds mark zones: crossing above +Weak suggests beginning of bullish bias, above +Medium for moderate strength, above +Strong for strong trend; similarly for bearish below negative thresholds.
Δ Score Histogram
If enabled, a histogram shows score - score . When positive, bars appear in green above zero, indicating accelerating bullish momentum; when negative, bars appear in red below zero, indicating decelerating or reversing momentum. The height of each bar reflects the magnitude of change in the aggregated score from the prior bar.
Divergence Highlight Fill
If enabled, when a pivot-based divergence is confirmed:
• Bullish Divergence : fill the area below zero down to –Weak threshold in green, signaling potential reversal from bearish to bullish.
• Bearish Divergence : fill the area above zero up to +Weak threshold in red, signaling potential reversal from bullish to bearish.
These fills appear with a lag equal to pivot lookback (the number of bars needed to confirm the pivot). They do not repaint after confirmation, but users must understand this lag.
Trend Direction Label
When score crosses above or below the Weak threshold, a small label appears near the score line reading “Bullish” or “Bearish.” If the score returns within ±Weak, the label “Neutral” appears. This helps quickly identify shifts at the moment they occur.
Dashboard Panel
In the indicator pane’s top-right, a table shows:
1. EMA Cross status: “Bull”, “Bear”, “Flat”, or “Disabled”
2. VWMA Momentum status: similarly
3. Volume Spike status: “Bull”, “Bear”, “No”, or “Disabled”
4. ATR Breakout status: “Bull”, “Bear”, “No”, or “Disabled”
5. Higher-Timeframe Trend status: “Bull”, “Bear”, “Flat”, or “Disabled”
6. Score: numeric value (rounded)
7. Confidence: e.g., “80%” (colored: green for high, amber for medium, red for low)
8. Regime: “Trending” or “Ranging” (colored accordingly)
9. Trend Strength: textual label based on magnitude (e.g., “Medium Bullish Trend”)
10. Gauge: a bar of blocks representing |score|/100
All rows remain visible at all times; changing Dashboard Size only scales text size (Normal, Small, Tiny).
________________________________________
## 8. Example Usage (Illustrative Scenario)
Example: BTCUSD 5 Min
1. Setup: Add “Trend Gauge ” to your BTCUSD 5 Min chart. Defaults: EMAs (8/21), VWMA 14 with lookback 3, volume spike settings, ATR breakout 14/5, HTF = 5m (or adjust to 4H if preferred), ADX threshold 25, ranging weight 0.5, divergence RSI length 14 pivot lookback 5, penalty 0.5, smoothing length 3, thresholds Weak=20, Medium=50, Strong=80. Dashboard Size = Small.
2. Trend Onset: At some point, price breaks above recent high by ATR multiple, volume spikes upward, faster EMA crosses above slower EMA, HTF EMA also bullish, and ADX (manual) ≥ threshold → aggregated score rises above +20 (Weak threshold) into +Medium zone. Dashboard shows “Bull” for EMA, VWMA, Vol Spike, ATR, HTF; Score ~+60–+70; Confidence ~100%; Regime “Trending”; Trend Strength “Medium Bullish Trend”; Gauge ~6–7 blocks. Δ Score histogram bars are green and rising, indicating accelerating bullish momentum. Trader notes the alignment.
3. Divergence Warning: Later, price makes a slightly higher high but RSI fails to confirm (lower RSI high). Pivot lookback completes; the indicator highlights a bearish divergence fill above zero and subtracts a small penalty from the score, causing score to stall or retrace slightly. Dashboard still bullish but score dips toward +Weak. This warns the trader to tighten stops or take partial profits.
4. Trend Weakens: Score eventually crosses below +Weak back into neutral; a “Neutral” label appears, and a “Neutral Trend” alert fires if enabled. Trader exits or avoids new long entries. If score subsequently crosses below –Weak, a “Bearish” label and alert occur.
5. Customization: If the trader finds VWMA noise too frequent on this instrument, they may disable VWMA or increase lookback. If ATR breakouts are too rare, adjust ATR length or multiplier. If ADX threshold seems off, tune threshold. All these adjustments are explained in Inputs section.
6. Visualization: The screenshot shows the main score oscillator with colored areas, reference lines at ±20/50/80, Δ Score histogram bars below/above zero, divergence fill highlighting potential reversal, and the dashboard table in the top-right.
________________________________________
## 9. Inputs Explanation
A concise yet clear summary of inputs helps users understand and adjust:
1. General Settings
• Theme (Dark/Light): Choose background-appropriate colors for the indicator pane.
• Dashboard Size (Normal/Small/Tiny): Scales text size only; all dashboard elements remain visible.
2. Indicator Settings
• Enable EMA Cross: Toggle on/off basic EMA alignment check.
o Fast EMA Length and Slow EMA Length: Periods for EMAs.
• Enable VWMA Momentum: Toggle VWMA momentum check.
o VWMA Length: Period for VWMA.
o VWMA Momentum Lookback: Bars to compare VWMA to measure momentum.
• Enable Volume Spike: Toggle volume spike detection.
o Volume SMA Length: Period to compute average volume.
o Volume Spike Multiplier: How many times above average volume qualifies as spike.
o Min Price Move (%): Minimum percent change in price during spike to qualify as bullish or bearish.
• Enable ATR Breakout: Toggle ATR breakout detection.
o ATR Length: Period for ATR.
o Breakout Lookback: Bars to look back for recent highs/lows.
o ATR Multiplier: Multiplier for breakout threshold.
• Enable Higher Timeframe Trend: Toggle HTF EMA alignment.
o Higher Timeframe: E.g., “5” for 5-minute when on 1-minute chart, or “60” for 5 Min when on 15m, etc. Uses lookahead_off.
• Enable ADX Regime Filter: Toggles regime-based weighting.
o ADX Length: Period for manual ADX calculation.
o ADX Threshold: Value above which market considered trending.
o Ranging Weight Multiplier: Weight applied to trend components when ADX < threshold (e.g., 0.5).
• Scale VWMA Momentum: Toggle normalization of VWMA momentum magnitude.
o VWMA Mom Scale Lookback: Period for average absolute VWMA momentum.
• Scale ATR Breakout Strength: Toggle normalization of breakout distance by ATR.
o ATR Scale Cap: Maximum multiple of ATR used for breakout strength.
• Enable Price-RSI Divergence: Toggle divergence detection.
o RSI Length for Divergence: Period for RSI.
o Pivot Lookback for Divergence: Bars on each side to identify pivot high/low.
o Divergence Penalty: Amount to subtract/add to score when divergence detected (e.g., 0.5).
3. Score Settings
• Smooth Score: Toggle EMA smoothing of normalized score.
• Score Smoothing Length: Period for smoothing EMA.
• Weak Threshold: Absolute score value under which trend is considered weak or neutral.
• Medium Threshold: Score above Weak but below Medium is moderate.
• Strong Threshold: Score above this indicates strong trend.
4. Visualization Settings
• Show Δ Score Histogram: Toggle display of the bar-to-bar change in score as a histogram. Default true.
• Show Divergence Fill: Toggle background fill highlighting confirmed divergences. Default true.
Each input has a tooltip in the code.
________________________________________
## 10. Limitations, Repaint Notes, and Disclaimers
10.1. Repaint & Lag Considerations
• Pivot-Based Divergence Lag: The divergence detection uses ta.pivothigh / ta.pivotlow with a specified lookback. By design, a pivot is only confirmed after the lookback number of bars. As a result:
o Divergence labels or fills appear with a delay equal to the pivot lookback.
o Once the pivot is confirmed and the divergence is detected, the fill/label does not repaint thereafter, but you must understand and accept this lag.
o Users should not treat divergence highlights as predictive signals without additional confirmation, because they appear after the pivot has fully formed.
• Higher-Timeframe EMA Alignment: Uses request.security(..., lookahead=barmerge.lookahead_off), so no future data from the higher timeframe is used. This avoids lookahead bias and ensures signals are based only on completed higher-timeframe bars.
• No Future Data: All calculations are designed to avoid using future information. For example, manual ADX uses RMA on past data; security calls use lookahead_off.
10.2. Market & Noise Considerations
• In very choppy or low-liquidity markets, some components (e.g., volume spikes or VWMA momentum) may be noisy. Users can disable or adjust those components’ parameters.
• On extremely low timeframes, noise may dominate; consider smoothing lengths or disabling certain features.
• On very high timeframes, pivots and breakouts occur less frequently; adjust lookbacks accordingly to avoid sparse signals.
10.3. Not a Standalone Trading System
• This is an indicator, not a complete trading strategy. It provides signals and context but does not manage entries, exits, position sizing, or risk management.
• Users must combine it with their own analysis, money management, and confirmations (e.g., price patterns, support/resistance, fundamental context).
• No guarantees: past behavior does not guarantee future performance.
10.4. Disclaimers
• Educational Purposes Only: The script is provided as-is for educational and informational purposes. It does not constitute financial, investment, or trading advice.
• Use at Your Own Risk: Trading involves risk of loss. Users should thoroughly test and use proper risk management.
• No Guarantees: The author is not responsible for trading outcomes based on this indicator.
• License: Published under Mozilla Public License 2.0; code is open for viewing and modification under MPL terms.
________________________________________
## 11. Alerts
• The indicator defines three alert conditions:
1. Bullish Trend: when the aggregated score crosses above the Weak threshold.
2. Bearish Trend: when the score crosses below the negative Weak threshold.
3. Neutral Trend: when the score returns within ±Weak after being outside.
Good luck
– BullByte

Market Structure HH, HL, LH and LLMarket Structure Indicator (HH, HL, LH, LL) – Explanation and Usage
Overview:
This indicator is designed to detect and visualize market structure shifts by identifying Higher Highs (HH), Higher Lows (HL), Lower Highs (LH), and Lower Lows (LL). It plots a ZigZag structure to mark trend changes, helping traders analyze price swings and market direction.
Indicator Logic:
The indicator operates based on ZigZag swing points to define trend shifts and structure changes.
Identifying Market Swings:
It finds local highs and lows using the ZigZag Length (zigzag_len), which defines how many bars back to check for a new swing high/low.
If the current high is the highest over zigzag_len periods, it marks it as a swing high.
If the current low is the lowest over zigzag_len periods, it marks it as a swing low.
Determining Market Structure:
Uptrend: Higher Highs (HH) & Higher Lows (HL)
Downtrend: Lower Lows (LL) & Lower Highs (LH)
The script continuously tracks the last two highs (h0, h1) and last two lows (l0, l1) to classify the current market structure.
Visual Elements:
ZigZag Line (Optional): Connects major swing highs and lows for trend visualization.
Labels (HH, HL, LH, LL):
HH (Higher High) – Price is making new highs → Uptrend Continuation.
HL (Higher Low) – Price forms a higher bottom → Uptrend Confirmation.
LL (Lower Low) – Price is making new lows → Downtrend Continuation.
LH (Lower High) – Price forms a lower top → Downtrend Confirmation.
Breakout Confirmation with Fibonacci Factor (Optional)
The indicator includes an option to confirm breakouts using the fib_factor, which ensures price moves beyond a certain retracement level.
How to Use This Indicator in Trading:
1. Identifying Trends & Trend Reversals
Uptrend: Look for a sequence of HH and HL.
Downtrend: Look for a sequence of LL and LH.
Trend Reversal: If price transitions from HH-HL to LH-LL, it signals a shift from an uptrend to a downtrend (and vice versa).
2. Confirming Entry & Exit Points
Buy Entry (Long Position)
Enter after a Higher Low (HL) is confirmed in an uptrend.
Combine with support zones or moving averages for confirmation.
Sell Entry (Short Position)
Enter after a Lower High (LH) is confirmed in a downtrend.
Combine with resistance zones or moving averages for confirmation.
Exit Strategy
Exit long trades when price fails to make a HH and forms an LH instead.
Exit short trades when price fails to make a LL and forms an HL instead.
3. Spotting Breakouts & Order Blocks
The Fib Factor setting allows traders to filter false breakouts by confirming price movement beyond a retracement threshold.
Potential Order Blocks can be identified by looking at the last major swing point before a breakout.
Benefits of This Indicator for Traders
✅ Trend Identification: Helps traders quickly determine if the market is in an uptrend or downtrend.
✅ Clear Market Structure Labels: Easily visualizes Higher Highs, Higher Lows, Lower Highs, and Lower Lows.
✅ Avoids Noise: The ZigZag algorithm removes small fluctuations and focuses on significant market movements.
✅ Assists with Entry & Exit Decisions: Provides objective signals for trend continuation or reversals.
✅ Works in All Markets: Useful for stocks, forex, crypto, and futures trading.
Would you like me to add additional features like Order Blocks, Breakout Confirmation, or Alerts to improve this indicator? 🚀

MarketStructureLibrary "MarketStructure"
Will draw out the market structure for the disired pivot length. The code is from my indicator "Marker structure" ().
Create(type, length, source, equalPivotsFactor, extendEqualPivotsZones, equalPivotsStyle, equalPivotsColor, alertFrequency)
Call on each bar. Will create a Structure object.
Parameters:
type (int) : the type of the Structure to create. 0 = internal, 1 = swing.
length (int) : The lenghts (left and right) for pivots to use.
source (string) : The source to be used for structural changes ('Close', 'High/low (aggresive)' (low in an uptrend) or 'High/low (passive)' (high in an uptrend)).
equalPivotsFactor (float) : Set how the limits are for an equal pivot. This is a factor of the Average True Length (ATR) of length 14. If a low pivot is considered to be equal if it doesn't break the low pivot (is at a lower value) and is inside the previous low pivot + this limit.
extendEqualPivotsZones (bool) : Set to true if you want the equal pivots zones to be extended.
equalPivotsStyle (string) : Set the style of equal pivot zones.
equalPivotsColor (color) : Set the color of equal pivot zones.
alertFrequency (string)
Returns: The 'structure' object.
Pivot(structure)
Sets the pivots in the structure.
Parameters:
structure (Structure)
Returns: The 'structure' object.
PivotLabels(structure)
Draws labels for the pivots found.
Parameters:
structure (Structure)
Returns: The 'structure' object.
EqualHighOrLow(structure)
Draws the boxsa for equal highs/lows. Also creates labels for the pivots included.
Parameters:
structure (Structure)
Returns: The 'structure' object.
BreakOfStructure(structure)
Will create lines when a break of strycture occures.
Parameters:
structure (Structure)
Returns: The 'structure' object.
ChangeOfCharacter(structure)
Will create lines when a change of character occures.
Parameters:
structure (Structure)
Returns: The 'structure' object.
StructureBreak
Holds drawings for a structure break.
Fields:
Line (series line) : The line object.
Label (series label) : The label object.
Pivot
Holds all the values for a found pivot.
Fields:
Price (series float) : The price of the pivot.
BarIndex (series int) : The bar_index where the pivot occured.
Type (series int) : The type of the pivot (-1 = low, 1 = high).
ChangeOfCharacterBroken (series bool) : Sets to true if a change of character has happened.
BreakOfStructureBroken (series bool) : Sets to true if a break of structure has happened.
Structure
Holds all the values for the market structure.
Fields:
Length (series int) : Define the left and right lengths of the pivots used.
Type (series int) : Set the type of the market structure. Two types can be used, 'internal' and 'swing' (0 = internal, 1 = swing).
Trend (series int) : This will be set internally and can be -1 = downtrend, 1 = uptrend.
Source (series string) : Set the source for structural chandeg. Can be 'Close', 'High/low (aggresive)' (low in an uptrend) or 'High/low (passive)' (high in an uptrend).
EqualPivotsFactor (series float) : Set how the limits are for an equal pivot. This is a factor of the Average True Length (ATR) of length 14. If a low pivot is considered to be equal if it doesn't break the low pivot (is at a lower value) and is inside the previous low pivot + this limit.
ExtendEqualPivotsZones (series bool) : Set to true if you want the equal pivots zones to be extended.
ExtendEqualPivotsStyle (series string) : Set the style of equal pivot zones.
ExtendEqualPivotsColor (series color) : Set the color of equal pivot zones.
EqualHighs (array) : Holds the boxes for zones that contains equal highs.
EqualLows (array) : Holds the boxes for zones that contains equal lows.
BreakOfStructures (array) : Holds all the break of structures within the trend (before a change of character).
Pivots (array) : All the pivots in the current trend, added with the latest first, this is cleared when the trend changes.
AlertFrequency (series string) : set the frequency for alerts.
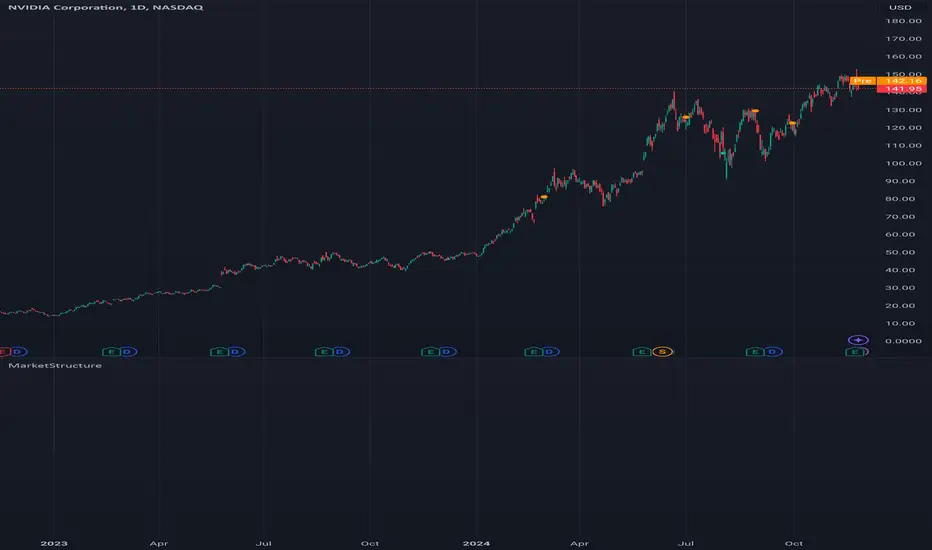
Globex time (New York Time)This indicator is designed to highlight and analyze price movements within the Globex session. Primarily geared toward the Globex Trap trading strategy, this tool visually identifies the session's high and low prices, allowing traders to better assess price action during extended hours. Here’s a comprehensive breakdown of its features and functionality:
Purpose
The "Globex Time (New York Time)" indicator tracks price levels during the Globex trading session, providing a clear view of overnight market activity. This session, typically running from 6 p.m. ET (18:00) until the following morning at 8:30 a.m. ET, is a critical period where significant market positioning can occur before the regular session opens. In the Globex Trap strategy, the session high and low are essential levels, as price movements around these areas often indicate potential support, resistance, or reversal zones, which traders use to set up entries or exits when the regular trading session begins.
Key Features
Customizable Session Start and End Times
The indicator allows users to specify the exact start and end times of the Globex session in New York time. The default settings are:
Start: 6 p.m. ET (18:00)
End: 8:30 a.m. ET
These settings can be adjusted to align with specific market hours or personal preferences.
Session High and Low Identification
Throughout the defined session, the indicator dynamically calculates and tracks:
Session High: The highest price reached within the session.
Session Low: The lowest price reached within the session.
These levels are essential for the Globex Trap strategy, as price action around them can indicate likely breakout or reversal points when regular trading resumes.
Vertical Lines for Session Start and End
The indicator draws vertical lines at both the session start and end times:
Session Start Line: A solid line marking the exact beginning of the Globex session.
Session End Line: A similar vertical line marking the session’s conclusion.
Both lines are customizable in terms of color and thickness, making it easy to distinguish the session boundaries visually on the chart.
Horizontal Lines for Session High and Low
At the end of the session, the indicator plots horizontal lines representing the Globex session's high and low levels. Users can customize these lines:
Color: Define specific colors for the session high (default: red) and session low (default: green) to easily differentiate them.
Line Style: Options to set the line style (solid, dashed, or dotted) provide flexibility for visual preferences and chart organization.
Automatic Reset for Daily Tracking
To adapt to the next trading day, the indicator resets the session high and low data once the current session ends. This reset prepares it to start tracking new levels at the beginning of the next session without manual intervention.
Practical Application in the Globex Trap Strategy
In the Globex Trap strategy, traders are primarily interested in price behavior around the high and low levels established during the overnight session. Common applications of this indicator for this strategy include:
Breakout Trades: Watching for price to break above the Globex high or below the Globex low, indicating potential momentum in the breakout direction.
Reversal Trades: Monitoring for failed breakouts or traps where price tests and rejects the Globex high or low, suggesting a reversal as liquidity is trapped in these zones.
Support and Resistance Zones: Using the session high and low as key support and resistance levels during the regular trading session, with potential entry or exit points when price approaches these areas.
Additional Configuration Options
Vertical Line Color and Width: Define the color and thickness of the vertical session start and end lines to match your chart’s theme.
Upper and Lower Line Colors and Styles: Customize the appearance of the session high and low horizontal lines by setting color and line style (solid, dashed, or dotted), making it easy to distinguish these critical levels from other chart markings.
Summary
This indicator is a valuable tool for traders implementing the Globex Trap strategy. It visually segments the Globex session and marks essential price levels, helping traders analyze market behavior overnight. Through its customizable options and clear visual representation, it simplifies tracking overnight price activity and identifying strategic levels for potential trade setups during the regular session.

WaveTrend With Divs & RSI(STOCH) Divs by WeloTradesWaveTrend with Divergences & RSI(STOCH) Divergences by WeloTrades
Overview
The "WaveTrend With Divergences & RSI(STOCH) Divergences" is an advanced Pine Script™ indicator designed for TradingView, offering a multi-dimensional analysis of market conditions. This script integrates several technical indicators—WaveTrend, Money Flow Index (MFI), RSI, and Stochastic RSI—into a cohesive tool that identifies both regular and hidden divergences across these indicators. These divergences can indicate potential market reversals and provide critical trading opportunities.
This indicator is not just a simple combination of popular tools; it offers extensive customization options, organized data presentation, and valuable trading signals that are easy to interpret. Whether you're a day trader or a long-term investor, this script enhances your ability to make informed decisions.
Originality and Usefulness
The originality of this script lies in its integration and the synergy it creates among the indicators used. Rather than merely combining multiple indicators, this script allows them to work together, enhancing each other's strengths. For example, by identifying divergences across WaveTrend, RSI, and Stochastic RSI simultaneously, the script provides multiple layers of confirmation, which reduces the likelihood of false signals and increases the reliability of trading signals.
The usefulness of this script is apparent in its ability to offer a consolidated view of market dynamics. It not only simplifies the analytical process by combining different indicators but also provides deeper insights through its divergence detection features. This comprehensive approach is designed to help traders identify potential market reversals, confirm trends, and ultimately make more informed trading decisions.
How the Components Work Together
1. Cross-Validation of Signals
WaveTrend: This indicator is primarily used to identify overbought and oversold conditions, as well as potential buy and sell signals. WaveTrend's ability to smooth price data and reduce noise makes it a reliable tool for identifying trend reversals.
RSI & Stochastic RSI: These momentum oscillators are used to measure the speed and change of price movements. While RSI identifies general overbought and oversold conditions, Stochastic RSI offers a more granular view by tracking the RSI’s level relative to its high-low range over a period of time. When these indicators align with WaveTrend signals, it adds a layer of confirmation that enhances the reliability of the signals.
Money Flow Index (MFI): This volume-weighted indicator assesses the inflow and outflow of money in an asset, giving insights into buying and selling pressure. By analyzing the MFI alongside WaveTrend and RSI indicators, the script can cross-validate signals, ensuring that buy or sell signals are supported by actual market volume.
Example Bullish scenario:
When a bullish divergence is detected on the RSI and confirmed by a corresponding bullish signal on the WaveTrend, along with an increasing Money Flow Index, the probability of a successful trade setup increases. This cross-validation minimizes the risk of acting on false signals, which might occur when relying on a single indicator.
Example Bearish scenario:
When a bearish divergence is detected on the RSI and confirmed by a corresponding bearish signal on the WaveTrend, along with an decreasing Money Flow Index, the probability of a successful trade setup increases. This cross-validation minimizes the risk of acting on false signals, which might occur when relying on a single indicator.
2. Divergence Detection and Market Reversals
Regular Divergences: Occur when the price action and an indicator (like RSI or WaveTrend) move in opposite directions. Regular bullish divergence signals a potential upward reversal when the price makes a lower low while the indicator makes a higher low. Conversely, regular bearish divergence suggests a downward reversal when the price makes a higher high, but the indicator makes a lower high.
Hidden Divergences: These occur when the price action and indicator move in the same direction, but with different momentum. Hidden bullish divergence suggests the continuation of an uptrend, while hidden bearish divergence suggests the continuation of a downtrend. By detecting these divergences across multiple indicators, the script identifies potential trend reversals or continuations with greater accuracy.
Example: The script might detect a regular bullish divergence on the WaveTrend while simultaneously identifying a hidden bullish divergence on the RSI. This combination suggests that while a trend reversal is possible, the overall market sentiment remains bullish, providing a nuanced view of the market.
A Regular Bullish Divergence Example:
A Hidden Bullish Divergence Example:
A Regular Bearish Divergence Example:
A Hidden Bearish Divergence Example:
3. Trend Strength and Sentiment Analysis
WaveTrend: Measures the strength and direction of the trend. By identifying the extremes of market sentiment (overbought and oversold levels), WaveTrend provides early signals for potential reversals.
Money Flow Index (MFI): Assesses the underlying sentiment by analyzing the flow of money. A rising MFI during an uptrend confirms strong buying pressure, while a falling MFI during a downtrend confirms selling pressure. This helps traders assess whether a trend is likely to continue or reverse.
RSI & Stochastic RSI: Offer a momentum-based perspective on the trend’s strength. High RSI or Stochastic RSI values indicate that the asset may be overbought, suggesting a potential reversal. Conversely, low values indicate oversold conditions, signaling a possible upward reversal.
Example:
During a strong uptrend, the WaveTrend & RSI's might signal overbought conditions, suggesting caution. If the MFI also shows decreasing buying pressure and the RSI reaches extreme levels, these indicators together suggest that the trend might be weakening, and a reversal could be imminent.
Example:
During a strong downtrend, the WaveTrend & RSI's might signal oversold conditions, suggesting caution. If the MFI also shows increasing buying pressure and the RSI reaches extreme levels, these indicators together suggest that the trend might be weakening, and a reversal could be imminent.
Conclusion
The "WaveTrend With Divergences & RSI(STOCH) Divergences" script offers a powerful, integrated approach to technical analysis by combining trend, momentum, and sentiment indicators into a single tool. Its unique value lies in the cross-validation of signals, the ability to detect divergences, and the comprehensive view it provides of market conditions. By offering traders multiple layers of analysis and customization options, this script is designed to enhance trading decisions, reduce false signals, and provide clearer insights into market dynamics.
WAVETREND
Display of WaveTrend:
Display of WaveTrend Setting:
WaveTrend Indicator Explanation
The WaveTrend indicator helps identify overbought and oversold conditions, as well as potential buy and sell signals. Its flexibility allows traders to adapt it to various strategies, making it a versatile tool in technical analysis.
WaveTrend Input Settings:
WT MA Source: Default: HLC3
What it is: The data source used for calculating the WaveTrend Moving Average.
What it does: Determines the input data to smooth price action and filter noise.
Example: Using HLC3 (average of High, Low, Close) provides a smoother data representation compared to using just the closing price.
Length (WT MA Length): Default: 3
What it is: The period used to calculate the Moving Average.
What it does: Adjusts the sensitivity of the WaveTrend indicator, where shorter lengths respond more quickly to price changes.
Example: A length of 3 is ideal for short-term analysis, providing quick reactions to price movements.
WT Channel Length & Average: Default: WT Channel Length = 9, Average = 12
What it is: Lengths used to calculate the WaveTrend channel and its average.
What it does: Smooths out the WaveTrend further, reducing false signals by averaging over a set period.
Example: Higher values reduce noise and help in identifying more reliable trends.
Channel: Style, Width, and Color:
What it is: Customization options for the WaveTrend channel's appearance.
What it does: Adjusts how the channel is displayed, including line style, width, and color.
Example: Choosing an area style with a distinct color can make the WaveTrend indicator clearly visible on the chart.
WT Buy & Sell Signals:
What it is: Settings to enable and customize buy and sell signals based on WaveTrend.
What it does: Allows for the display of buy/sell signals and customization of their shapes and colors.
When it gives a Buy Signal: Generated when the WaveTrend line crosses below an oversold level and then rises back, indicating a potential upward price movement.
When it gives a Sell Signal: Triggered when the WaveTrend line crosses above an overbought level and then declines, suggesting a possible downward trend.
Example: The script identifies these signals based on mean reversion principles, where prices tend to revert to the mean after reaching extremes. Traders can use these signals to time their entries and exits effectively.
WAVETREND OVERBOUGTH AND OVERSOLD LEVELS
Display of WaveTrend with Overbought & Oversold Levels:
Display of WaveTrend Overbought & Oversold Levels Settings:
WaveTrend Overbought & Oversold Levels Explanation
WT OB & OS Levels: Default: OB Level 1 = 53, OB Level 2 = 60, OS Level 1 = -53, OS Level 2 = -60
What it is: The default overbought and oversold levels used by the WaveTrend indicator to signal potential market reversals.
What it does: When the WaveTrend crosses above the OB levels, it indicates an overbought condition, potentially signaling a reversal or selling opportunity. Conversely, when it crosses below the OS levels, it indicates an oversold condition, potentially signaling a reversal or buying opportunity.
Example: A trader might use these levels to time entry or exit points, such as selling when the WaveTrend crosses into the overbought zone or buying when it crosses into the oversold zone.
Show OB/OS Levels: Default: True
What it is: Toggle options to show or hide the overbought and oversold levels on your chart.
What it does: When enabled, these levels will be visually represented on your chart, helping you to easily identify when the market reaches these critical thresholds.
Example: Displaying these levels can help you quickly see when the WaveTrend is approaching or has crossed into overbought or oversold territory, allowing for more informed trading decisions.
Line Style, Width, and Color for OB/OS Levels:
What it is: Options to customize the appearance of the OB and OS levels on your chart, including line style (solid, dotted, dashed), line width, and color.
What it does: These settings allow you to adjust how prominently these levels are displayed on your chart, which can help you better visualize and respond to overbought or oversold conditions.
Example: Setting a thicker, dashed line in a contrasting color can make these levels stand out more clearly, aiding in quick visual identification.
Example of Use:
Scenario: A trader wants to identify potential selling points when the market is overbought. They set the OB levels at 53 and 60, choosing a solid, red line style to make these levels clear on their chart. As the WaveTrend crosses above 53, they monitor for further price action, and upon crossing 60, they consider initiating a sell order.
WAVETREND DIVERGENCES
Display of WaveTrend Divergence:
Display of WaveTrend Divergence Setting:
WaveTrend Divergence Indicator Explanation
The WaveTrend Divergence feature helps identify potential reversal points in the market by highlighting divergences between the price and the WaveTrend indicator. Divergences can signal a shift in market momentum, indicating a possible trend reversal. This component allows traders to visualize and customize divergence detection on their charts.
WaveTrend Divergence Input Settings:
Potential Reversal Range: Default: 28
What it is: The number of bars to look back when detecting potential tops and bottoms.
What it does: Sets the range for identifying possible reversal points based on historical data.
Example: A setting of 28 looks back across the last 28 bars to find reversal points, offering a balance between responsiveness and reliability.
Reversal Minimum LVL OB & OS: Default: OB = 35, OS = -35
What it is: The minimum overbought and oversold levels required for detecting potential reversals.
What it does: Adjusts the thresholds that trigger a reversal signal based on the WaveTrend indicator.
Example: A higher OB level reduces the sensitivity to overbought conditions, potentially filtering out false reversal signals.
Lookback Bar Left & Right: Default: Left = 10, Right = 1
What it is: The number of bars to the left and right used to confirm a top or bottom.
What it does: Helps determine the position of peaks and troughs in the price action.
Example: A larger left lookback captures more extended price action before the peak, while a smaller right lookback focuses on the immediate past.
Lookback Range Min & Max: Default: Min = 5, Max = 60
What it is: The minimum and maximum range for the lookback period when identifying divergences.
What it does: Fine-tunes the detection of divergences by controlling the range over which the indicator looks back.
Example: A wider range increases the chances of detecting divergences across different market conditions.
R.Div Minimum LVL OB & OS: Default: OB = 53, OS = -53
What it is: The threshold levels for detecting regular divergences.
What it does: Adjusts the sensitivity of the regular divergence detection.
Example: Higher thresholds make the detection more conservative, identifying only stronger divergence signals.
H.Div Minimum LVL OB & OS: Default: OB = 20, OS = -20
What it is: The threshold levels for detecting hidden divergences.
What it does: Similar to regular divergence settings but for hidden divergences, which can indicate potential reversals that are less obvious.
Example: Lower thresholds make the hidden divergence detection more sensitive, capturing subtler market shifts.
Divergence Label Options:
What it is: Options to display and customize labels for regular and hidden divergences.
What it does: Allows users to visually differentiate between regular and hidden divergences using customizable labels and colors.
Example: Using different colors and symbols for regular (R) and hidden (H) divergences makes it easier to interpret signals on the chart.
Text Size and Color:
What it is: Customization options for the size and color of divergence labels.
What it does: Adjusts the readability and visibility of divergence labels on the chart.
Example: Larger text size may be preferred for charts with a lot of data, ensuring divergence labels stand out clearly.
FAST & SLOW MONEY FLOW INDEX
Display of Fast & Slow Money Flow:
Display of Fast & Slow Money Flow Setting:
Fast Money Flow Indicator Explanation
The Fast Money Flow indicator helps traders identify the flow of money into and out of an asset over a shorter time frame. By tracking the volume-weighted average of price movements, it provides insights into buying and selling pressure in the market, which can be crucial for making timely trading decisions.
Fast Money Flow Input Settings:
Fast Money Flow: Length: Default: 9
What it is: The period used for calculating the Fast Money Flow.
What it does: Determines the sensitivity of the Money Flow calculation. A shorter length makes the indicator more responsive to recent price changes, while a longer length provides a smoother signal.
Example: A length of 9 is suitable for traders looking to capture quick shifts in market sentiment over a short period.
Fast MFI Area Multiplier: Default: 5
What it is: A multiplier applied to the Money Flow area calculation.
What it does: Adjusts the size of the Money Flow area on the chart, effectively amplifying or reducing the visual impact of the indicator.
Example: A higher multiplier can make the Money Flow more prominent on the chart, aiding in the quick identification of significant money flow changes.
Y Position (Y Pos): Default: 0
What it is: The vertical position adjustment for the Fast Money Flow plot on the chart.
What it does: Allows you to move the Money Flow plot up or down on the chart to avoid overlap with other indicators.
Example: Adjusting the Y Position can be useful if you have multiple indicators on the chart and need to maintain clarity.
Fast MFI Style, Width, and Color:
What it is: Customization options for how the Fast Money Flow is displayed on the chart.
What it does: Enables you to choose between different plot styles (line or area), set the line width, and select colors for positive and negative money flow.
Example: Using different colors for positive (green) and negative (red) money flow helps to visually distinguish between periods of buying and selling pressure.
Slow Money Flow Indicator Explanation
The Slow Money Flow indicator tracks the flow of money into and out of an asset over a longer time frame. It provides a broader perspective on market sentiment, smoothing out short-term fluctuations and highlighting longer-term trends.
Slow Money Flow Input Settings:
Slow Money Flow: Length: Default: 12
What it is: The period used for calculating the Slow Money Flow.
What it does: A longer period smooths out short-term fluctuations, providing a clearer view of the overall money flow trend.
Example: A length of 12 is often used by traders looking to identify sustained trends rather than short-term volatility.
Slow MFI Area Multiplier: Default: 5
What it is: A multiplier applied to the Slow Money Flow area calculation.
What it does: Adjusts the size of the Money Flow area on the chart, helping to emphasize the indicator’s significance.
Example: Increasing the multiplier can help highlight the Money Flow in markets with less volatile price action.
Y Position (Y Pos): Default: 0
What it is: The vertical position adjustment for the Slow Money Flow plot on the chart.
What it does: Allows for vertical repositioning of the Money Flow plot to maintain chart clarity when used with other indicators.
Example: Adjusting the Y Position ensures that the Slow Money Flow indicator does not overlap with other key indicators on the chart.
Slow MFI Style, Width, and Color:
What it is: Customization options for the visual display of the Slow Money Flow on the chart.
What it does: Allows you to choose the plot style (line or area), set the line width, and select colors to differentiate positive and negative money flow.
Example: Customizing the colors for the Slow Money Flow allows traders to quickly distinguish between buying and selling trends in the market.
RSI
Display of RSI:
Display of RSI Setting:
RSI Indicator Explanation
The Relative Strength Index (RSI) is a momentum oscillator that measures the speed and change of price movements. It is typically used to identify overbought or oversold conditions in the market, providing traders with potential signals for buying or selling.
RSI Input Settings:
RSI Source: Default: Close
What it is: The data source used for calculating the RSI.
What it does: Determines which price data (e.g., close, open) is used in the RSI calculation, affecting how the indicator reflects market conditions.
Example: Using the closing price is standard practice, as it reflects the final agreed-upon price for a given time period.
MA Type (Moving Average Type): Default: SMA
What it is: The type of moving average applied to the RSI for smoothing purposes.
What it does: Changes the smoothing technique of the RSI, impacting how quickly the indicator responds to price movements.
Example: Using an Exponential Moving Average (EMA) will make the RSI more sensitive to recent price changes compared to a Simple Moving Average (SMA).
RSI Length: Default: 14
What it is: The period over which the RSI is calculated.
What it does: Adjusts the sensitivity of the RSI. A shorter length (e.g., 7) makes the RSI more responsive to recent price changes, while a longer length (e.g., 21) smooths out the indicator, reducing the number of signals.
Example: A 14-period RSI is commonly used for identifying overbought and oversold conditions, providing a balance between sensitivity and reliability.
RSI Plot Style, Width, and Color:
What it is: Options to customize the appearance of the RSI line on the chart.
What it does: Allows you to adjust the visual representation of the RSI, including the line width and color.
Example: Setting a thicker line width and a bright color like yellow can make the RSI more visible on the chart, aiding in quick analysis.
Display of RSI with RSI Moving Average:
RSI Moving Average Explanation
The RSI Moving Average adds a smoothing layer to the RSI, helping to filter out noise and provide clearer signals. It is particularly useful for confirming trend strength and identifying potential reversals.
RSI Moving Average Input Settings:
MA Length: Default: 14
What it is: The period over which the Moving Average is calculated on the RSI.
What it does: Adjusts the smoothing of the RSI, helping to reduce false signals and provide a clearer trend indication.
Example: A 14-period moving average on the RSI can smooth out short-term fluctuations, making it easier to spot genuine overbought or oversold conditions.
MA Plot Style, Width, and Color:
What it is: Customization options for how the RSI Moving Average is displayed on the chart.
What it does: Allows you to adjust the line width and color, helping to differentiate the Moving Average from the main RSI line.
Example: Using a contrasting color for the RSI Moving Average (e.g., magenta) can help it stand out against the main RSI line, making it easier to interpret the indicator.
STOCHASTIC RSI
Display of Stochastic RSI:
Display of Stochastic RSI Setting:
Stochastic RSI Indicator Explanation
The Stochastic RSI (Stoch RSI) is a momentum oscillator that measures the level of the RSI relative to its high-low range over a set period of time. It is used to identify overbought and oversold conditions, providing potential buy and sell signals based on momentum shifts.
Stochastic RSI Input Settings:
Stochastic RSI Length: Default: 14
What it is: The period over which the Stochastic RSI is calculated.
What it does: Adjusts the sensitivity of the Stochastic RSI. A shorter length makes the indicator more responsive to recent price changes, while a longer length smooths out the fluctuations, reducing noise.
Example: A length of 14 is commonly used to identify momentum shifts over a medium-term period, providing a balanced view of potential overbought or oversold conditions.
Display of Stochastic RSI %K Line:
Stochastic RSI %K Line Explanation
The %K line in the Stochastic RSI is the main line that tracks the momentum of the RSI over the chosen period. It is the faster-moving component of the Stochastic RSI, often used to identify entry and exit points.
Stochastic RSI %K Input Settings:
%K Length: Default: 3
What it is: The period used for smoothing the %K line of the Stochastic RSI.
What it does: Smoothing the %K line helps reduce noise and provides a clearer signal for potential market reversals.
Example: A smoothing length of 3 is common, offering a balance between responsiveness and noise reduction, making it easier to spot significant momentum shifts.
%K Plot Style, Width, and Color:
What it is: Customization options for the visual representation of the %K line.
What it does: Allows you to adjust the appearance of the %K line on the chart, including line width and color, to fit your visual preferences.
Example: Setting a blue color and a medium width for the %K line makes it stand out clearly on the chart, helping to identify key points of momentum change.
%K Fill Color (Above):
What it is: The fill color that appears above the %K line on the chart.
What it does: Adds visual clarity by shading the area above the %K line, making it easier to interpret the direction and strength of momentum.
Example: Using a light blue fill color above the %K line can help emphasize bullish momentum, making it visually prominent.
Display of Stochastic RSI %D Line:
Stochastic RSI %D Line Explanation
The %D line in the Stochastic RSI is a moving average of the %K line and acts as a signal line. It is slower-moving compared to the %K line and is often used to confirm signals or identify potential reversals when it crosses the %K line.
Stochastic RSI %D Input Settings:
%D Length: Default: 3
What it is: The period used for smoothing the %D line of the Stochastic RSI.
What it does: Smooths out the %D line, making it less sensitive to short-term fluctuations and more reliable for identifying significant market signals.
Example: A length of 3 is often used to provide a smoothed signal line that can help confirm trends or reversals indicated by the %K line.
%D Plot Style, Width, and Color:
What it is: Customization options for the visual representation of the %D line.
What it does: Allows you to adjust the appearance of the %D line on the chart, including line width and color, to match your preferences.
Example: Setting an orange color and a thicker line width for the %D line can help differentiate it from the %K line, making crossover points easier to spot.
%D Fill Color (Below):
What it is: The fill color that appears below the %D line on the chart.
What it does: Adds visual clarity by shading the area below the %D line, making it easier to interpret bearish momentum.
Example: Using a light orange fill color below the %D line can highlight bearish conditions, making it visually easier to identify.
RSI & STOCHASTIC RSI OVERBOUGHT AND OVERSOLD LEVELS
Display of RSI & Stochastic with Overbought & Oversold Levels:
Display of RSI & Stochastic Overbought & Oversold Settings:
RSI & Stochastic Overbought & Oversold Levels Explanation
The Overbought (OB) and Oversold (OS) levels for RSI and Stochastic RSI indicators are key thresholds that help traders identify potential reversal points in the market. These levels are used to determine when an asset is likely overbought or oversold, which can signal a potential trend reversal.
RSI & Stochastic Overbought & Oversold Input Settings:
RSI & Stochastic Level 1 Overbought (OB) & Oversold (OS): Default: OB Level = 170, OS Level = 130
What it is: The first set of thresholds for determining overbought and oversold conditions for both RSI and Stochastic RSI indicators.
What it does: When the RSI or Stochastic RSI crosses above the overbought level, it suggests that the asset might be overbought, potentially signaling a sell opportunity. Conversely, when these indicators drop below the oversold level, it suggests the asset might be oversold, potentially signaling a buy opportunity.
Example: If the RSI crosses above 170, traders might look for signs of a potential trend reversal to the downside, while a cross below 130 might indicate a reversal to the upside.
RSI & Stochastic Level 2 Overbought (OB) & Oversold (OS): Default: OB Level = 180, OS Level = 120
What it is: The second set of thresholds for determining overbought and oversold conditions for both RSI and Stochastic RSI indicators.
What it does: These levels provide an additional set of reference points, allowing traders to differentiate between varying degrees of overbought and oversold conditions, potentially leading to more refined trading decisions.
Example: When the RSI crosses above 180, it might indicate an extreme overbought condition, which could be a stronger signal for a sell, while a cross below 120 might indicate an extreme oversold condition, which could be a stronger signal for a buy.
RSI & Stochastic Overbought (OB) Band Customization:
OB Level 1: Width, Style, and Color:
What it is: Customization options for the visual appearance of the first overbought band on the chart.
What it does: Allows you to set the line width, style (solid, dotted, dashed), and color for the first overbought band, enhancing its visibility on the chart.
Example: A dashed red line with medium width can clearly indicate the first overbought level, helping traders quickly identify when this threshold is crossed.
OB Level 2: Width, Style, and Color:
What it is: Customization options for the visual appearance of the second overbought band on the chart.
What it does: Allows you to set the line width, style, and color for the second overbought band, providing a clear distinction from the first band.
Example: A dashed red line with a slightly thicker width can represent a more significant overbought level, making it easier to differentiate from the first level.
RSI & Stochastic Oversold (OS) Band Customization:
OS Level 1: Width, Style, and Color:
What it is: Customization options for the visual appearance of the first oversold band on the chart.
What it does: Allows you to set the line width, style (solid, dotted, dashed), and color for the first oversold band, making it visually prominent.
Example: A dashed green line with medium width can highlight the first oversold level, helping traders identify potential buying opportunities.
OS Level 2: Width, Style, and Color:
What it is: Customization options for the visual appearance of the second oversold band on the chart.
What it does: Allows you to set the line width, style, and color for the second oversold band, providing an additional visual cue for extreme oversold conditions.
Example: A dashed green line with a thicker width can represent a more significant oversold level, offering a stronger visual cue for potential buying opportunities.
RSI DIVERGENCES
Display of RSI Divergence Labels:
Display of RSI Divergence Settings:
RSI Divergence Lookback Explanation
The RSI Divergence settings allow traders to customize the parameters for detecting divergences between the RSI (Relative Strength Index) and price action. Divergences occur when the price moves in the opposite direction to the RSI, potentially signaling a trend reversal. These settings help refine the accuracy of divergence detection by adjusting the lookback period and range. ( NOTE: This setting only imply to the RSI. This doesn't effect the STOCHASTIC RSI. )
RSI Divergence Lookback Input Settings:
Lookback Left: Default: 10
What it is: The number of bars to look back from the current bar to detect a potential divergence.
What it does: Defines the left-side lookback period for identifying pivot points in the RSI, which are used to spot divergences. A longer lookback period may capture more significant trends but could also miss shorter-term divergences.
Example: A setting of 10 bars means the script will consider pivot points up to 10 bars before the current bar to check for divergence patterns.
Lookback Right: Default: 1
What it is: The number of bars to look forward from the current bar to complete the divergence pattern.
What it does: Defines the right-side lookback period for confirming a potential divergence. This setting helps ensure that the identified divergence is valid by allowing the script to check subsequent bars for confirmation.
Example: A setting of 1 bar means the script will look at the next bar to confirm the divergence pattern, ensuring that the signal is reliable.
Lookback Range Min: Default: 5
What it is: The minimum range of bars required to detect a valid divergence.
What it does: Sets a lower bound on the range of bars considered for divergence detection. A lower minimum range might capture more frequent but possibly less significant divergences.
Example: Setting the minimum range to 5 ensures that only divergences spanning at least 5 bars are considered, filtering out very short-term patterns.
Lookback Range Max: Default: 60
What it is: The maximum range of bars within which a divergence can be detected.
What it does: Sets an upper bound on the range of bars considered for divergence detection. A larger maximum range might capture more significant divergences but could also include less relevant long-term patterns.
Example: Setting the maximum range to 60 bars allows the script to detect divergences over a longer timeframe, capturing more extended divergence patterns that could indicate major trend reversals.
RSI Divergence Explanation
RSI divergences occur when the RSI indicator and price action move in opposite directions, signaling potential trend reversals. This section of the settings allows traders to customize the appearance and detection of both regular and hidden bullish and bearish divergences.
RSI Divergence Input Settings:
R. Bullish Div Label: Default: True
What it is: An option to display labels for regular bullish divergences.
What it does: Enables or disables the visibility of labels that mark regular bullish divergences, where the price makes a lower low while the RSI makes a higher low, indicating a potential upward reversal.
Example: A trader might use this to spot buying opportunities in a downtrend when a bullish divergence suggests the trend may be reversing.
Bullish Label Color, Line Width, and Line Color:
What it is: Settings to customize the appearance of regular bullish divergence labels.
What it does: Allows you to choose the color of the labels, adjust the width of the divergence lines, and select the color for these lines.
Example: Selecting a green label color and a distinct line width makes bullish divergences easily recognizable on your chart.
R. Bearish Div Label: Default: True
What it is: An option to display labels for regular bearish divergences.
What it does: Enables or disables the visibility of labels that mark regular bearish divergences, where the price makes a higher high while the RSI makes a lower high, indicating a potential downward reversal.
Example: A trader might use this to spot selling opportunities in an uptrend when a bearish divergence suggests the trend may be reversing.
Bearish Label Color, Line Width, and Line Color:
What it is: Settings to customize the appearance of regular bearish divergence labels.
What it does: Allows you to choose the color of the labels, adjust the width of the divergence lines, and select the color for these lines.
Example: Choosing a red label color and a specific line width makes bearish divergences clearly stand out on your chart.
H. Bullish Div Label: Default: False
What it is: An option to display labels for hidden bullish divergences.
What it does: Enables or disables the visibility of labels that mark hidden bullish divergences, where the price makes a higher low while the RSI makes a lower low, indicating potential continuation of an uptrend.
Example: A trader might use this to confirm an existing uptrend when a hidden bullish divergence signals continued buying strength.
Hidden Bullish Label Color, Line Width, and Line Color:
What it is: Settings to customize the appearance of hidden bullish divergence labels.
What it does: Allows you to choose the color of the labels, adjust the width of the divergence lines, and select the color for these lines.
Example: A softer green color with a thinner line width might be chosen to subtly indicate hidden bullish divergences, keeping the chart clean while providing useful information.
H. Bearish Div Label: Default: False
What it is: An option to display labels for hidden bearish divergences.
What it does: Enables or disables the visibility of labels that mark hidden bearish divergences, where the price makes a lower high while the RSI makes a higher high, indicating potential continuation of a downtrend.
Example: A trader might use this to confirm an existing downtrend when a hidden bearish divergence signals continued selling pressure.
Hidden Bearish Label Color, Line Width, and Line Color:
What it is: Settings to customize the appearance of hidden bearish divergence labels.
What it does: Allows you to choose the color of the labels, adjust the width of the divergence lines, and select the color for these lines.
Example: A muted red color with a thinner line width might be selected to indicate hidden bearish divergences without overwhelming the chart.
Divergence Text Size and Color: Default: S (Small)
What it is: Settings to adjust the size and color of text labels for RSI divergences.
What it does: Allows you to customize the size and color of text labels that display the divergence information on the chart.
Example: Choosing a small text size with a bright white color can make divergence labels easily readable without taking up too much space on the chart.
STOCHASTIC DIVERGENCES
Display of Stochastic RSI Divergence Labels:
Display of Stochastic RSI Divergence Settings:
Stochastic RSI Divergence Explanation
Stochastic RSI divergences occur when the Stochastic RSI indicator and price action move in opposite directions, signaling potential trend reversals. These settings allow traders to customize the detection and visual representation of both regular and hidden bullish and bearish divergences in the Stochastic RSI.
Stochastic RSI Divergence Input Settings:
R. Bullish Div Label: Default: True
What it is: An option to display labels for regular bullish divergences in the Stochastic RSI.
What it does: Enables or disables the visibility of labels that mark regular bullish divergences, where the price makes a lower low while the Stochastic RSI makes a higher low, indicating a potential upward reversal.
Example: A trader might use this to spot buying opportunities in a downtrend when a bullish divergence in the Stochastic RSI suggests the trend may be reversing.
Bullish Label Color, Line Width, and Line Color:
What it is: Settings to customize the appearance of regular bullish divergence labels in the Stochastic RSI.
What it does: Allows you to choose the color of the labels, adjust the width of the divergence lines, and select the color for these lines.
Example: Selecting a blue label color and a distinct line width makes bullish divergences in the Stochastic RSI easily recognizable on your chart.
R. Bearish Div Label: Default: True
What it is: An option to display labels for regular bearish divergences in the Stochastic RSI.
What it does: Enables or disables the visibility of labels that mark regular bearish divergences, where the price makes a higher high while the Stochastic RSI makes a lower high, indicating a potential downward reversal.
Example: A trader might use this to spot selling opportunities in an uptrend when a bearish divergence in the Stochastic RSI suggests the trend may be reversing.
Bearish Label Color, Line Width, and Line Color:
What it is: Settings to customize the appearance of regular bearish divergence labels in the Stochastic RSI.
What it does: Allows you to choose the color of the labels, adjust the width of the divergence lines, and select the color for these lines.
Example: Choosing an orange label color and a specific line width makes bearish divergences in the Stochastic RSI clearly stand out on your chart.
H. Bullish Div Label: Default: False
What it is: An option to display labels for hidden bullish divergences in the Stochastic RSI.
What it does: Enables or disables the visibility of labels that mark hidden bullish divergences, where the price makes a higher low while the Stochastic RSI makes a lower low, indicating potential continuation of an uptrend.
Example: A trader might use this to confirm an existing uptrend when a hidden bullish divergence in the Stochastic RSI signals continued buying strength.
Hidden Bullish Label Color, Line Width, and Line Color:
What it is: Settings to customize the appearance of hidden bullish divergence labels in the Stochastic RSI.
What it does: Allows you to choose the color of the labels, adjust the width of the divergence lines, and select the color for these lines.
Example: A softer blue color with a thinner line width might be chosen to subtly indicate hidden bullish divergences, keeping the chart clean while providing useful information.
H. Bearish Div Label: Default: False
What it is: An option to display labels for hidden bearish divergences in the Stochastic RSI.
What it does: Enables or disables the visibility of labels that mark hidden bearish divergences, where the price makes a lower high while the Stochastic RSI makes a higher high, indicating potential continuation of a downtrend.
Example: A trader might use this to confirm an existing downtrend when a hidden bearish divergence in the Stochastic RSI signals continued selling pressure.
Hidden Bearish Label Color, Line Width, and Line Color:
What it is: Settings to customize the appearance of hidden bearish divergence labels in the Stochastic RSI.
What it does: Allows you to choose the color of the labels, adjust the width of the divergence lines, and select the color for these lines.
Example: A muted orange color with a thinner line width might be selected to indicate hidden bearish divergences without overwhelming the chart.
Divergence Text Size and Color: Default: S (Small)
What it is: Settings to adjust the size and color of text labels for Stochastic RSI divergences.
What it does: Allows you to customize the size and color of text labels that display the divergence information on the chart.
Example: Choosing a small text size with a bright white color can make divergence labels easily readable without taking up too much space on the chart.
Alert System:
Custom Alerts for Divergences and Reversals:
What it is: The script includes customizable alert conditions to notify you of detected divergences or potential reversals based on WaveTrend, RSI, and Stochastic RSI.
What it does: Helps you stay informed of key market movements without constantly monitoring the charts, enabling timely decisions.
Example: Setting an alert for regular bearish divergence on the WaveTrend could notify you of a potential sell opportunity as soon as it is detected.
How to Use Alerts:
Set up custom alerts in TradingView based on these conditions to be notified of potential trading opportunities. Alerts are triggered when the indicator detects conditions that match the selected criteria, such as divergences or potential reversals.
By following the detailed guidelines and examples above, you can effectively use and customize this powerful indicator to suit your trading strategy.
For further understanding and customization, refer to the input settings within the script and adjust them to match your trading style and preferences.
How Components Work Together
Synergy and Cross-Validation: The indicator combines multiple layers of analysis to validate trading signals. For example, a WaveTrend buy signal that coincides with a bullish divergence in RSI and positive fast money flow is likely to be more reliable than any single indicator’s signal. This cross-validation reduces the likelihood of false signals and enhances decision-making.
Comprehensive Market Analysis: Each component plays a role in analyzing different aspects of the market. WaveTrend focuses on trend strength, Money Flow indicators assess market sentiment, while RSI and Stochastic RSI offer detailed views of price momentum and potential reversals.
Ideal For
Traders who require a reliable, multifaceted tool for detecting market trends and reversals.
Investors seeking a deeper understanding of market dynamics across different timeframes and conditions, whether in forex, equities, or cryptocurrency markets.
This script is designed to provide a comprehensive tool for technical analysis, combining multiple indicators and divergence detection into one versatile and customizable script. It is especially useful for traders who want to monitor various indicators simultaneously and look for convergence or divergence signals across different technical tools.
Acknowledgements
Special thanks to these amazing creators for inspiration and their creations:
I want to thank these amazing creators for creating there amazing indicators , that inspired me and also gave me a head start by making this indicator! Without their amazing indicators it wouldn't be possible!
vumanchu: VuManChu Cipher B Divergences.
MisterMoTa: RSI + Divergences + Alerts .
DevLucem: Plain Stochastic Divergence.
Note
This indicator is designed to be a powerful tool in your trading arsenal. However , it is essential to backtest and adjust the settings according to your trading strategy before applying it to live trading . If you have any questions or need further assistance, feel free to reach out.

Preday Price ChannelPreday Price Channel Indicator
This indicator is designed to help traders easily observe and capitalize on key price levels and their implications on market trends. It displays the previous day's high and low prices, as well as lines representing Fibonacci ratios between these prices. When a high or low is double-broken (retested and broken again), the indicator confirms a trend change and fills the channel with orange or navy color to visually indicate this shift.
Before a large directionality appears in the market, a breakout of the previous day's high or low must occur in that direction. As long as the previous day's low is maintained, an uptrend persists, and as long as the previous day's high is maintained, a downtrend persists.
In the crypto market, the significance of the previous day's high or low is often underemphasized and less known. This simple indicator was created to help traders observe the powerful influence of the previous day's high and low, and to potentially use it to their advantage in trading.
Wishing you successful trading with this tool.
Options
Day Open: Check this box to display the current day's opening price on the chart. The opening price of the day often remains intact and is one of the simplest and most powerful indicators of whether the day's trend is upward or downward.
Preday Open: Check this box to display the previous day's opening price on the chart. The previous day's opening price often exhibits a strong tendency for retests.
Preday High and Low: Check this box to display the previous day's high and low prices on the chart. These levels are critical for determining potential breakout points.
FIB On: Check this box to display the Fibonacci ratios between the previous day's high and low prices. This feature helps identify potential support and resistance levels within this range.
Day Mid On: Check this box to display the midpoint of the preday's price range on the chart. This serves as a reference point for trend changes.
Day Trend Color On: Check this box to enable color-coding for uptrends and downtrends based on the previous day's high and low prices.
When the previous day's high is breached, the trend value is set to 2, and an orange shaded area is filled in.
When the previous day's low is breached, the trend value is set to -2, and a navy shaded area is filled in.
When a high or low is double-broken (retested and broken again), the indicator confirms the trend change, filling the channel with orange for an uptrend and navy for a downtrend to make it easy for users to recognize the trend change.
These trend values and colors remain as long as the midpoint of the previous day's price range is not violated, indicating the trend is still valid.
If, during a downtrend (trend value of -2), the low price crosses above the previous day's midpoint, the trend value changes to 1, indicating a potential issue in the downtrend, and a light orange color is displayed.
Conversely, if, during an uptrend (trend value of 2), the high price crosses below the previous day's midpoint, the trend value changes to -1, signaling a potential issue in the uptrend, and a light navy color is displayed.
This comprehensive set of features allows traders to make informed decisions by clearly observing key price levels and their implications on market trends.

HTF Descending TriangleHTF Descending Triangle aims at detecting descending triangles using higher time frame data, without repainting nor misalignment issues.
Descending triangles are defined by a falling upper trend line and an horizontal lower trend line. It is a chart pattern used in technical analysis to predict the continuation of a downtrend.
This indicator can be useful if you, like me, believe that higher time frames can offer a broader perspective and provide clearer signals, smoothing out market noise and showing longer-term trends.
You can change the indicator settings as you see fit to tighten or loosen the detection, and achieve the best results for your use case.
Features
It draws the detected descending triangle on the chart.
It supports alerting when a detection occurs.
It allows for setting the higher time frame to run the detection on.
It allows for setting the minimum number of consecutive valid higher time frame bars to fit the pattern criteria.
It allows for setting a low factor detection criteria to apply on higher time frame bars low as a proportion of the distance between the reference bar low and open/close.
It allows for turning on an adjustment of the triangle using highest/lowest values within valid higher time frame bars.
Settings
Higher Time Frame dropdown: Selects higher time frame to run the detection on. It must be higher than, and a multiple of, the chart's timeframe.
Valid Bars Minimum field: Sets minimum number of consecutive valid higher time frame bars to fit the pattern criteria.
Low Factor checkbox: Turns on/off low factor detection criteria.
Low Factor field: Sets low factor to apply on higher time frame bars low as a proportion of the distance between the reference bar low and open/close.
Adjust Triangle checkbox: Turns on/off triangle adjustment using highest/lowest values within valid higher time frame bars.
Detection Algorithm Notes
The detection algorithm recursively selects a higher time frame bar as reference. Then it looks at the consecutive higher time frame bars (as per the requested number of minimum valid bars) as follows:
High must be lower than previous bar.
Open/close min value must be higher than reference bar low.
When low factor criteria is turned on, low must be lower than reference bar open/close min value minus low factor proportion of the distance between reference bar low and open/close min value.

Inside Bars/Candles [CodeCraftedTrading]This Pine Script indicator is designed to identify and visually represent inside bars or candles. Here's a breakdown of its features and functionality:
1. Inputs:
insideCandlesColor: Color of the inside bars or candles.
highColor: Color of the horizontal line representing the high of the inside bar.
lowColor: Color of the horizontal line representing the low of the inside bar.
showHighLowLabel: Option to display labels for the high and low prices.
2. Logic:
The script checks for the conditions of an inside bar:
high < high and low > low
If an inside bar is detected and is not already in the range:
* Stores the high and low prices of the previous bar.
* Records the parent bar index and sets the broken flag to false.
If the current bar's high exceeds the stored high or the low falls below the stored low, the broken flag is set to true.
If the current bar is within the stored high and low range, it is considered in-range.
The script then dynamically plots horizontal lines at the high and low prices of the parent bar until the inside bar is broken.
3. Visualization:
The inside bars are colored based on the insideCandlesColor.
Horizontal lines are drawn at the high and low prices of the parent bar within the inside bar.
Optional labels display the rounded values of the high and low prices.
4. Usage:
Apply the script to your chart.
Adjust the input parameters according to your preferences.
The indicator will highlight inside bars with colored bars and draw lines representing the high and low prices. Labels are optional.
5. Note:
Inside bars are bars where the entire price range is within the high and low of the previous bar.
The script uses historical bar information and visualizes the inside bars dynamically on the chart.
