Ichimoku Cloud with MACD (By Coinrule)The Ichimoku Cloud is a collection of technical indicators that show support and resistance levels, as well as momentum and trend direction. It does this by taking multiple averages and plotting them on a chart. It also uses these figures to compute a “cloud” that attempts to forecast where the price may find support or resistance in the future.
The Ichimoku Cloud was developed by Goichi Hosoda, a Japanese journalist, and published in the late 1960s. It provides more data points than the standard candlestick chart. While it seems complicated at first glance, those familiar with how to read the charts often find it easy to understand with well-defined trading signals.
The Ichimoku Cloud is composed of five lines or calculations, two of which comprise a cloud where the difference between the two lines is shaded in.
The lines include a nine-period average, a 26-period average, an average of those two averages, a 52-period average, and a lagging closing price line.
The cloud is a key part of the indicator. When the price is below the cloud, the trend is down. When the price is above the cloud, the trend is up.
The above trend signals are strengthened if the cloud is moving in the same direction as the price. For example, during an uptrend, the top of the cloud is moving up, or during a downtrend, the bottom of the cloud is moving down.
The MACD is a trend following momentum indicator and provides identification of short-term trend direction. In this variation it utilises the 12-period as the fast and 26-period as the slow length EMAs, with signal smoothing set at 9.
This strategy combines the Ichimoku Cloud with the MACD indicator to better enter trades.
Long/Short orders are placed when three basic signals are triggered.
Long Position:
Tenkan-Sen is above the Kijun-Sen
Chikou-Span is above the close of 26 bars ago
Close is above the Kumo Cloud
MACD line crosses over the signal line
Short Position:
Tenkan-Sen is below the Kijun-Sen
Chikou-Span is below the close of 26 bars ago
Close is below the Kumo Cloud
MACD line crosses under the signal line
The script is backtested from 1 June 2022 and provides good returns.
The strategy assumes each order is using 30% of the available coins to make the results more realistic and to simulate you only ran this strategy on 30% of your holdings. A trading fee of 0.1% is also taken into account and is aligned to the base fee applied on Binance.
This script also works well on MATIC (1h timeframe), AVA (45m timeframe), and BTC (30m timeframe).
Search in scripts for "macd"

Hybrid, Zero lag, Adaptive cycle MACD Backtest (Simple) [Loxx]Simple backtest for Hybrid, Zero lag, Adaptive cycle MACD Backtest (Simple) found here:
What this backtest includes:
-Customization of inputs for MACD calculation
-Take profit 1 (TP1), and Stop-loss (SL), calculated using standard RMA-smoothed true range
-Activation of TP1 after entry candle closes
-Zero-cross entry signal plots
-MACD-Signal cross entry continuations
-Longs and shorts
Happy trading!

Trend Following with Donchian Channels and MACDThis is a trend following system based on the Donchian Channels. Instead of using a simple moving average crossover, this system uses the MACD as the trendfilter:
Long positions:
* Price makes a new 50 day high,
* The MACD-line crosses above or is above the Signal-line.
* Both the MACD and the Signal-lines are above the zero-line.
Short positions:
* Price makes a new 50 day low,
* The MACD-line crosses below or is below the Signal-line.
* Both the MACD and the Signal-lines are below the zero-line.
Stoploss:
The initial and the trailing stoploss are 4 ATRs away from the price.

(Short) EMA200+Parabolic SAR+MACD+TP&SL By Nussara (strategy)This indicator is backtest of “ (Short) EMA 200 + Parabolic SAR + MACD + Take Profit and Stop Loss”
You can simulate trading by setting your own funds and trading fees. And you can adjust various parameter settings to get the results you want.
Exponential Moving Average
Moving averages smooth the price data to form a trend following indicator. They do not predict price direction, but rather define the current direction, though they lag due to being based on past prices. Despite this, moving averages help smooth price action and filter out the noise.
EMA=Price(t)×k+EMA(y)×(1−k)
where:
t=today
y=yesterday
N=number of days in EMA
k=2÷(N+1)
Parabolic SAR
The Parabolic SAR is a technical indicator developed by J. Welles Wilder to determine the direction that an asset is moving. The indicator is also referred to as a stop and reverse system, which is abbreviated as SAR . It aims to identify potential reversals in the price movement of traded assets.
MACD
Moving average convergence divergence ( MACD ) is a trend-following momentum indicator that shows the relationship between two moving averages of a security’s price. The MACD is calculated by subtracting the 26-period exponential moving average ( EMA ) from the 12-period EMA . The result of that calculation is the MACD line. A nine-day EMA of the MACD called the "signal line," is then plotted on top of the MACD line, which can function as a trigger for buy and sell signals. Traders may buy the security when the MACD crosses above its signal line and sell—or short—the security when the MACD crosses below the signal line.
EMA 200 + Parabolic SAR + MACD (Short) formula
1. The price closes below the ema200 line.
2. MACD Line cross down Signal Line"
3. Parabolic SAR above the bar means that it is a downtrend.
If all three are true, the indicator will have a Short signal.
Risk to Reward Ratio = 1:1
Stop loss = Parabolic SAR point.
This indicator is just a tool for technical analysis . It shouldn't be used as the only indication of trade because it causes you to lose your money. You should use other indicators to analyze together.

MACD + CMF + EMA + Supertrend by TradeSmartHello everyone and welcome to our first script release!
This script is one of many upcoming scripts. This one is a test for us, how it works, how you guys like this kind of stuff, and for feedback what we should change/improve at.
SCRIPT IS OPTIMIZED FOR:
EUR/USD 30 MINUTE TIMEFRAME
Video of the Strategy:
Search for “MACD + CMF + 200 EMA + Supertrend Trading Strategy Tested 100 Times with Great Results!” on our channel.
In this video you can find the exact strategy we programmed, just one added feature: Supertrend trailing stop loss. (position gets closed once the price hits the Supertrend indicator)
Now you can modify the following:
MACD settings
Supertrend settings
EMA settings
CMF settings
We will update the script with more and more features.
The first update will be:
Modifiable risk to reward ratio.
I will make a video of how to use this indicator next week, explaining all the features and more!
Hope you like it! Don't forget to let us know what we should change or improve. Thanks, and have a great day!
STRATEGY ENTRY RULES
LONG
When CMF is above 0 and price is under EMA. Also MACD has made a double cross above the zero line (meaning one cross down and one cross up by the MACD line). Then go long!
Note:
MACD or Signal must return under 0 in order to start a new position
If either of the MACD lines touches the 0 line before entry, we skip the trade and wait for the next signal.
SHORT
When CMF is under 0 and price is under EMA. Also MACD has made a double cross under the zero line (meaning one cross up and one cross down by the MACD line). Then go short!
Note:
MACD or Signal must return under 0 in order to start a new position.
If either of the MACD lines touches the 0 line before entry, we skip the trade and wait for the next signal.
TAKE PROFIT
When price hits the exit price (calculated from stop loss with the risk ratio), then exit with 50% of the position. The other 50% will stay open until the price hits the supertrend or the base stop loss.
STOP LOSS
When price hits stop loss then exit the position. Stop loss is calculated from the Supertrend and it is a trailing one, meaning it changes based on the movement of the price.
QUANTITY TO BUY
The quantity to buy is based on the Risk Per Trade % attribute. This means that we can set how much money we want to risk on one trade. Meaning that if we lose that particular position, then a Risk Per Trade % value of our equity will be lost.
Example: if you set the Risk Per Trade % to 1 % and you have a 100$ account balance, then if you loose the trade you will loose 1$ max.

MACD Price Projected Bands [MPPB] Strategy for NIFTY / BTC 2 minMACD Price Projected Bands is an intraday NON REPAINTING Strategy to be used over BTCUSD and NIFTY on 2mins charts for optimum results!!
How the Strategy works
The strategy uses MACD with standard configuration as its main component.
The adaptive Bands are calculated over the MACD lookback, and MACD crosses of the adaptive bands are projected over the Price for creating a decision logic
A cyclic Trend Filter is used to calculate the Optimum Entry and Exit Points for the Strategy,
Levels are also plotted over the price projected bands for better visualisation of the targets!
What is used !
Macd_config : { fast:12 , slow:26 , signal:9 }
Lookback Length : 55
The Strategy has Provision for Alerts
You get Two signals
1. MPPBS Buy Signal
2. MPPBS Sell Signal
How the Visual Target System Works and How to trade Using this Strategy
An Adaptive Projected Band is constructed using MACD for traders to get Visual inputs regarding targets!!
The Trading Methodologies are in below Charts
For Short Trades
For Long Trades
Strategy Configurations for Backtest
For Englishmen!
The Backtesting Rules in the Strategy calculates only when order gets filled, the basic pyramiding in the strategy is set to 1, i.e The maximum number of entries allowed in the same direction is set to 1,
Also we trade only 1 quantity of the security with initial capital of 100000USD, and The commission type used in the strategy is set to 0.05 USD that means we pay 0.05USD as commissions in every trade!
For Coders!
{
calc_on_order_fills=true,
pyramiding=1,
default_qty_type=strategy.fixed,
default_qty_value=1,
initial_capital=100000,
currency=currency.USD,
commission_type= strategy.commission.cash_per_order,
commission_value = 0.05
}
How can you get access
Only do private message to me, donot use comment box for requesting access!

MACD Strategy KMACK Rev 1.1Hull smoothed 45/10 macd
Please note that the macd/rsi values do not print unless the current day is Monday-Friday and the market will be open.
14 period hull smoothed rsi marks the rsi value at each macd reversal and will not signal a long position above 70 or a short position below 30
Macd and rsi will only display on the current day and will only display the last 2 hours
Lit candles occur after 0920 nyse time
Alerts or entries will only fire after 0931 nyse time
Entry signal will confirm with the 5 minute candle.
Long entry requires the current 5 minute candle to close>=hlc3
Short entry requires the current 5 minute candle to close<=hlc3
Buy/sell alerts will only fire in the last 10 seconds of the realtime (current) bar
Options:
Select bias
Modify macd lookback period(s)
Alerts:
Buy
Sell
Rsi crossing into the power region (60)
Rsi crossing into the weakness region (40)
Current strategy exits position upon signal opposite to selected bias, this is for simplicity.
There are currently no add-on strat signals but the alerts/lit candles will fire
Successful trades average >55% with an average profit factor of 3%
Net profit averages 3%
Max drawdown averages below 0.25%
Added order size input
Added show/hide strat signals. Still lights the bars green/red. Make sure your bar color setting in tv is set to a transparent color so you can see the bright reds and greens.
Added a couple lines of code that fire the alert/strat if macd reverses and the corresponding 5min candle does not agree and the following candle does agree. Added an average of 1.5% winning trades.
Message me for free trial access
MACD Bull Crossover and RSI Oversold 5 Candles Ago-Long StrategyHello everyone, I've been having a great time perfecting this strategy for a few weeks now. I finally feel like it's time to release it to the public and share what I have been working on.
This strategy only enters a long trade when the MACD crosses over the signal line and the RSI was oversold looking back 5 candles ago. The logic behind this is to wait for RSI to enter the oversold territory, and then when the market starts to recovery the MACD will crossover telling us the sell off is over.
This strategy will close once these 2 conditions are met.
1. MACD Histogram is above 0 and MACD crosses under the signal line.
2. RSI was overbought 5 previous candles ago.
In the strategies settings, you'll be able to enable visual stop-loss and profit levels and change those levels to what you like, enable up to 5 EMA'S,
ADDONS That Affect Strategy:
* Enable visual stop-loss and profit levels as soon as a buy signal is triggered.
* Modify stop-loss and profit levels.
* Modify RSI oversold and RSI overbought levels.
* Modify MACD Fast and Slow moving average.
ADDONS That Do Not Affect Strategy:
* Enable up to 5 EMA's. (This will not affect strategy, and is the only purpose is for people who like following EMA's.)
Thank you for taking the time to try my strategy. I hope you have the best success. I will be making a short strategy, and alerts for this strategy soon. Follow me for updates!

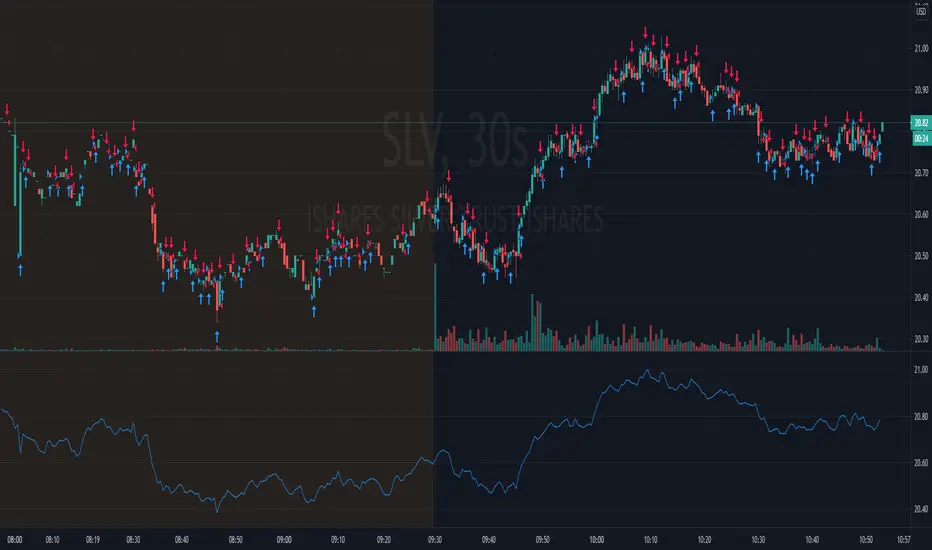
MACD Multi-MA StrategyThis script applies the average of each major MA (SMA, RMA, EMA, WVMA, WMA) to the MACD formula.
The logic is simple. When all 5 MA's are in agreement in direction, then then script will notify users of change.
I posted this as a strategy to help show how logic does in back test. If you use my simple yet effective solution to find take profit locations, you can blow this back testing out of the water!!!
To set alerts simply turn script into study
//@version=2
study(title="MACD Multi-MA Study", overlay=false)
src = close
len1 = input(8, "FAST LOOKBACK")
len2 = input(144, "SLOW LOOKBACK")
/////////////////////////////////////////////
length = len2-len1
ma = vwma(src, length)
plot(ma, title="VWMA", color=lime)
length1 = len2-len1
ma1 = rma(src, length1)
plot(ma1, title="RMA", color=purple)
length2 = len2-len1
ma2 = sma(src, length2)
plot(ma2, title="SMA", color=red)
length3 = len2-len1
ma3 = wma(src, length3)
plot(ma3, title="WMA", color=orange)
length4 = len2-len1
ma4 = ema(src, length4)
plot(ma4, title="EMA", color=yellow)
long = ma > ma and ma1 > ma1 and ma2 > ma2 and ma3 > ma3 and ma4 > ma4
short = ma < ma and ma1 < ma1 and ma2 < ma2 and ma3 < ma3 and ma4 < ma4
alertcondition(long == true, title='MACD LONG SIGNAL', message='MACD LONG!')
alertcondition(short == true, title='MACD SHORT SIGNAL', message='MACD SHORT!')
GBPJPY MACD 1min Long OnlyThis MACD indicator uses two lines for long and sell long. It also uses a MACD indicator line with a historian. When the MACD historian crosses over the buy line, a long signal is executed. When the MACD historian crosses over the sell line, a close entry is signal is executed. There is a also a built in stop loss and you can adjust the buy and sell lines accordingly.
This does not repaint and I use it for autoview with an alert to autotrade this strategy.

GBPUSD MACD 1min Long OnlyThis MACD indicator uses two lines for long and sell long. It also uses a MACD indicator line with a historian. When the MACD historian crosses over the buy line, a long signal is executed. When the MACD historian crosses over the sell line, a close entry is signal is executed. There is a also a built in stop loss and you can adjust the buy and sell lines accordingly.
This does not repaint and I use it for autoview with an alert to autotrade this strategy.

EURUSD MACD 1 min Long OnlyThis MACD indicator uses two lines for long and sell long. It also uses a MACD indicator line with a historian. When the MACD historian crosses over the buy line, a long signal is executed. When the MACD historian crosses over the sell line, a close entry is signal is executed. There is a also a built in stop loss and you can adjust the buy and sell lines accordingly.
This does not repaint and I use it for autoview with an alert to autotrade this strategy.

MACD + RSI + EMA + BB + ATR Day Trading StrategyEntry Conditions and Signals
The strategy implements a multi-layered filtering approach to entry conditions, requiring alignment across technical indicators, timeframes, and market conditions .
Long Entry Requirements
Trend Filter: Fast EMA (9) must be above Slow EMA (21), price must be above Fast EMA, and higher timeframe must confirm uptrend
MACD Signal: MACD line crosses above signal line, indicating increasing bullish momentum
RSI Condition: RSI below 70 (not overbought) but above 40 (showing momentum)
Volume & Volatility: Current volume exceeds 1.2x 20-period average and ATR shows sufficient market movement
Time Filter: Trading occurs during optimal hours (9:30-11:30 AM ET) when market volatility is typically highest
Exit Strategies
The strategy employs multiple exit mechanisms to adapt to changing market conditions and protect profits :
Stop Loss Management
Initial Stop: Placed at 2.0x ATR from entry price, adapting to current market volatility
Trailing Stop: 1.5x ATR trailing stop that moves up (for longs) or down (for shorts) as price moves favorably
Time-Based Exits: All positions closed by end of trading day (4:00 PM ET) to avoid overnight risk
Best Practices for Implementation
Settings
Chart Setup: 5-minute timeframe for execution with 15-minute chart for trend confirmation
Session Times: Focus on 9:30-11:30 AM ET trading for highest volatility and opportunity

Range Strat - MACD/RSIThis strategy uses a trend based indicator (MACD) for entry/exit signals with a momentum oscillator (RSI) to act as confirmation. Although relying on a trend based indicator this has been created for range bound crypto markets, which have been in a period of chop since June 2022.
Long/Short signals are generated from MACD with the RSI oscillator thresholds suppressing entries at price extremes. This is not a mean reversion RSI strategy! As the indicators are contrary to each other you will need to be generous with the RSI settings in order for signals to trigger.
Strategy is designed for use on the 4h timeframe, it may work well on higher timeframes, but lower time frames will lead to false signals. Use fixed percentage of equity for order size to capture the compounding effect. As a reversal strategy bear in mind that should market trend strongly in either direction stops will be required.
The RSI thresholds can be tailored to provide higher frequency or safer signals. Similarly tweaking MACD settings will provide earlier/more frequent or safer signals. As this is intended to enter near range high / low you should check the visual cues to ensure a ping-pong effect is observed, so that peaks and troughs are captured. Once an observable range is established the strategy works well across a range of crypto markets,
The script is open source, so feel free to amend as you wish. Using a different momentum oscillator may provide better results. I have prior coding experience, but first time using PineScript was last night, so it's not very tidy. I will update this with some additional customisation and TP/SL in the near future.
Usage: Range bound markets
Markets: Cryptocurrency Alts/BTC/ETH
Timeframe: 4h

Inverse MACD + DMI Scalping with Volatility Stop (By Coinrule)This script is focused on shorting during downtrends and utilises two strength based indicators to provide confluence that the start of a short-term downtrend has occurred - catching the opportunity as soon as possible.
This script can work well on coins you are planning to hodl for long-term and works especially well whilst using an automated bot that can execute your trades for you. It allows you to hedge your investment by allocating a % of your coins to trade with, whilst not risking your entire holding. This mitigates unrealised losses from hodling as it provides additional cash from the profits made. You can then choose to hodl this cash, or use it to reinvest when the market reaches attractive buying levels.
Alternatively, you can use this when trading contracts on futures markets where there is no need to already own the underlying asset prior to shorting it.
ENTRY
The trading system uses the Momentum Average Convergence Divergence (MACD) indicator and the Directional Movement Index (DMI) indicator to confirm when the best time is for selling. Combining these two indicators prevents trading during uptrends and reduces the likelihood of getting stuck in a market with low volatility.
The MACD is a trend following momentum indicator and provides identification of short-term trend direction. In this variation it utilises the 12-period as the fast and 26-period as the slow length EMAs, with signal smoothing set at 9.
The DMI indicates what way price is trending and compares prior lows and highs with two lines drawn between each - the positive directional movement line (+DI) and the negative directional movement line (-DI). The trend can be interpreted by comparing the two lines and what line is greater. When the negative DMI is greater than the positive DMI, there are more chances that the asset is trading in a sustained downtrend, and vice versa.
The system will enter trades when two conditions are met:
1) The MACD histogram turns bearish.
2) When the negative DMI is greater than the positive DMI.
EXIT
The strategy comes with a fixed take profit combined with a volatility stop, which acts as a trailing stop to adapt to the trend's strength. Depending on your long-term confidence in the asset, you can edit the fixed take profit to be more conservative or aggressive.
The position is closed when:
Take-Profit Exit: +8% price decrease from entry price.
OR
Stop-Loss Exit: Price crosses above the volatility stop.
In general, this approach suits medium to long term strategies. The backtesting for this strategy begins on 1 April 2022 to 18 July 2022 in order to demonstrate its results in a bear market. Back testing it further from the beginning of 2022 onwards further also produces good returns.
Pairs that produce very strong results include SOLUSDT on the 45m timeframe, MATICUSDT on the 2h timeframe, and AVAUSDT on the 1h timeframe. Generally, the back testing suggests that it works best on the 45m/1h timeframe across most pairs.
A trading fee of 0.1% is also taken into account and is aligned to the base fee applied on Binance.

5min MACD scalp by JoelThis strategy is inspired by a youtuber called Joel on Crypto. He trades this using Ema, MACD indicators and his own experience. For more information, check out his Best Crypto Scalping Strategy for the 5 Min Time Frame video. I have tried to automate this a little.
Long or Short trades are determined with a crossing of the fast Ema over the slow Ema for Long and the opposite for Short. Trades should only happen close to the crossovers. Then for Long we use the MACD indicator with a 1min TF (I had better results using the 5min) where we look for high peaks in negative values for Long and vice versa for Shorts. These should be significantly higher than other peaks (or if you will lower peaks for a Long).
Hence, the key is to detect high peaks on the histogram, which I try to achieve by checking if the last 2 values were higher than X bars back. If you want to make it even more specific, then you can turn on the additional checkbox which compares the current value to the average value of X bars back, and if it is greater than, say, 50% the value of the average (= 1.5x the average), then it's ok for the trade.
I also noticed that the strategy often bought at the top or bottom, so I added a check that compares whether the last evaluated bar is the first rising bar (for Long) or falling bar (for Short). This can be turned on or off.
Target profit 0,5% and stop loss 0,4% are based on his recommendation. The strategy is set to take only 1 trade at a time , and you can have a back tester table on.
I'm still a pine script beginner, so the strategy is certainly not perfect and could be improved. If you have any tips on how to improve it further, please let me know. I will try to update it when I have time.
I would also like to thank Joel on Crypto for sharing the strategy and @ZenAndTheArtOfTrading for his great library and code (thanks to him we have a back tester table in here), but especially his educational videos on youtube, which taught me a lot about pine script.
Crypto Scalper Divergence Macd Psar Ema 200This is a very efficient crypto scalper adapted to very short timeframes, however it can be optimized for other timeframes and assests as well.
Its components are
MACD
P SAR
EMA 200
Risk management
Rules for entry:
For short : we have an uptrend on PSAR , histogram is positive (divergence MACD) and close of a candle is below EMA 200
For long : we dont have an uptrend on PSAR, histogram is negative(divergence MACD) and close of a candle is above EMA 200
Rules for exit:
We exit when we either find a reverse condition than the entry one, or based on stop loss/take profit that are calculated on % movements of the price.
If you have any questions, let me know !

Chaikin Money Flow + MACD + ATRHere I present you on of Trade Pro's Trading Idea: Chaikin Money Flow + MACD + ATR.
This strategy is not as profitable as it can be seen in one of his videos. In the forex market, the strategy could reach a maximum of 35% profitability.
I have, as some of my followers have requested, created an overview of the current position, risk and leverage settings in the form of a table.
Furthermore, one can again swap between short and long positions.
It is now possible to select or deselect individual indicators.
I have chosen the ATR alone as a take profit stop loss, as in his strategy.
A position is only triggered as soon as all prerequisites have been fulfilled and a command is executed. This prevents false triggering by bots and repainting.
-----------------------------------------------------------------------------------
How does the strategy work?
ENTRY
Long
The MACD indicator must be above the zero line.
Then the K line must cross the D line.
Finally, when this happens, the Money Flow Index must be above the zero line.
Short
Contrary to the premise of long positions.
EXIT
ATR Exit
The value of ATR at the time of buying is multiplied by the value entered in "Profit factor ATR" and "Stop factor ATR". As soon as the price reaches this value, it is closed.
Important
The script must be optimized for each coin or currency pair.
I will publish a guide to the strategy shortly. There I will explain how the table works and how to set the strategy correctly.
The results of the strategy are without commissions and leverage.
If you have any questions or feedback, please let me know in the comments.

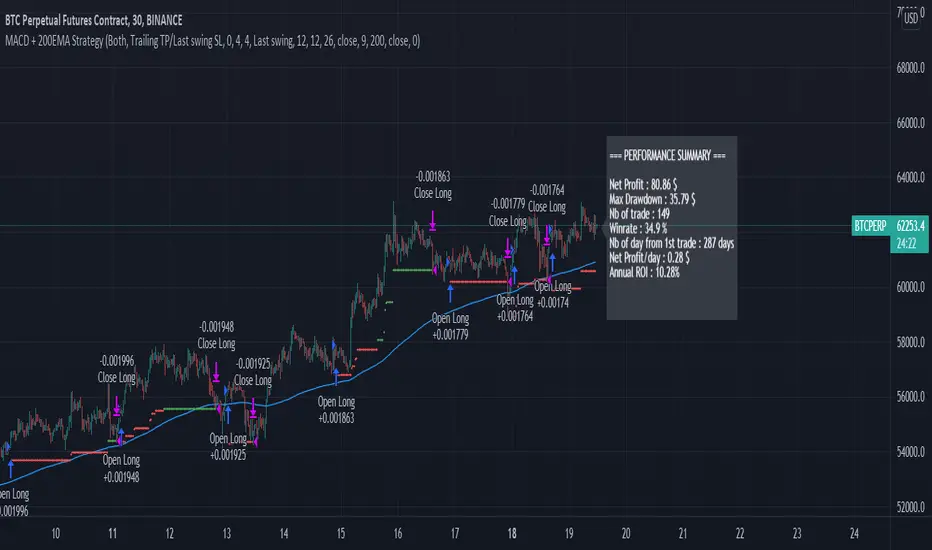
Simple MACD + 200EMA StrategyThis script is based on classic MACD / 200EMA strategy.
It takes a Long trade when MACD line crossup Signal line, when both below Zero line, and Close price above 200 EMA.
It takes a Short trade when MACD line crossdown Signal line, when both above Zero line, and Close price below 200 EMA
It seems to have decent results with 1:1.5 Risk/Reward, with 30min TF (on cryptocurrency market)
It has a number of 1 per day on average.
FEATURES
ORDERS
You can have both Long and Short, or disable one.
STOPLOSS
Stoploss is based on last swing (high or low). You can adjust the lookback period of the swing.
TAKE PROFIT
For now, there is 2 possibilities for TP :
Using adjustable Risk/Reward ratio (Trailing Stoploss need to be at 0)
Using adjustable Trailing Stoploss percentage (RR Ratio need to be at 0)
Results below are with this parameters :
Start date 01/01/2021
1:1.5 RR ratio
100USD Initial capital
100USD Order Size
0.01% Commission fees.
MACD Crossover trend strategy, Long and ShortHey everybody,
This is my first strategy and script I wrote mostly myself. There's tons of content out there to learn how to code in Pinescript and it's exactly what I wanted and needed in this time of my life.
In any case, I made a rather simple MACD crossover strategy that only takes trades in the direction of both EMA and SMA (there are inputs to change the length of the moving averages and lots of other stuff too).
If the MACD line crosses upwards on the signal line, while above the zero point of the histogram and the price is above EMA + SMA , it's a long signal.
If the MACD line cosses downards on the signal line, while below zero on the histogram and the price is below EMA + SMA , it's a short signal.
There are a lot of default variables that make no sense, for basically any symbol you're going to be looking at. You're going to have to adjust the EMA , SMA , backtest date, take profit, stop loss and all that good stuff yourself to find decently profitable parameters.
I made this myself because I couldn't really find a strategy out there that allowed for so much customizing and it's an easy way to get started in Pinescript.
If you have any suggestions, tips or you see a flatout mistake in my code, please let me know. I'm still learning, everyday and I'm enjoying every second of it.

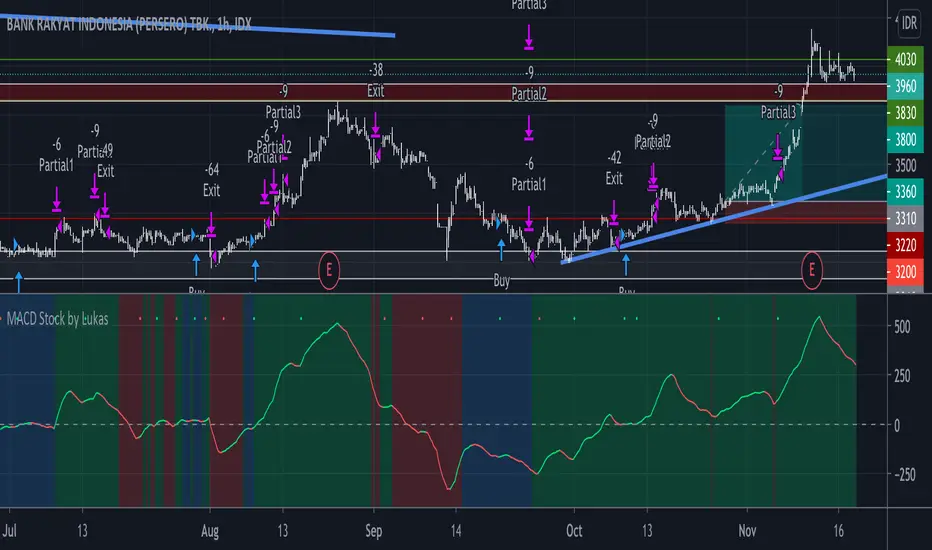
Strategy MACD Stock by LukasHello guys, long time no update.
This time I make strategy for Stock,
The strategy is for LONG only because where I live I can not Short Stock (Indonesia :) )
Basically I combine MACD, DEMA, RSI and EMA.
I try 1D, 4H, 1H and it's perfect for me, when you play higher timeframe try to turn "ON" "Filter" on the menu setting.
RED GREEN line is represent MACD
YELLOW ORANGE line represent Bull and Bear, useful when you play on high timeframe.
There is also setting for Stop Loss and Take Profit level.
Please give it try and give me some feedback.
Hope its useful,
Stay safe everyone :)
Simple and efficient MACD crypto strategy with risk managementToday I am glad to bring you another great creation suited for crypto markets.
MARKET
Its a simple and efficient strategy, designed for crypto markets( btcusd , btcusdt and so on), and suited for for higher time charts : like 1hour, 4hours, 1 day and so on.
Preferably to use 1h time charts.
COMPONENTS
MACD with simple moving average
ENTRY DESCRIPTION
For entries we have :
We check the direction with MACD . Depending if its an uptrend and positive level on histogram of MACD we go long, otherwise we go short.
RISK MANAGEMENT
In this strategy we use a stop loss based on our equity. For this example I choosed a 2% risk .That means if our account has 100.000 eur, it will automatically close the trade if we lose 2.000.
We dont use a take profit level.
In this example also we use a 100.000 capital account, risking 5% on each trade, but since its underleveraged, we only use 5000 of that ammount on every trade. With leveraged it can be achieved better profits and of course at the same time we will encounter bigger losses.
The comission applied is 5$ and a slippage of 5 points aswell added.
For any questions or suggestions regarding the script , please let me know.

High/low crypto strategy with MACD/PSAR/ATR/EWaveToday I am glad to bring you another great creation of mine, this time suited for crypto markets.
MARKET
Its a high and low strategy, designed for crypto markets( btcusd , btcusdt and so on), and suited for for higher time charts : like 1hour, 4hours, 1 day and so on.
Preferably to use 1h time charts.
COMPONENTS
Higher high and lower low between different candle points
MACD with simple moving average
PSAR for uptrend and downtrend
Trenddirection made of a modified moving average and ATR
And lastly elliot wave oscillator to have an even better precision for entries and exits.
ENTRY DESCRIPTION
For entries we have : when the first condition is meet(we have a succession on higher high or lower lows), then we check the macd histogram level, then we pair that with psar for the direction of the trend, then we check the trend direction based on atr levels with MA applied on it and lastly to confirm the direction we check the level of elliot wave oscillator. If they are all on the same page we have a short or a long entry.
STATS
Its a low win percentage , we usually have between 10-20% win rate, but at the same time we use a 1:30 risk reward ratio .
By this we achieve an avg profit factor between 1.5- 2.5 between different currencies.
RISK MANAGEMENT
In this example, the stop loss is 0.5% of the price fluctuation ( 10.000 -> 9950 our sl), and tp is 15% (10.000 - > 11500).
In this example also we use a 100.000 capital account, risking 5% on each trade, but since its underleveraged, we only use 5000 of that ammount on every trade. With leveraged it can be achieved better profits and of course at the same time we will encounter bigger losses.
The comission applied is 5$ and a slippage of 5 points aswell added.
For any questions or suggestions regarding the script , please let me know.
