advanced MACD strategy(lirshah)advanced MACD strategy has been derived from MACD strategy, The lag parameter of that enabled the strategy to makes entry at the peaks and as the results more profitability.
macd strategy shows good results on H1 and daily time frame and has the best performance in crypto-currencies.
Search in scripts for "macd"

NGRN MACD-X & RSI v2 STRATEGYMACD-X, RSI & Volume Indicator Strategy - Version 2.0
Overview
This strategy and it's associated study were modeled after the famous Philakone described algorithms on his now defunct instructional video series.
This indicator allows for full customisation of parameters and interaction between three indicators that allow users to shape their trading methods to their desired goals.
This associated strategy also allows users to backtest the study alerts script and find the best settings towards that end.
MACD + RSI + VOLUME - are of the most powerful and widely usded indicators, MACD/Histogram crosses, coupled with RSI & Volume increases/decreases will detects areas of deeply oversold / overbought and buys/sells on the reversal
Features
Full customisation - All parameters are open for customising to allow the trader to build their own strategy and adapt from market to market.
Toggle Buying and Selling, or have them both active at the same time.
Toggle off and on ALTERNATING Buy and Sell feature to allow for consecutive DCA style buys or SCALING out of an entry (partial sell).
Access
Full Access is 0.07 ETH, one time fee for full unlimited access to the indicator, strategy and future updates as well as support and SETTINGS for various markets on the Binance Exchange (currently only USDT)

Ergotic MACD Strategy Backtest This is one of the techniques described by William Blau in his book
"Momentum, Direction and Divergence" (1995). If you like to learn more,
we advise you to read this book. His book focuses on three key aspects
of trading: momentum, direction and divergence. Blau, who was an electrical
engineer before becoming a trader, thoroughly examines the relationship
between price and momentum in step-by-step examples. From this grounding,
he then looks at the deficiencies in other oscillators and introduces some
innovative techniques, including a fresh twist on Stochastics. On directional
issues, he analyzes the intricacies of ADX and offers a unique approach to help
define trending and non-trending periods.
Blau`s indicator is like usual MACD, but it plots opposite of meaningof
stndard MACD indicator.
You can change long to short in the Input Settings
Please, use it only for learning or paper trading. Do not for real trading.

MACD Alt Peaks & Valleys + SL + BB V6MACD Alt Peaks & Valleys + SL + BB
This strategy uses a custom MACD peak and valley confirmation system to identify high-probability trade signals. It dynamically manages entries, stop losses, and exits with the help of Bollinger Bands to adapt to changing market volatility.
Full Crypto Swing Strategy ALMA Cross with MACDThis is a full crypto swing strategy designed.
From my testing it looks like it perform the best on timeframes 4h +.
The below example has been adapted to BNB/USDT, using the entire period since 2017 until present day, with a comission of 0.03% ( which is the comission for the futures on binance).
Its components are :
ALMA Fast
ALMA Slow
MACD Histogram
Rules for entry
For long, we have a crossover of the fast alma with the slow one and the histogram is ascending.
For short, we have a crossunder of the fast alma with the slow one and the histogram is descending.
Rules for exit
We exit based on a risk management system for TP and SL, or when we receive an opposite condition than the initial one.
Regarding risk management
0.05 = 5% movement
2 = 200% movement
0.001 = 0.1% movement
If you have any questions, let me know !

RSI of MACD Strategy [Long only]This strategy uses the RSI on MACD indicator.
BUY
====
When RSI indicator crossing over 30 or 35 line and price above slow ema
Note: when the position already taken, you may reenter on the purple candle
Partial Exit
==========
Partial profit taking option is available in settings. If this is selected , 1/3 position exited when RSI indicator crossing down 80 line
Close
=====
When RSI indicator crossing below 15
Stop Loss
=========
I havent used hard stop loss in this strategy. Reason is , when price going down , indicator may go up ... so just wanted to ride along with indicator ...
Stop loss mentioned in the settings is used in calculation of how many units can be be purchased based on risk level
Tested with SPY and QQQ ETFs on hourly chart
Warning
=========
For the eductional purposes only ...
This is not a financial advise. please do your own research before taking any trading decission

Ichimoku Cloud & ADX & MACD with TSL [tg1]Hi There! Used the time at home during the corona to learn Pinescript and work on this strategy. Its finetuned for BTCUSDT on mid-high timeframe, can be used for other TF/markets, but be extra careful).
The strategy is mainly build around Ichimoku Kinko Hyo and its Tenkan and Kijun crosses. It aims to only buy/sell when there is a strong trend in any direction (using MAs, ADX and ATR) and enters a trade based on these conditions:
1) Tenkan > Kijun
2) Close > Kumo
3) MACD > Signal
4) ADX > Custom value
The same applies for shorts, just the other way around.
I added a TSL based on either % or ATR fixed % for improved risk management. Let me know if any questions.

Volume Weighted MACDA twist on the traditional MACD indicator.
Volume-Weighted Moving Averages are used instead of the traditional EMAs.

MACD Strategy by ForbesStrategy นี้เขียนขึ้นมาจากบทความของนิตยสารธุรกิจ ชื่อดัง Forbes
สำหรับผู้ที่อยากอ่านสามารถค้นหาได้โดยใช้คำค้นว่า Bitcoin Trading Strategy For Passive Investors
สำหรับผู้ทีจะทอสอบ backtest ให้ตั้งค่า commission (หรือค่าธรรมเนียมการเทรดด้วย) เพื่อให้ผลลัพท์ใกล้เคียงกับความเป็นจริงมากที่สุด
อย่างไรก็ตามจากการ backtest นั้น พบว่า Strategy นี้เหมาะกับ Timeframe Day มากที่สุด และโดยส่วนตัวคิดว่าเหมาะสำหรับการซื้อขายแบบ Spot เท่านั้น

Ergotic MACD Strategy [forked from HPotter]Ergotic MACD Strategy forked from HPotter
In addition to this fine script you will find some additional features:
- Backtester
- Alerts
- Filters: RSI, MFI, Price trend
- Trailing Stop Loss
- Other minor adjustments

Dane: RSI MACD StrategyRSI / MACD Divergence Strategy . Published for customer verification and acceptance. Unfortunately, access can only be provided to the customer.
For those interested in custom development services, please visit the backtest-rookies (.com) website for more information.
Features
RSI & Price divergence detection
Open a trade window when trade conditions are met
Enter the trade on confirmation
Stop losses / take profit custom levels based of daily pivot values

MACD + RSI + EMA + SMA + Ichimoku + overbought + buy, sell +Doji// MACD + EMA 200 *** buy and sell strategy (RSI, EMA, SMA) *** Doji Harami *** overbought and oversold *** trend direction *** divergence *** Ichimoku
Use this script in time 1h

MACD + RSI TSA simple strategy that use EMAs convergence/divergence and RSI peeks to take position. Fractals are really useful to positioning your stop loss.
It works well on commodities and forex markets.

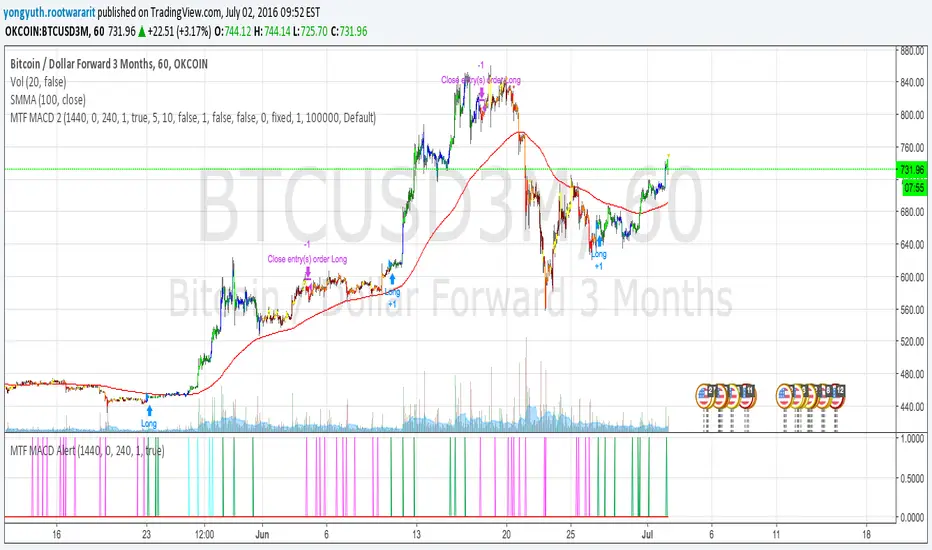
MTF MACD 2 By YuthavithiIf you want a good strategy without repaint. This one might be for you. Excellent profitable for BTCUSD3M for OKCoin.
It uses multiple time frame MACD for trading decision. To avoid repaint, set the delay period = 1 for both long term and midterm.
The idea is that, if long term, mid term and current time frame all agree on traidng direction, the trade will take place.
I also uses it in my automated trading bot with good result.
www.tradingview.com
Ultimate Trading BotHow the "Ultimate Trading Bot" Works:
This Pine Script trading bot executes buy and sell trades based on a combination of technical indicators:
Indicators Used:
RSI (Relative Strength Index)
Measures momentum and determines overbought (70) and oversold (30) levels.
A crossover above 30 suggests a potential buy, and a cross below 70 suggests a potential sell.
Moving Average (MA)
A simple moving average (SMA) of 50 periods to track the trend.
Prices above the MA indicate an uptrend, while prices below indicate a downtrend.
Stochastic Oscillator (%K and %D)
Identifies overbought and oversold conditions using a smoothed stochastic formula.
A crossover of %K above %D signals a buy, and a crossover below %D signals a sell.
MACD (Moving Average Convergence Divergence)
Uses a 12-period fast EMA and a 26-period slow EMA, with a 9-period signal line.
A crossover of MACD above the signal line suggests a bullish move, and a cross below suggests bearish movement.
Trade Execution:
Buy (Long Entry) Conditions:
RSI crosses above 30 (indicating recovery from an oversold state).
The closing price is above the 50-period moving average (showing an uptrend).
The MACD line crosses above the signal line (indicating upward momentum).
The Stochastic %K crosses above %D (indicating bullish momentum).
→ If all conditions are met, the bot enters a long (buy) position.
Sell (Exit Trade) Conditions:
RSI crosses below 70 (indicating overbought conditions).
The closing price is below the 50-period moving average (downtrend).
The MACD line crosses below the signal line (bearish signal).
The Stochastic %K crosses below %D (bearish momentum).
→ If all conditions are met, the bot closes the long position.
Visuals:
The bot plots the moving average, RSI, MACD, and Stochastic indicators for reference.
It also displays buy/sell signals with arrows:
Green arrow (Buy Signal) → When all buy conditions are met.
Red arrow (Sell Signal) → When all sell conditions are met.
How to Use It in TradingView:


Improved MACD by TumanStrategy for scalping in 5M and 15M timeframes..
Realized SL and trailing stops.
Each order 1% of the deposit

MACD ReLoaded STRATEGYSTRATEGY version of MACD ReLOADED Indicator:
A different approach to Gerald Appel's classical Moving Average Convergence Divergence.
Appel originaly set MACD with exponential moving averages.
In this version users can apply 11 different types of moving averages which they can benefit from their smoothness and vice versa sharpnesses...
Built in Moving Average type defaultly set as VAR but users can choose from 11 different Moving Average types like:
SMA : Simple Moving Average
EMA : Exponential Moving Average
WMA : Weighted Moving Average
DEMA : Double Exponential Moving Average
TMA : Triangular Moving Average
VAR : Variable Index Dynamic Moving Average a.k.a. VIDYA
WWMA : Welles Wilder's Moving Average
ZLEMA : Zero Lag Exponential Moving Average
TSF : True Strength Force
HULL : Hull Moving Average
TILL : Tillson T3 Moving Average
In shorter time frames backtest results shows us TILL, WWMA, VIDYA (VAR) could be used to overcome whipsaws because they have less numbers of signals.
In longer time frames like daily charts WMA, Volume Weighted MACD V2, and MACDAS and SMA are more accurate according to backtest results.
My interpretation of Buff Dormeier's Volume Weighted MACD V2:
Thomas Aspray's MACD: (MACDAS)

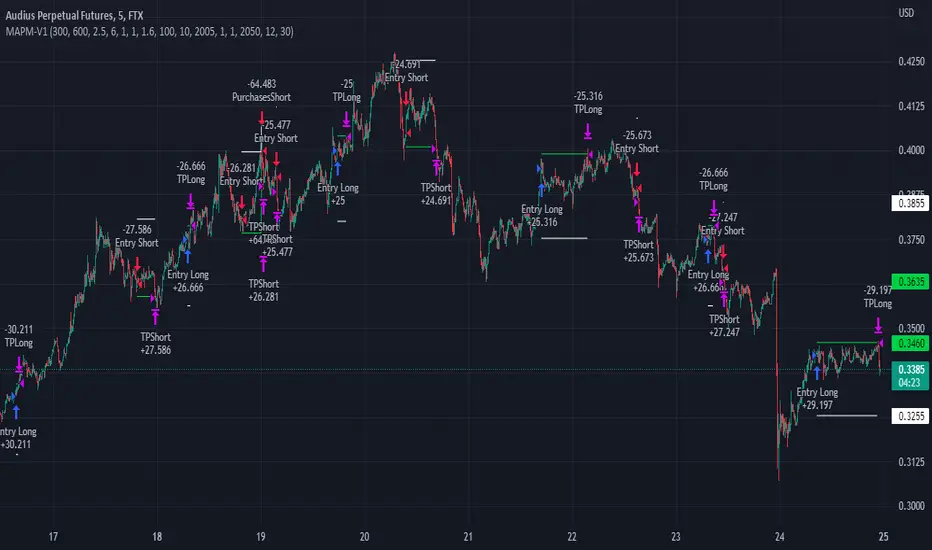
MAPM-V1Greetings dear traders!
I would like to introduce you the script for testing the strategy by crossing two signal EMAs based on the MACD indicator.
In the strategy itself:
The entry is made as a percentage of the deposit by EMA crossings.
There are additional purchases, they are set from the entry price for a given percentage in the opposite direction of the transaction.
The distance in percentage from the entry price, on which the additional purchase is exposed, is set in the StepAddPurchases parameter.
The Martingale parameter increases the initially purchased amount of the base traded cryptocurrency in each additional purchase.
The essence of the strategy is to trade a large number of pairs in order to diversify risks and obtain a stable income.
It is desirable to enter each trading pair with a small percentage of the deposit.
The optimization result shows the trading result for the period of 5000 bars (the platform does not give more history) on 10% of the deposit for the first transaction, the addition will also take place on initially bought amount of base traded cryptocurrency, multiplied by the martingale parameter, raised by the number of addition.
The strategy will still be updated, so see you soon!
MACDouble & StochRSI w/ safeties and variable time interval v0.3UPDATE:
IMPORTANT!!! MAKE SURE "RECALCULATE AFTER ORDER FILLED" IS CHECKED. I will have it on by default in the future.
This is a continuation of my previous scripts of two MACD indicators with a Stochastic RSI indicator.
New features:
- Alternate MACD time interval
You can now set the time interval for the second MACD indicator to a different resolution than the displayed chart.
Uncheck the box and select the desired interval. For example, if your chart is set to 15min then first MACD will be set at 15 min and you can select 5 min for the second MACD.
- Alternate StoRSI time interval
You can (and should) set the StochRSI to a different time interval as well. StochRSI hasn't worked great with previous versions. Now you can set it to a different time resolution as well. I strongly recommend you set it at a higher (slower) resolution; for example if your chart is set at 15min then you should test setting the StochRSI at 30 or 45min.
- ' True" StochRSI logic
Trading logic for StochRSI is now a true StochRSI, instead of just reading "k" and ignoring "d", K now has to be greater than D to buy and less than to sell.
- Safeties
A primitive but low risk safety in the form of an uptrend/downtrend price safety. If current close+high isn't greater than the previous close and high then the buy order will not be executed. The same applies for sell orders.
- Cap on losses from short positions
A stop loss safety set to 9000 for exiting sell positions. This will need refinement in the future but this puts a cap on losses from any sell position. At an initial currency of 10,000 this translates to 90.00. If it is giving you problems simply delete line 78 from the source code.
Please feel free to ask any questions or send me suggestions. This is still very much a work in progress and I'll try to polish up the rough spots but it is fully functional. With a slower StochRSI and the safeties I have gotten it to consistently outperform the old 2x MACD strategy script---typically by 3-fold.

Ta StrategyHello guys
This script follows traditional technical indicators
MACD, ADX, RSI and pivot points
If the price is above the resistance and the MACD has crossover ,and the RSI 14 is above 50
ADX is higher than 20, and DI+ is higher than DI-. This is a buy signal and vice versa for a sell signal
The script moves the stop loss to the entry price after the first target is reached
You can specify the quantity you want to sell when the price reaches the first target
There are also options like if you want the script to entry long or short, or both
you can reverse the strategy if it does not work well
If you want to inquire about any details, please let me know in the comments

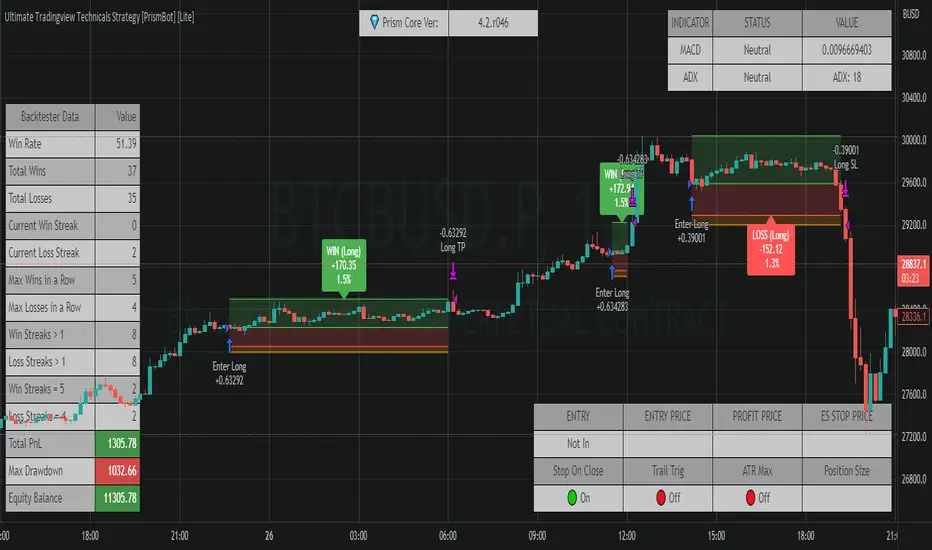
Ultimate Tradingview Technicals Strategy [PrismBot] [Lite]Included in this builder:
MACD
RSI
Tradingview Technical Analysis
Ichimoku
Global Trend Filter
Pullback Filter
Our most robust strategy to date with MACD , RSI , and many other basic strategies included as well as additional filters and alert options.
It is an advanced trading strategy built with the intent to make it easy for anyone to begin trading, but also avoid too much complication of strategy concepts.
For instance, you can change the MACD settings to be "more sensitive" by using a simple dropdown menu, and adjust which strategy you are employing with the MACD on the fly with another.
You can easily enable and disable strategies using the checkbox.
The strategy demo results use 100% equity per trade as an example - the reason for this is that the stop loss is set to 1%, so each trade is risking 1% (give or take slippage). Slippage is set to 5 ticks, and a 0.04% commission (Binance average for market and limit orders)
This strategy incorporates a risk to reward system where the user can select between ATR and Percent based stop losses and take profit targets. This means that the user has much better control over money management when utilizing this strategy and it doesn't require you to babysit the strategy to ensure it's entering and existing strategies in an ideal place.
The status box shows the current state of the various strategies and their values. A red circle indicates the filter / strategy is not valid for entry yet. A green circle indicates that filter / strategy is valid for entry. When all selected strategies are valid simultaneously, the next bar will trigger an entry signal.
If you have any questions about this strategy, please leave them in the comments below, or DM for more details. Thanks!
Additional features in this lite strategy:
✔️ Tweak a multitude of specific settings (MA lengths, R:R, SL distance etc)
✔️ Use money management and risk calculations
✔️ Draw trade info directly to chart (eg. SL size in percent, win rate etc)
✔️ Use various filters (eg. time filter, date filter etc)
✔️ Manage risk per position
✔️ Sync to any bot or algorithmic trading system