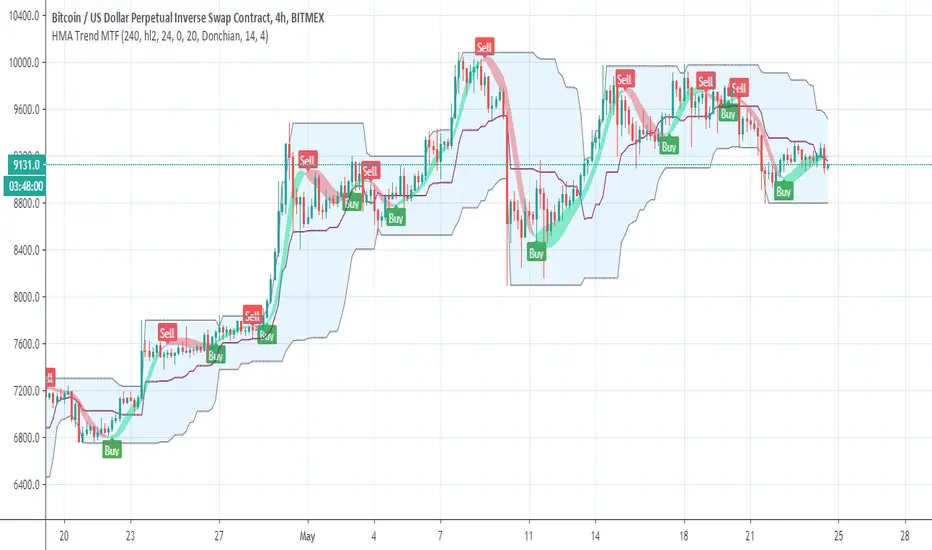
Hull Trend MTFhull trend taken from So add MTF function and alert for the buy and sell (in the MTF shift set to 0 , if repaint then set shift to 1) the blue line is linear regression trend Pine Script® indicatorby RafaelZioniUpdated 2222 2.2 K
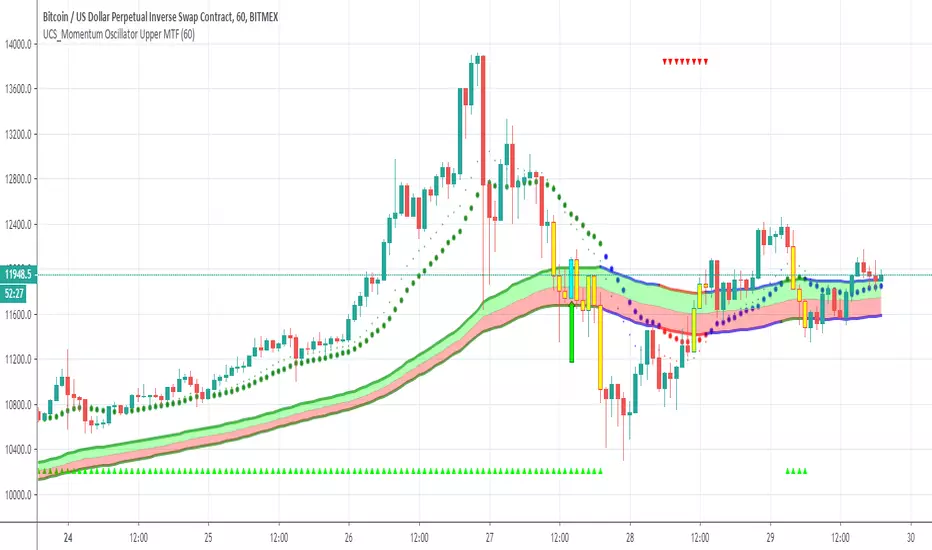
UCS_Momentum Oscillator Upper MTFby request of a freind I just made him this famous oscilator of chris mody in MTF format so it a sling shot and MTF Pine Script® indicatorby RafaelZioniUpdated 44108
HullDEMA MTFThis indicator based on non repaint HULL 720 min and dema MTF i suugest to keep the Dema MTF on the time frame of your graph using the HULL 720 min we can see how the signal of DEMA and the crossing of the hull 720 either by DEMA or by the candels this enable us to detect trends more easy Pine Script® indicatorby RafaelZioni102
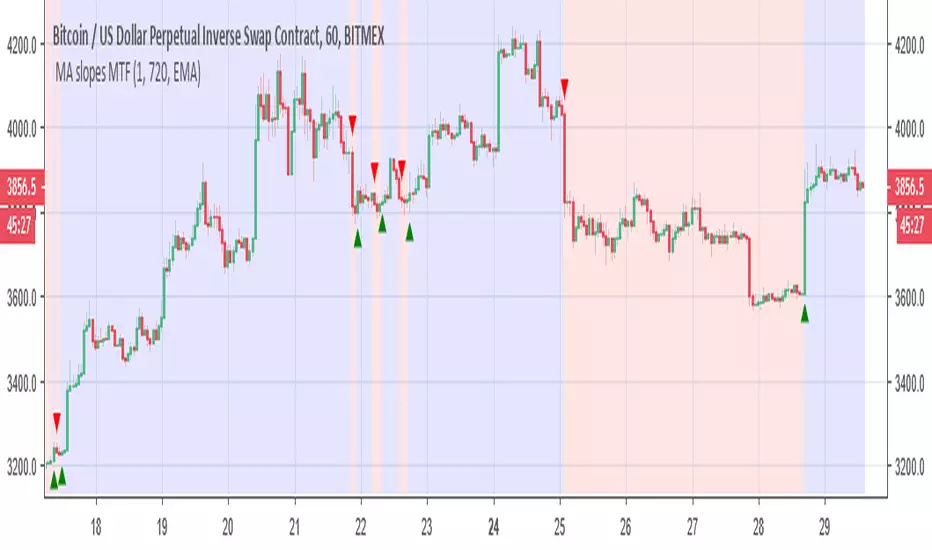
MA slopes MTF this is the original script. its nice as I love slopes of different MA add MTF +colors of bullish and bearish add alerts and signals This can be a very good base indicator if one want to add extra things to it to make it better or can used as a good filter here on 15 min 1000min MTF Pine Script® indicatorby RafaelZioni22120
VPT and Heiken Ashi Candles MTFThe volume price trend indicator is used to determine the balance between a security’s demand and supply. The percentage change in the share price trend shows the relative supply or demand of a particular security, while volume indicates the force behind the trend. The VPT indicator is similar to the on-balance volume (OBV) indicator in that it measures cumulative volume and provides traders with information about a security’s money flow So we put the VPT and add HA candles with non repainting MTF , the crossing up or down of the VPT over candles create the signals since VPT tend to overshoot you can smooth it with Leni..(just give the smoothing of the length this stupid name:) ) alerts inside just example of play with MTF and the smooth of VPTPine Script® indicatorby RafaelZioniUpdated 1313395
DEMA-MTF with alerts This model based on DEMA with non repainting MTF if you want to change the MTF use int2 buy and sell show in triangke signals alerts included you can smooth the signal with len1 if needed Pine Script® indicatorby RafaelZioni33147
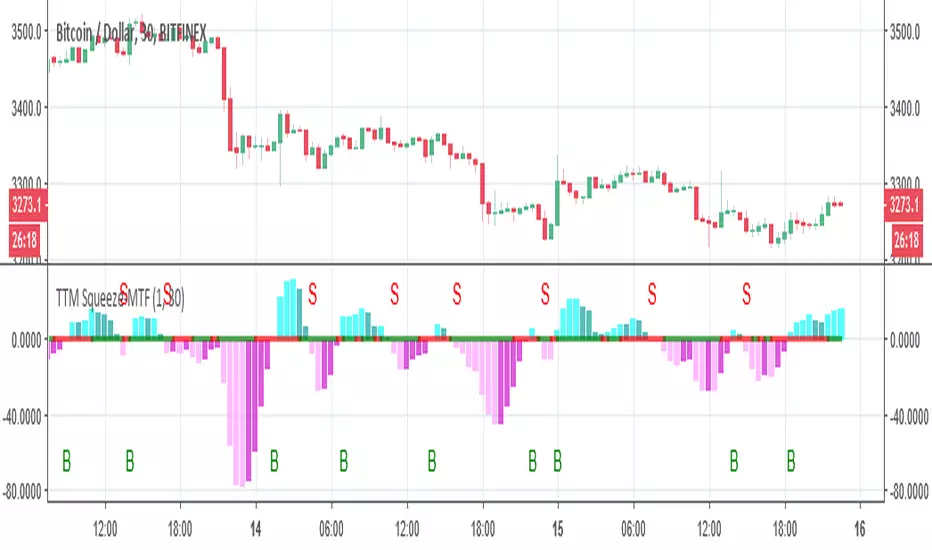
TTM Squeeze-MTFthe script based on I just change it to be non repainting MTF and add signals you can change the MTF by changing int2 Pine Script® indicatorby RafaelZioni33284
Heiken Ashi Candles MTFThis script allow you to get the HA candles in different MTF settings (MTF calculated as length not as time) . since we do not use security fuction we do not have repaint issue Use the int2 to change the time frame Pine Script® indicatorby RafaelZioniUpdated 1414555
Up/Down Range Momentum MTFSo using the script of and adding non repainting MTF function to it we create this momentum model You can enter either at cross of blue line or at cross of 0 and vice versa at red line. since it has MTF function you can look it on different time frames just set int 2 to the TF of your desire Pine Script® indicatorby RafaelZioni88114
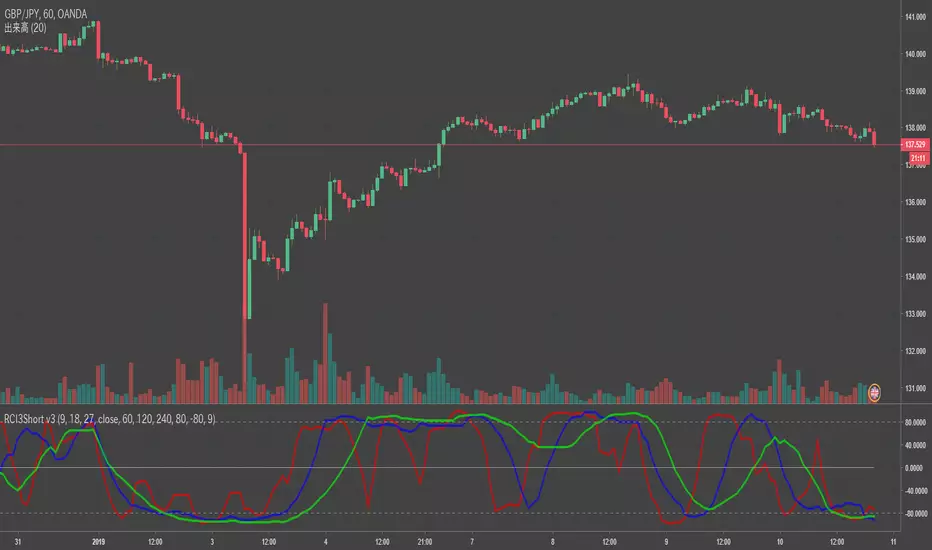
RCI3Short MTFFor RCI lover. We are facing a timeout problem on smart phone apps of TV. It looks like a staircase, but It frees us from timeout problems. default MTF: 60 / 120 / 240 MTF line as middle/long linesPine Script® indicatorby madoqaUpdated 311
MA Study: Different Types and More [NeoButane]A study of moving averages that utilizes different tricks I've learned to optimize them. Included is Bollinger Bands, Guppy (GMMA) and Super Guppy. The method used to make it MtF should be more precise and smoother than regular MtF methods that use the security function. For intraday timeframes, each number represents each hour, with 24 equal to 1 day. For daily, 3 is 3 day, for weekly, 4 is the 4 weekly, etc. If you're on a higher timeframe than the one selected, the length will not change. Log-space is used to make calculations work on many cryptos. The rules for color changing Guppy is changed to make it not as choppy on MAs other than EMA. Note that length does not affect SWMA and VWAP and source does not affect VWAP. A short summary of each moving average can be found here: medium.com List of included MAs: ALMA: Arnaud Legoux Double EMA EMA: Exponential Hull MA KAMA: Kaufman Adaptive Linear Regression Curve LSMA: Least Squares SMA: Simple SMMA/RMA: Smoothed/Running SWMA: Symm. Weighted TMA: Triangular Triple EMA VWMA: Volume Weighted WMA: Weighted ZLEMA: Zero Lag VWAP: Vol Weighted Average Welles Wilder MA Pine Script® indicatorby NeoButaneUpdated 1111 1.8 K
ADX-DI MTF trend indication - JD version 2Version 2 added support for MTF, to see the trend direction on the lower or higher timeframe. As an example to see the difference, the indicator is added three times, one time for the current TF, one set at the higher and one at the lower TF. Cudo's to Chris Moody for the MTF-switching-code!! JD.Pine Script® indicatorby Duyck88538
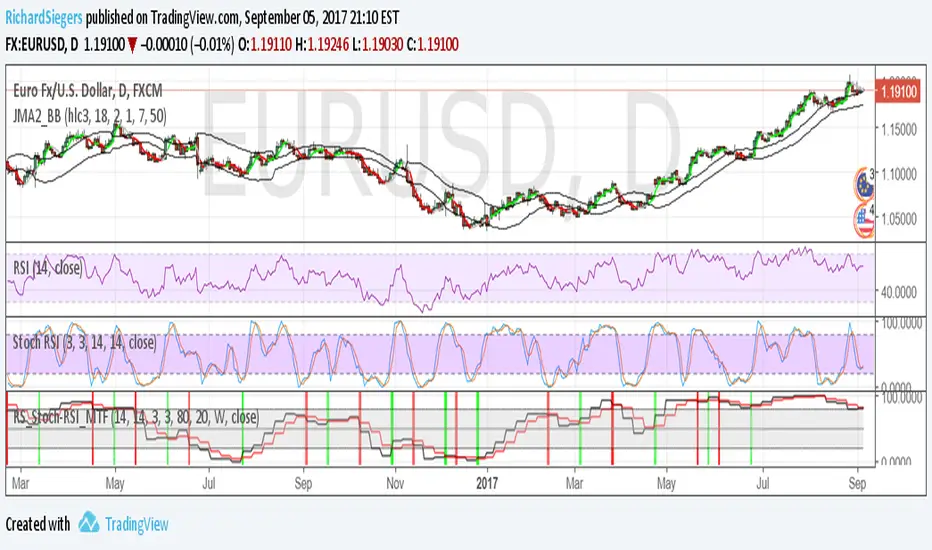
RS_Stoch-RSI_MTFmodification by Richard Siegers that turned stochastic mtf from ChrisMoody into stochastic-rsi mtfPine Script® indicatorby RichardSiegersUpdated 33218
B3 Bar Cycle MTF (fix)Apologies, there was an error in printing for the thick gray boxes, happened when MTF was switched on. All better, and here is the details from before: This is an interesting study that can be used as a tool for determining trend direction, and also could be a trailing stop setter. I use it as a gauge on MTF settings. If on, you can look at the bar cycle of the 1h while on the 15m giving you a lot of information in one tool. If a line is missing high or low, it is because it was broken, if both exist you are trading in range and cloud appears. If both sides break you get thick gray boxes above and below bar. Get used to editing the inputs to suit your liking. Often 3-5 length and always looking at different resolutions to get a big picture story. You could put multiple instances of the study up to see them simultaneously. I based the idea off of Krausz's 3 day cycle which you can read about in his teachings. I tend to find it looking better using Heikin Ashi bar-style.Pine Script® indicatorby HammondB355311
True Strength Indicator MTFHere is an example of a script showing a multi-time frame of TSI. Chart below compares FX EURUSD Daily TSI to 1H TSI Here is an updated version study("True Strength Indicator MTF", shorttitle="TSI MTF") resCustom = input(title="Timeframe", type=resolution, defval="60" ) long = input(title="Long Length", type=integer, defval=25) short = input(title="Short Length", type=integer, defval=13) signal = input(title="Signal Length", type=integer, defval=13) price = close double_smooth(src, long, short) => fist_smooth = ema(src, long) ema(fist_smooth, short) pc = change(price) double_smoothed_pc = double_smooth(pc, long, short) double_smoothed_abs_pc = double_smooth(abs(pc), long, short) tsi_value = 100 * (double_smoothed_pc / double_smoothed_abs_pc) tsi = security(tickerid, resCustom,tsi_value) plot(tsi, color=black) plot(ema(tsi, signal), color=red) hline(0, title="Zero")Pine Script® indicatorby QuantitativeExhaustion1313 1.8 K
Triple MTF MA Painter - Directional TogglesThis Pine Script is a **multi-filter trend-following indicator**. It acts as a "gatekeeper," only allowing a signal to fire when price action, momentum, and volume (if selected) all align in the same direction across up to three different moving averages and timeframes. Here is a breakdown of how the logic flows from the code to your chart: ### 1. The Triple-Filter Architecture The code uses three independent Moving Average (MA) engines. You can configure each one to be a different type: * **SMA/EMA:** For standard price smoothing. * **VWMA:** To ensure the trend is backed by high trading volume. * **ZLEMA:** To catch price reversals with almost zero lag. Each MA also has a **Multi-Timeframe (MTF)** capability. This means you can be on a 5-minute chart but only see signals when the price is above the **Daily** or **4-Hour** trend line. ### 2. The Logic Filter (The "Gate") The script calculates whether the current price is "cleared" for a signal: * **Bullish Condition:** Price must be above MA 1 **AND** MA 2 **AND** MA 3. * **Bearish Condition:** Price must be below MA 1 **AND** MA 2 **AND** MA 3. > **Note:** If you toggle an MA "OFF" in the settings, the code intelligently ignores it so it doesn't block your signals. ### 3. Price Action Trigger Even if the price is above all three MAs, the code won't fire a signal until it sees a specific candle pattern: * **Bullish Trigger:** The current bar's High and Low must both be higher than the previous bar's High and Low. * **Bearish Trigger:** The current bar's High and Low must both be lower than the previous bar's High and Low. ### 4. The State Machine (The "Memory") To prevent the chart from becoming cluttered with 20 labels in a row during a long trend, I implemented a **State Machine**. * Once a **Bullish** signal triggers, the script "remembers" it. * It will refuse to show another Bullish signal until a **Bearish** signal occurs to reset the cycle. * This ensures you only see the **first** valid entry point of a new trend. ### 5. UI and Customization The code is designed to be user-friendly without needing to look at the script: * **Directional Toggles:** You can hide all bearish signals if you only want to go long. * **Visual Toggles:** You can turn off the bar coloring if it interferes with your other indicators, keeping only the labels. * **Source Selection:** You can choose to calculate the MAs based on `Close`, `Open`, or even the `HL2` (midpoint of the bar). --- ### Summary of Workflow 1. **Check MAs:** Is price above/below all active MAs? 2. **Check Timeframe:** Are the higher timeframe trends in agreement? 3. **Check Pattern:** Did the current candle break the previous candle's range? 4. **Check History:** Is this a new trend direction, or are we already in one? 5. **Output:** If all checks pass, paint the bar and drop a label. Would you like me to add a **Stop Loss / Take Profit** calculation to the labels so you know exactly where to exit the trade?Pine Script® indicatorby Trading_Andrea2
HTF-MTF DirectionThis indicator helps a bit with determining the direction in HTF and MTF for those who trade in LTF without having to change timeframes.Pine Script® indicatorby rainerluis330
Welles Wilders MAs - MTFWelles Wilder Moving Averages - Multi-Timeframe (MTF) This indicator displays Welles Wilder's Smoothed Moving Averages calculated from a higher timeframe of your choice, allowing you to view longer-term trend data on lower timeframe charts (such as tick charts, second charts, or any intraday timeframe). KEY FEATURES: • Multi-Timeframe Capability: Plot moving averages from any timeframe (default: 5 minutes) on your current chart • Four Trend Layers: Short (34), Medium (72), Medium Extension (89), and Long (144) period moving averages • Welles Wilder Smoothing: Uses the original Welles Wilder moving average formula for smoother, less reactive trend lines • Flexible Coloring Options: Choose between price-based coloring or MA crossover-based coloring • Visual Trend Zones: Shaded areas between moving averages help identify trend strength and direction • Customizable: Adjust all periods, colors, and the source timeframe to fit your trading style IDEAL FOR: • Tick chart traders who want to see higher timeframe trends • Day traders needing multi-timeframe analysis on a single chart • Traders using range bars, Renko, or other non-time-based charts • Anyone wanting to filter trades based on higher timeframe moving average trends HOW TO USE: 1. Add the indicator to your chart 2. Set your preferred timeframe in the settings (default is 5 minutes) 3. Adjust MA periods and colors to your preference 4. Use the MA crossovers and price position relative to the MAs to identify trend direction and potential entry/exit points The Welles Wilder MA is a type of exponential moving average that provides smooth trend-following capabilities with less whipsaw than traditional moving averages.Pine Script® indicatorby Elevate_Trading_LLC1112
Welles Wilders MAs - MTFWelles Wilder Moving Averages - Multi-Timeframe (MTF) This indicator displays Welles Wilder's Smoothed Moving Averages calculated from a higher timeframe of your choice, allowing you to view longer-term trend data on lower timeframe charts (such as tick charts, second charts, or any intraday timeframe). KEY FEATURES: • Multi-Timeframe Capability: Plot moving averages from any timeframe (default: 5 minutes) on your current chart • Four Trend Layers: Short (34), Medium (72), Medium Extension (89), and Long (144) period moving averages • Welles Wilder Smoothing: Uses the original Welles Wilder moving average formula for smoother, less reactive trend lines • Flexible Coloring Options: Choose between price-based coloring or MA crossover-based coloring • Visual Trend Zones: Shaded areas between moving averages help identify trend strength and direction • Customizable: Adjust all periods, colors, and the source timeframe to fit your trading style IDEAL FOR: • Tick chart traders who want to see higher timeframe trends • Day traders needing multi-timeframe analysis on a single chart • Traders using range bars, Renko, or other non-time-based charts • Anyone wanting to filter trades based on higher timeframe moving average trends HOW TO USE: 1. Add the indicator to your chart 2. Set your preferred timeframe in the settings (default is 5 minutes) 3. Adjust MA periods and colors to your preference 4. Use the MA crossovers and price position relative to the MAs to identify trend direction and potential entry/exit points The Welles Wilder MA is a type of exponential moving average that provides smooth trend-following capabilities with less whipsaw than traditional moving averages.Pine Script® indicatorby Elevate_Trading_LLC115
High Low MTF PRO (2 HTF) - SurendarHigh Low MTF PRO (2 HTF) is a smart multi-timeframe support & resistance indicator that automatically plots important High and Low levels from the current timeframe and two higher timeframes. The indicator dynamically displays levels only when price is near, keeping your chart clean and focused on the most relevant zones. 🔹 Key Features ✅ Plots Current TF High & Low levels ✅ Plots High & Low from two selectable Higher Timeframes ✅ Lines appear only when price is near the level ✅ Lines disappear when price moves away ✅ Broken levels are automatically removed ✅ Custom colors for each timeframe ✅ Adjustable proximity distance ✅ Works on all markets and timeframes ✅ Non-repaintingPine Script® indicatorby surendarguna20015
Power200EMA - MTF 200 EMA SuiteThe MTF 200 EMA Suite is a trend-confluence tool designed to reveal institutional support and resistance levels across multiple timeframes simultaneously. By plotting the 200-period Exponential Moving Average from six different time horizons onto a single chart, it allows you to identify "Power Zones" where various market cycles overlap. Core Functionality Multi-Timeframe Visibility: On a single lower-timeframe chart (like the 1m or 5m), you can see exactly where the 200 EMA sits on the 1m, 3m, 5m, 15m, 1h, and 4h horizons. Institutional Benchmarking: The 200 EMA is the primary "line in the sand" used by institutional algorithms and bank traders to determine long-term trend bias. Dynamic Clustering: When multiple EMA lines converge or "cluster" in one price area, it identifies a high-probability zone of institutional interest. Floating Labels: Each line features an auto-updating label at the current price bar, allowing you to instantly identify which timeframe you are looking at without hovering over the plots. Strategic Use Trend Filter: Trade only in the direction where price is relative to the majority of the EMAs (e.g., only buy when price is above the 1h and 4h lines). Mean Reversion: Use the higher-timeframe lines (1h/4h) as targets for price to return to during volatile over-extensions. Support/Resistance: Use EMA clusters as "hard" barriers to place stops behind or to look for bounce-entry confluence.Pine Script® indicatorby PowerEdgeTrader7
Funnelzon Graded Buy and Sell Signals (LITE) MFI MTFFunnelzon Buy and Sell Signals (EMA Zones) – LITE is a lightweight overlay indicator built for scalping and short-term trading. It generates BUY/SELL signals, grades each signal (A+ to F), and provides a clean Confirmation Box that summarizes multi-timeframe context so you can make faster, more structured decisions. How it works Signal Engine (LTF) Signals are triggered using an ATR-based “scalp helper” logic with adjustable sensitivity. A stop-state system helps reduce repeated or noisy entries. Signal Scoring & Grades (A+ → F) When a signal appears, it is evaluated by a context pipeline that considers: Adaptive momentum/flow (AMF) ALMA trend alignment Support/Resistance proximity Swing structure behavior Market regime / trend strength (ADX-based) The result is a score mapped to a grade: A+ / A = strongest signals B / C = mixed conditions D / F = low-quality conditions Optional Filters MFI Filter: Helps avoid signals that do not meet Money Flow conditions. HTF Confirmation (MTF): Uses HTF1 and HTF2 bias. Choose strict filtering or soft alignment. Confirmation Box (Dashboard) The box displays: HTF State: Trend Long / Trend Short / HTF Conflict / Neutral Market Mode: Trend / Pullback / Conflict Trade Bias: Long-only / Short-only / Wait ENTRY NOW? = “YES” when HTF bias and LTF signal align MFI status + HTF1/HTF2 direction Optional Structure Tools EMA overlays: 9 / 12 / 20 / 50 / 100 / 200 Auto Supply/Demand zones (pivot-based, ATR thickness, configurable extension and limits) Best practices (recommended workflow) Prefer trading A+ / A signals only. Trade in the direction of HTF State when possible. If Market Mode shows PULLBACK or CONFLICT, reduce risk or wait for better alignment. Use Supply/Demand zones and EMAs for structure (targets, invalidation, and bias). Important: Confirmation with Stochastic + MACD This script is a signal + context tool, not a guarantee. To validate signal confirmation, it is strongly recommended to use: Stochastic Oscillator (momentum/exhaustion confirmation) MACD (trend momentum and direction confirmation) Only take trades when the script signal and your confirmation indicators agree. Alerts Includes alert conditions for: Buy Signal Sell Signal Any Signal ENTRY NOW (HTF + LTF aligned) ENTRY NOW Long / ENTRY NOW Short Disclaimer This indicator is for educational purposes and does not constitute financial advice. Always backtest, manage risk, and confirm signals with your own rules.Pine Script® indicatorby funnelzon1176
CRT Master 974 par GUIROA Stephane [ULTIMATE MTF + HTF SWEEP]"CRT Master Blueprint ". This indicator is designed to display multi-timeframe levels from user-defined timeframes and highlight certain trading signals within a specified session. Multi-Timeframe Configuration 1.Input Timeframes: Users can input three separate timeframes (e.g., 30 minutes, 60 minutes, 240 minutes).Each timeframe is assigned an option to be displayed or hidden, along with a customizable color. 2.Display Options: Each timeframe can be toggled on or off, with corresponding colors set in the input parameters. Level Retrieval Function 3.Getting Levels: The get_crt_levels function retrieves high, low, and close values from the previous bar of a specified timeframe.pinescript Drawing Levels 4.Drawing Levels Function: The draw_levels function visuals the high, low, and mid levels with different styles (dashed and dotted lines) and labels on the chart based on whether the respective timeframes' options are enabled. 6.Dashboard: A small table displays the status of the indicator (active or inactive) and the primary timeframe on the chart. Summary In summary, this indicator is helpful for traders who want to visually analyze multiple timeframe levels and receive signals based on specific price action within a defined session. The use of customizable parameters allows for flexibility in adapting to different trading strategies or preferences.Pine Script® indicatorby stephneguiroa11952