Technical Ratings█ OVERVIEW
This indicator calculates TradingView's well-known "Strong Buy", "Buy", "Neutral", "Sell" or "Strong Sell" states using the aggregate biases of 26 different technical indicators.
█ FEATURES
Differences with the built-in version
• You can adjust the weight of the Oscillators and MAs components of the rating here.
• The built-in version produces values matching the states displayed in the "Technicals" ratings gauge; this one does not always, where weighting is used.
• A strategy version is also available as a built-in; this script is an indicator—not a strategy.
• This indicator will show a slightly different vertical scale, as it does not use a fixed scale like the built-in.
• This version allows control over repainting of the signal when you do not use a higher timeframe. Higher timeframe (HTF) information from this version does not repaint.
• You can configure markers on signal breaches of configurable levels, or on advances declines of the signal.
The indicator's settings allow you to:
• Choose the timeframe you want calculations to be made on.
• When not using a HTF, you can select a repainting or non-repainting signal.
• When using both MAs and Oscillators groups to calculate the rating, you can vary the weight of each group in the calculation. The default is 50/50.
Because the MAs group uses longer periods for some of its components, its value is not as jumpy as the Oscillators value.
Increasing the weight of the MAs group will thus have a calming effect on the signal.
• Alerts can be created on the indicator using the conditions configured to control the display of markers.
Display
The calculated rating is displayed as columns, but you can change the style in the inputs. The color of the signal can be one of three colors: bull, bear, or neutral. You can choose from a few presets, or check one and edit its color. The color is determined from the rating's value. Between 0.1 and -0.1 it is in the neutral color. Above/below 0.1/-0.1 it will appear in the bull/bear color. The intensity of the bull/bear color is determined by cumulative advances/declines in the rating. It is capped to 5, so there are five intensities for each of the bull/bear colors.
The "Strong Buy", "Buy", "Neutral", "Sell" or "Strong Sell" state of the last calculated value is displayed to the right of the last bar for each of the three groups: All, MAs and Oscillators. The first value always reflects your selection in the "Rating uses" field and is the one used to display the signal. A "Strong Buy" or "Strong Sell" state appears when the signal is above/below the 0.5/-0.5 level. A "Buy" or "Sell" state appears when the signal is above/below the 0.1/-0.1 level. The "Neutral" state appears when the signal is between 0.1 and -0.1 inclusively.
Five levels are always displayed: 0.5 and 0.1 in the bull color, zero in the neutral color, and -0.1 and - 0.5 in the bull color.
The levels that can be used to determine the breaches displaying long/short markers will only be visible when their respective long/short markers are turned on in the "Direction" input. The levels appear as a bright dotted line in bull/bear colors. You can control both levels separately through the "Longs Level" and "Shorts Level" inputs.
If you specify a higher timeframe that is not greater than the chart's timeframe, an error message will appear and the indicator's background will turn red, as it doesn't make sense to use a lower timeframe than the chart's.
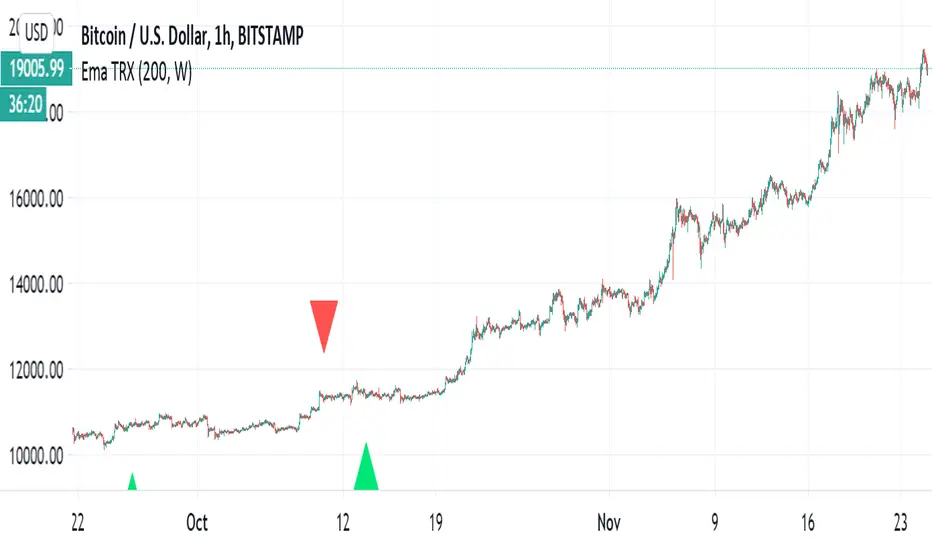
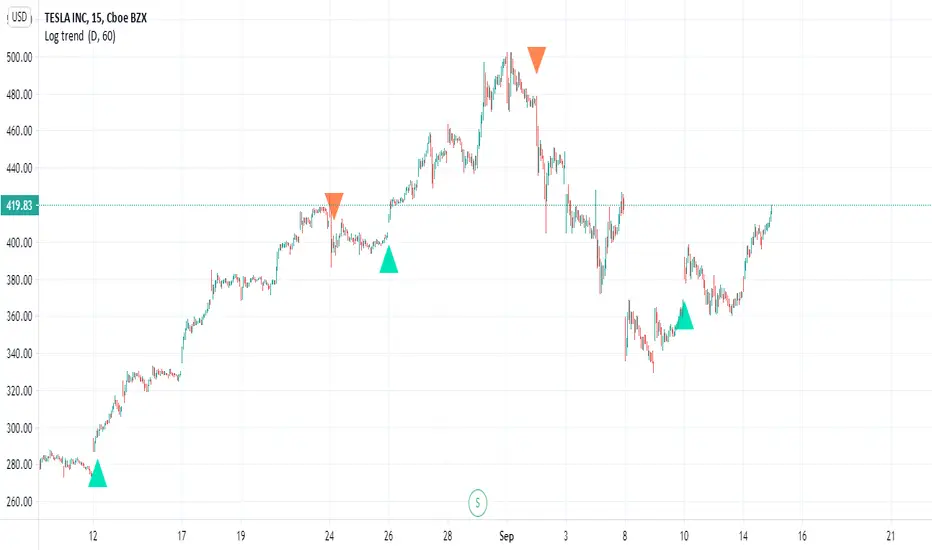
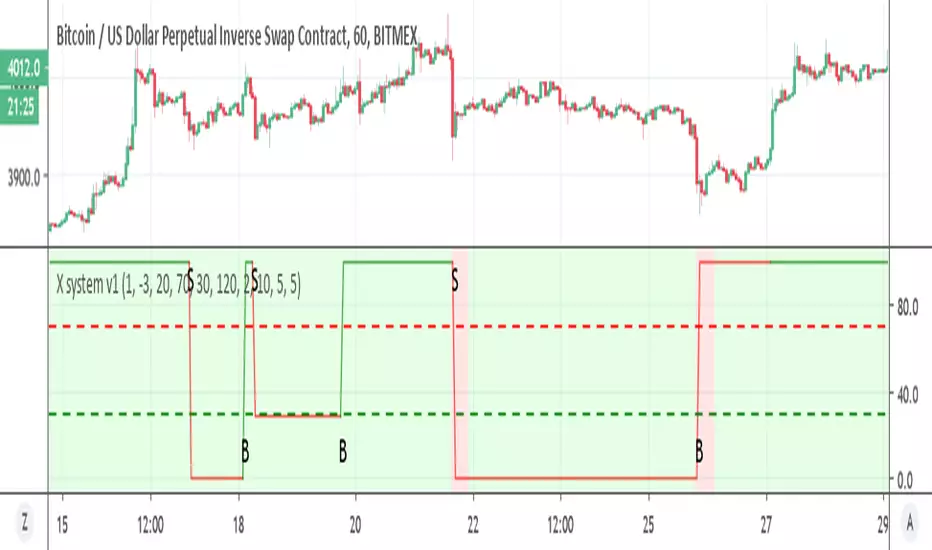
Markers
Markers are small triangles that appear at the bottom and top of the indicator's pane. The marker settings define the conditions that will trigger an alert when you configure an alert on the indicator. You can:
• Choose if you want long, short or both long and short markers.
• Determine the signal level and/or the number of cumulative advances/declines in the signal which must be reached for either a long or short marker to appear.
Reminder: the number of advances/declines is also what controls the brightness of the plotted signal.
• Decide if you want to restrict markers to ones that alternate between longs and shorts, if you are displaying both directions.
This helps to minimize the number of markers, e.g., only the first long marker will be displayed, and then no more long markers will appear until a short comes in, then a long, etc.
Alerts
When you create an alert from this indicator, that alert will trigger whenever your marker conditions are confirmed. Before creating your alert, configure the makers so they reflect the conditions you want your alert to trigger on.
The script uses the alert() function, which entails that you select the "Any alert() function call" condition from the "Create Alert" dialog box when creating alerts on the script. The alert messages can be configured in the inputs. You can safely disregard the warning popup that appears when you create alerts from this script. Alerts will not repaint. Markers will appear, and thus alerts will trigger, at the opening of the bar following the confirmation of the marker condition. Markers will never disappear from the bar once they appear.
Repainting
This indicator uses a two-pronged approach to control repainting. The repainting of the displayed signal is controlled through the "Repainting" field in the script's inputs. This only applies when you have "Same as chart" selected in the "Timeframe" field, as higher timeframe data never repaints. Regardless of that setting, markers and thus alerts never repaint.
When using the chart's timeframe, choosing a non-repainting signal makes the signal one bar late, so that it only displays a value once the bar it was calculated has elapsed. When using a higher timeframe, new values are only displayed once the higher timeframe completes.
Because the markers never repaint, their logic adapts to the repainting setting used for the signal. When the signal repaints, markers will only appear at the close of a realtime bar. When the signal does not repaint (or if you use a higher timeframe), alerts will appear at the beginning of the realtime bar, since they are calculated on values that already do not repaint.
█ CALCULATIONS
The indicator calculates the aggregate value of two groups of indicators: moving averages and oscillators.
The "MAs" group is comprised of 15 different components:
• Six Simple Moving Averages of periods 10, 20, 30, 50, 100 and 200
• Six Exponential Moving Averages of the same periods
• A Hull Moving Average of period 9
• A Volume-weighed Moving Average of period 20
• Ichimoku
The "Oscillators" group includes 11 components:
• RSI
• Stochastic
• CCI
• ADX
• Awesome Oscillator
• Momentum
• MACD
• Stochastic RSI
• Wiliams %R
• Bull Bear Power
• Ultimate Oscillator
The state of each group's components is evaluated to a +1/0/-1 value corresponding to its bull/neutral/bear bias. The resulting value for each of the two groups are then averaged to produce the overall value for the indicator, which oscillates between +1 and -1. The complete conditions used in the calculations are documented in the Help Center .
█ NOTES
Accuracy
When comparing values to the other versions of the Rating, make sure you are comparing similar timeframes, as the "Technicals" gauge in the chart's right pane, for example, uses a 1D timeframe by default.
For coders
We use a handy characteristic of array.avg() which, contrary to avg() , does not return na when one of the averaged values is na . It will average only the array elements which are not na . This is useful in the context where the functions used to calculate the bull/neutral/bear bias for each component used in the rating include special checks to return na whenever the dataset does not yet contain enough data to provide reliable values. This way, components gradually kick in the calculations as the script calculates on more and more historical data.
We also use the new `group` and `tooltip` parameters to input() , as well as dynamic color generation of different transparencies from the bull/bear/neutral colors selected by the user.
Our script was written using the PineCoders Coding Conventions for Pine .
The description was formatted using the techniques explained in the How We Write and Format Script Descriptions PineCoders publication.
Bits and pieces were lifted from the PineCoders' MTF Selection Framework .
Look first. Then leap.
Pine Script® indicator