Dip Volume V1the very simple and very effective script, the script fetching the data from future contract data so that you can easily understand what is going inside the future data volume . and this is very important for Nifty and Bank Nifty traders
Search in scripts for "nifty"

Pluto Star - Bollinger Band Trap//DESCRIPTION
//Pluto star appears on a chart when price goes in the in the extreme price range territory, i.e. beyond 2 standard deviation from the mean (or mid Bollinger Band).
//What makes a Pluto Star appear on a chart:
//1. Check if the candle 's' high and low, both are completely outside of the Bollinger Bands (close, 20, 2) - Lets call it Pluto Star Candle
//2. Pluto Star Candle must not be a result of sudden price movement. Hence the previous candle must give a BB Blast.
// In other words, the candle must have it's either open or close outside of Bollinger Bands, to confirm a BB Blast before the Pluto Star
//3. Candle, following the Pluto Star must not break the high (in case of upper BB i.e. short call) or low (in case of lower BB, i.e. long call), to confirm the reversal to the mean
// This implies that Pluto Star appears on chart, above/below the next candle of actual Pluto Star Candle
//----- The above 3 conditions make a Pluto Star appear on a chart. But one must wait for a trade signal. Read the following conditions
//4. There is a signal line, which is nothing but ema(close,5)
//5. The red dotted line is the signal range (and also acts as Stop Loss). The price must close above/below the signal line within the signal range
//6. For a red Pluto Star (short call), the price must close below the signal line, within next 6 candles (signal range). Else there is no trigger for a trade
//7. For a green Pluto Star (long call), the price must close above the signal line, within next 6 candles (signal range). Else there is no trigger for a trade
//8. If any of the candle crosses the Stop Loss line within signal range, there is no trigger for a trade
//9. In a normal scenario, the price must return to the mean, i.e. mid Bollinger Band. In best case scenario, it must go to the opposite side Bollinger Band.
//Recommendation: Test it with Nifty and Bank Nifty charts on 30 mins and 1 hour timeframes

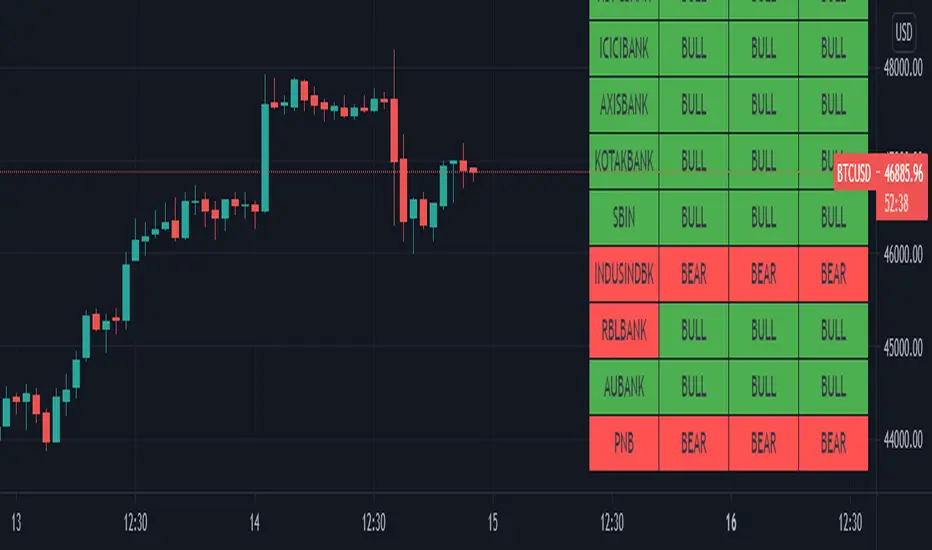
BANK NIFTY Constituents Technical Rating [tanayroy]Banknifty comprises 12 companies listed on the National Stock Exchange of India (NSE). Movement of Banknifty depends on these stocks. The script depicts Technical rating and price change stats of Banknifty constituents.
I have calculated the weight factor using annual floating stock stats available in Tradingview. So, it may differ considerably from the actual weight. It is just for reference.
I have found this useful in my trading.
Please like, share, and comment.

The M Score - Ultimate v5.0The M Score - Ultimate v5.0
*Introducing M score version 5.0*
Additions to the indicator:
1. 200 EMA Band (High-Low) added
2. Bottom left table - Shows All Time High/Lows (52 weeks) and % away we are from both. The values will not change in this table even if you change the timeframe.
3. Bottom center table - Performance matrix and a quick glance comparison with Nifty with different days of return. This will show if there outperformance or underperformance in the scripts and in which duration.
4. Top Right table - This indicator plots a table off to the right of the chart to help with determining timeframe continuity. A great edge is only taking trades where full timeframe continuity is in place (i.e. if you are going long, make sure other timeframes are also green).
Green candles have green colored boxes, red candles have red colored boxes.
Inside bars are represented by a circle - ⬤
Outside bars are represented by a tall rectangle - ▮
2-up bars are indicated by an up arrow - ▲
2-down bars are indicated by a down arrow - ▼
User defined options:
Pick any timeframe for the 4 boxes
Hope you will will like the efforts.

Jigga - Relative Strength - SectorsHi All !!
I came across relative strength concept from below indicator.
Indicator Name: (Relative-Strength by modhelius)
Note: Sorry !! Could not add indicator url here.
Formula:
RelativeStrength = (sectorValue / sectorValue ) / (indexValue / indexValue ) - 1 * 100
I used same concept and combine all sector's relative strength against Nifty50 index.
How to use:
You can change length based on your convenience and show/hide sectors.
Indicator will show strength line for that sector.
you can use this to identify momentum stocks.

Fibonaci Opening Range Candle
Fibonacci Opening Range it is 50% and 0.61% of 5 min or 30min or 1 hour opening candle
search buying opportunities below 0.61
and selling opportunities above 0.50
Also acts as good support and resistance in intraday
BEST RESULTS IN INDEXES
Thanks & Best Regards
Marella Ganesh

[CP]Pivot Boss Candlestick Scanner - No Repainting This indicator is based on the high probability candlestick patterns described in the ’Secrets of a Pivot Boss’ book.
The indicator does not suffer from repainting.
I have kept this indicator open source, so that you can take this indicator and design a complete trading system around it.
Although the patterns have some statistical edge in the markets, blindly using them as Buy/Sell Indicators will certainly result in a heavy loss.
I like some of these setups more than others, and I have listed them in the order of my likeness.
The first one I like the most, the last one, I like the least.
The patterns are universal and work well in both intraday, daily and even larger timeframes.
Signals in the example charts are manually marked by,
Hammer - profitable short signal
Rocket - profitable long signal
X - unprofitable long or short signal
GENERAL USER INPUTS:
These settings exist as the indicator uses ‘Labels’ to mark the patterns and Pine Script limits a maximum of 500 labels on a chart.
If you want to go back in the past and check how the indicator was doing, set the Start and End dates both and check the ’Use the date range above to mark the Candlestick Setups?’ option.
EXTREME REVERSAL SETUP:
This is by far my favorite setup in the lot. Classic Mean Reversion setup.
The logic, as explained in the book, goes like this,
1. The first bar of the pattern is about two times larger than the average size of the candles in the lookback period.
2. The body of the first bar of the pattern should encompass more than 50 percent of the bar’s total range, but usually not more than 85 percent.
3. The second bar of the pattern opposes the first.
The setup works extremely well in high beta stocks like Vedanta VEDL.
Feel free to play with the settings in order to better align this pattern with your favorite stock.
Check out the examples below,
No indicator is perfect, failed patterns are marked with an X.
OUTSIDE REVERSAL SETUP:
My second favorite setup, it is quite good at catching intraday trends.
Here’s the logic,
1. The engulfing bar of a bullish outside reversal setup has a low that is below the prior bar’s low and a close that is above the prior bar’s high. Reverse the conditions for bearish outside reversal.
2. The engulfing bar is usually 5 to 25 percent larger than the size of the average bar in the lookback period.
Settings for this pattern simply reflect these conditions. Feel free to modify them as you wish.
The pattern is pretty powerful and will sometimes help you catch literally all the highs and lows of the market, as shown in the examples of Vedanta VEDL and RELIANCE stocks below.
As usual, this pattern is not PERFECT either.
DOJI REVERSAL SETUP:
Doji candles signify market indecision and this pattern tries to profit off these market conditions.
Logic:
1. The open and close price of the doji should fall within 10 percent of each other, as measured by the total range of the candlestick.
2. For a bullish doji, the high of the doji candlestick should be below the ten-period simple moving average. Vice-versa for bearish.
3. For a bullish doji setup, one of the two bars following the doji must close above the high of the doji. Vice-versa for bearish.
Feel free to modify the settings and optimize according to the stock you are trading.
Don't optimize too much :)
This pattern works brilliantly well on larger intraday timeframes, like 15m/30m/60m.
This pattern also has a higher propensity to give false indications than the two described above.
Doji reversal typically helps to catch larger trend reversals. Check out the examples below from RELIANCE and NIFTY charts,
Note that the RELIANCE chart below is the same as shown for the Outside Reversal Setup above, notice the confluence of Outside
Reversal and Doji Reversal on the 31st August.
Confluence of patterns usually increases the probability of success.
RELIANCE 15m Chart - Pattern can catch nice trends on higher timeframes
NIFTY 15m Chart
WICK REVERSAL SETUP:
This pattern tries to capture candlesticks with large wick sizes, as they often indicate trend reversal when coupled with significant support and resistance levels.
Logic:
1. The body is used to determine the size of the reversal wick. A wick that is between 2.5 to 3.5 times larger than the size of the body is ideal.
2. For a bullish reversal wick to exist, the close of the bar should fall within the top 35 percent of the overall range of the candle.
3. For a bearish reversal wick to exist, the close of the bar should fall within the bottom 35 percent of the overall range of the candle.
This pattern must always be coupled with important support resistance levels, else there will be a lot of false signals.
The chart below is the same NIFTY chart as above with the Wick Reversal candles marked as well.
You can see that there are a lot of false signals, but the price also indicates ’pausing’ at important levels by printing a wick reversal setup.
You can use this information to your advantage when riding a trend.
FINAL WORDS:
Settings for various patterns simply reflect the logic described.
You will probably need to tweak and optimize the pattern settings for the stock that you are trading.
Higher Beta/Higher Volatility stocks are a great choice for these patterns.
Using these patterns at critical support and resistance levels will result in dramatically high accuracy.
Be creative and try to develop a proper system around this indicator, with rules for position sizing, stop loss etc.
You do not have to trade all the patterns. Even trading just one pattern with a proper system is good enough.
DO NOT USE THIS INDICATOR AS A BUY/SELL SYSTEM, YOU WILL LOSE MONEY.
Feel free to drop any feedback in the comments section below, or if you have any unique candlestick patterns that you would like me to code.

QuantAnna: Relative Strength Plus (RS+)NSE:TATAMOTORS
Relative strength indicator which shows ratio between two stocks/assets .. usually between stock & its indices
features of indicator is as following.
1. Values oscillates around zero, it is bullish when above zero & bearish when below zero.
1. Weighted smoothing which removes unwanted whipsaws but keeps trend curve intact.
3. In-Built list of Nifty sector indices to show stocks comparison with its sector
please do send your feedback and suggestions.

BANK NIFTY list of stocks with their multi timeframe EMA trend This script gives you an overview of banknifty and its underlying heavy weight stocks.
You can view the trend in single chart in 3 different time frames.
Color indication green for bullish and red for bearish trend
Symbol name shows green if the current day change is positive. Else red color

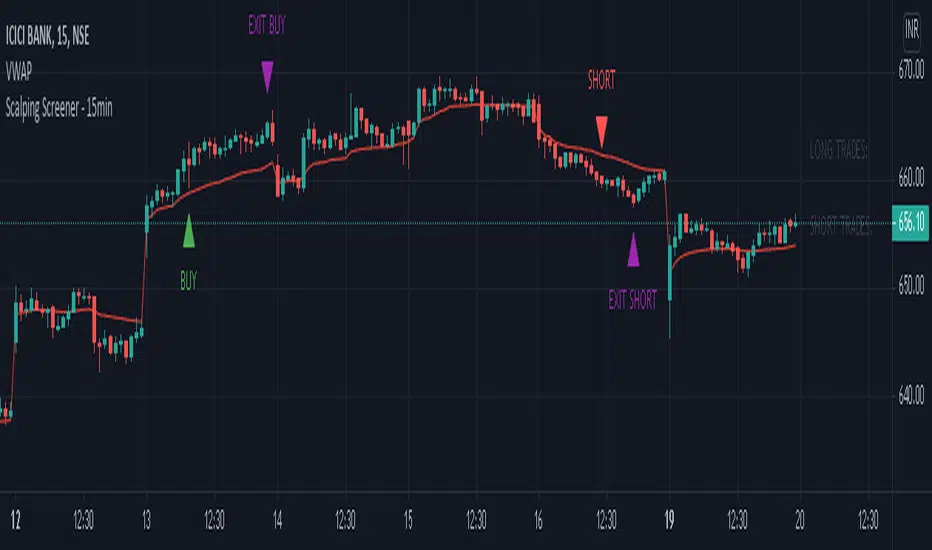
Scalping Screener - 15minSCALPING SCREENER - 15 mins (Indicator Tool)
TIME FRAME to use - 15 mins
DURATION OF TRADE - Using this indicator, Trade must be taken only during market hours and must be closed before market close (must not be carried forrward for next day).
SCALPING - This is a scalping strategy that is intended to make small profits in intraday trading
ENTRY CONCEPT -
- There must be 2 bulish candles and the 2nd candle's high should be greater than first candle's high.
- And If the latest candle high breaks high of the 2nd candle (prev candle), BUY signal is generated.
- Additional filters are added to reduce non-performaing trades.
- visa versa for SHORT signal
EXIT CONCEPT -
- 2nd candles low is the stop loss.
- Difference between 2nd candle high and 2nd candle low is target.
- The script will indicate when to BUY / SHORT and when to EXIT the trade.
INSTRUMENTS TO TRADE -
- High volatility instruments are best to be traded
- Nifty 50 stocks have been added to this indicator for the sake of screener. User can change these stocks with high volatility ones
- There is a limitation to add upto 40 scripts.
SCREENER FUNCTION -
- Right side of the chart has screener section which shows the list of stocks that qualify as per the BUY / SELL signal
NOTE -
The purpose of the scipt is for self learning / improvement and analysis.
Trading is a risky business and a trader must take any trade at their own RISK.
The author shall not be held responsible for Losses / Profits
BankNifty Multi-TimeFrames Price Panel [MaestroTrader]█ OVERVIEW
Price Panel provides Nifty /BankNifty Index comprehensive Price Insights on different time intervals. It helps to determine the trend of Index using top Index Heavy Weights along with Dow, India VIX & Index Spot Prices. It helps to determine the price behavior of the underlying Index/stock to make informed decisions while trading.
█ FEATURES
a) Displays Price in Multi Time Frames for Multi time frame analysis
b) Displays Weighted Securities price for Weighted INDEX price analysis.
c) Displays INDIA VIX and DOW for Combined INDIX VOLATALITY Analysis
█ MUTLI TIME FRAME ANALYSIS
How to use Multiple time frame analysis?
Multiple time frame analysis follows a top-down approach when trading and allows traders to gauge the longer-term trend while spotting ideal entries on a smaller time frame. Traders can then conduct technical analysis using multiple time frames to confirm or reject their trading bias.
Multiple time frame analysis, is the process of viewing the same symbols under different time frames. Usually, the larger time frame is used to establish a longer-term trend, while a shorter time frame is used to spot ideal entries into the market.
Let’s Say 75 & 15 TF’s Trend is up, then shorter time 5M is used to spot ideal entries on long side.
█ WEIGHTED INDEXS PRICE ANALYSIS
How to use Weighted Index Price Movement in Multi timeframes?
The index future trading price is based on the trading prices of the individual securities (stocks) that comprise the index basket. In other words, the stocks with higher weights will have more impact on the movement of the index. Price Panel provides the insights of these heavy weight stock price movement in different time frames, that can help you confirm or reject your trading bias.
HDFC Bank (28% Weight) will have more impact on the BankNifty Movement. By looking the top 4 bank's price movement in different timeframes, you can derive the BankNifty price trend.
█ VOLATALITY ANALYSIS
India VIX is a short form for India Volatility Index. It is the volatility index that measures the market’s expectation of volatility over the near term.
A lower VIX level usually implies that the market is confident about the movement and is expecting lower volatility and a stable range.
A higher VIX level usually signals high volatility and lower trader confidence about the current range of the market. A major directional move can be expected in the market and a quick broadening of range can be expected.
█ SETTINGS
• Time Frame Settings: Configure Time Frames 5 Min, 15 Min, 75 Min
• Table Settings: Configure Table Styles- Position- Font Color
• Symbol Settings: Configure Securities. Toggle (on/Off) Securities display.
• Index Settings: Display Bank Nifty or Nifty Heavy Weights.
█ PANEL DISPLAY VARIATIONS
BANK NIFTY VIEW
NIFTY VIEW
WITHOUT STOCKS - ONLY INDEX, VIX, DOW
█ THANKS
Thanks to Pine Team for this new great feature tables & Thanks to PineCoders for the `f_strRightOf` function.
█ DISCLIAMER
Indicator is built for educational purposes. Test it before use.
Hope - These features help you get quick insights of the price movement to take informed trades.
You are free to use the code, please share the credit for reuse.
Happy Trading !!

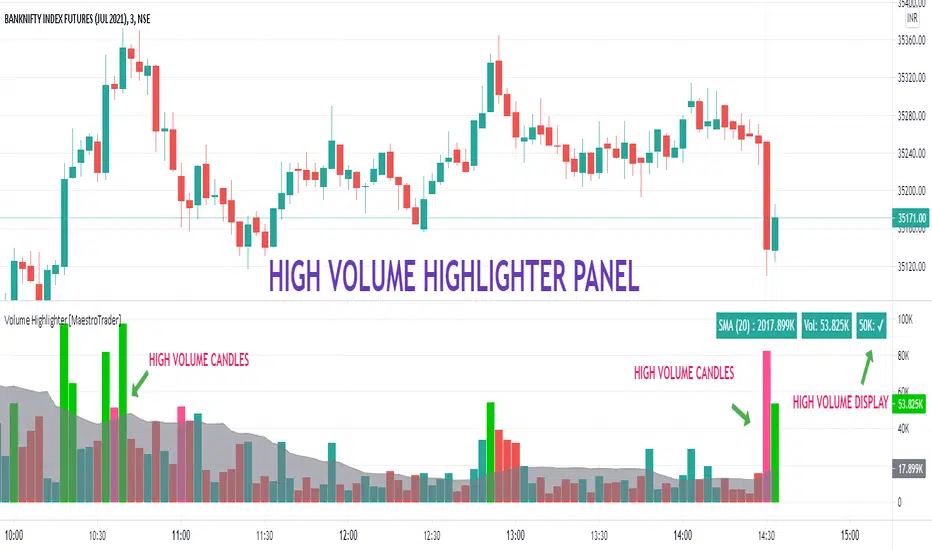
VOLUME HIGHLIGHTER PANEL (CUSTOM) [MaestroTrader]█ OVERVIEW
Volume highlighter panel provides volume insights to identify gradual increase or drop in volume or sudden volume urge that exceeds daily threshold.
It helps to determine the price behavior of the underlying Index/stock to make informed decisions while trading.
█ FEATURES
a) Displays Live SMA (20) Volume with color code. SMA Cells turns green if consecutive bar volume increases.
b) Live Volume Cell in table turns green if the volume is above average and turns red vice versa.
c) Threshold volume label appears when volume crosses the daily threshold limit.
Differences with the built-in version
This variation displays volume panel with additional volume insights for quick entry/exits.
█ SETTINGS
• Highlight Panel a) Configure Daily Volume Threshold b) configure Market session time c) Toggle highlighter on/Off d) Toggle Time on/Off (off) displays for whole period
• Volume Panel a) Configure SMA b) configure volume bar criteria c) configure Panel Display Location d) Toggle Volume Panel on/Off
█ IMPORTANT
Price always moves from trending to trading phase. Volume in Trending phase is generally high compared to volume in sideways phase. You need to identify the right volume threshold in each of the trading phases and change the settings accordingly.
█ BANKNIFTY /NIFTY VOLUME SETTINGS
BANKNIFTY - 3 MIN -50K volume
NIFTY - 3 MIN 125 K volume
Thanks to OSPL Siva for Nifty/Bank Nifty volumes. These volumes differ from trending phase & consolidation phase so adjust the threshold settings accordingly.
█ THANKS
Thanks a lot to Pine Team for this new great feature table & ‘ format. Volume ’ ! Thanks to @author=LucF, for the 'volume' logic.
█ DISCLIAMER
Indicator is built for educational purposes. Please test it thoroughly before you start using it.
You are free to use the code, please share the credit for reuse.
Hope - All these features help you get quick insights of the price movement to take the informed trades.
Happy Trading !!
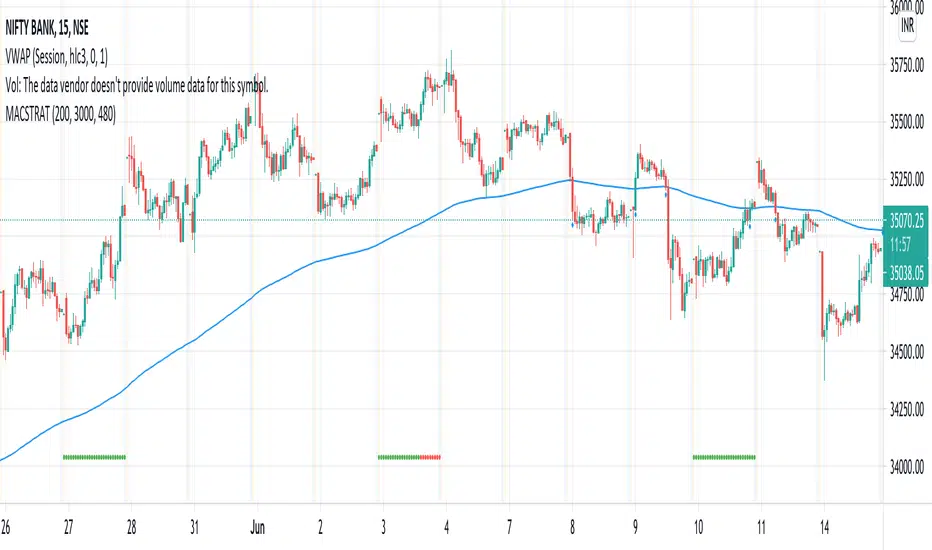
Financial Astrology Indexes ML Daily TrendDaily trend indicator based on financial astrology cycles detected with advanced machine learning techniques for some of the most important market indexes: DJI, UK100, SPX, IBC, IXIC, NI225, BANKNIFTY, NIFTY and GLD fund (not index) for Gold predictions. The daily price trend is forecasted through planets cycles (angular aspects, speed phases, declination zone), fast cycles are based on Moon, Mercury, Venus and Sun and Mid term cycles are based on Mars, Vesta and Ceres . The combination of all this cycles produce a daily price trend prediction that is encoded into a PineScript array using binary format "0 or 1" that represent sell and buy signals respectively. The indicator provides signals since 2021-01-01 to 2022-12-31, the past months signals purpose is to support backtesting of the indicator combined with other technical indicator entries like MAs, RSI or Stochastic . For future predictions besides 2022 a machine learning models re-train phase will be required.
When the signal moving average is increasing from 0 to 1 indicates an increase of buy force, when is decreasing from 1 to 0 indicates an increase in sell force, finally, when is sideways around the 0.4-0.6 area predicts a period of buy/sell forces equilibrium, traders indecision which result in a price congestion within a narrow price range.
We also have published same indicator for Crypto-Currencies research portfolio:
DISCLAIMER: This indicator is experimental and don’t provide financial or investment advice, the main purpose is to demonstrate the predictive power of financial astrology. Any allocation of funds following the documented machine learning model prediction is a high-risk endeavour and it’s the users responsibility to practice healthy risk management according to your situation.

Decision Points for TradingSimple script to highlight
Previous Day Low (PDL), Previous Day High(PDH), Previous Day Close(PDC)
Big round Numbers (BRN)
High Of the Day (HoD)
Low Of the Day (LOD)
-- Will add more DP's going fwd.
Usage : Especially useful to trade on NIFTY/Bank Nifty without any additional specific indicators.
Especially for daily analysis and intraday trading - Decision Points(DP's) are critical and will be using this simple script.

Wide BarsSimple scripts show the wide range bars within in the look back period, visualizing the bigger momentum.
Added four exponential moving averages which define the trend of the instrument.
Wide range candles in the direction of overall trend on higher timeframes; give confluence of higher participation in the same direction.
Note : Decent volume above the average volume with wide range candle adds more value.

MA Cross Weekly Options ExpiryWorks best with Nifty and Bank Nifty Options. Use this to see red or green signals on weekly contract expiry when price moves beyond or within a configured range
Intrangle - Straddle / StrangleIntrangle is an indicator to assist Nifty / Bank Nifty Option Writers / Sellers to identify the PE / CE legs to Sell for Straddle and Strangle positions for Intraday.
Basic Idea : (My Conclusion for making this Indicator)
1) Last 10 Years data says Nifty / Bank Nifty More than 66% of times Index are sideways or rangebound (within 1% day) .
2) Mostly, First one hour high and low working as good support and resistance.
Once First one hour complete, this indicator will show Strangle High (CE), Strangle Low (PE) and Straddle (CE/PE).
Straddle:
If you want to do straddle strategy, sell at the money strike (CE/PE) when price comes near to the straddle line (black line),
Strangle:
If you want to do Strangle strategy, sell Strangle High (CE) and Strangle Low (PE) when price comes near to the straddle line (black line). Both Strangle High and Low will be out of the money when price near to the straddle line (black line).
Adjustment: option adjustment to be done based on the price movement. Adjustment purely up to the user / trader.
Note1: If price not comes to near straddle line after first hour, better to stay light…
Note2: If first hour not giving wide High / Low, don’t use strangle strike based on this indicator. Straddle can be done any day with require adjustment / hedge. This Indicator is purely for education purpose, user / trader has to be back-tested before their start using it.
This indicator will work in Nifty / Bank Nifty only. Best Time frames are 3/5/15 Mins. This is purely made for Intraday
Happy Trading 😊

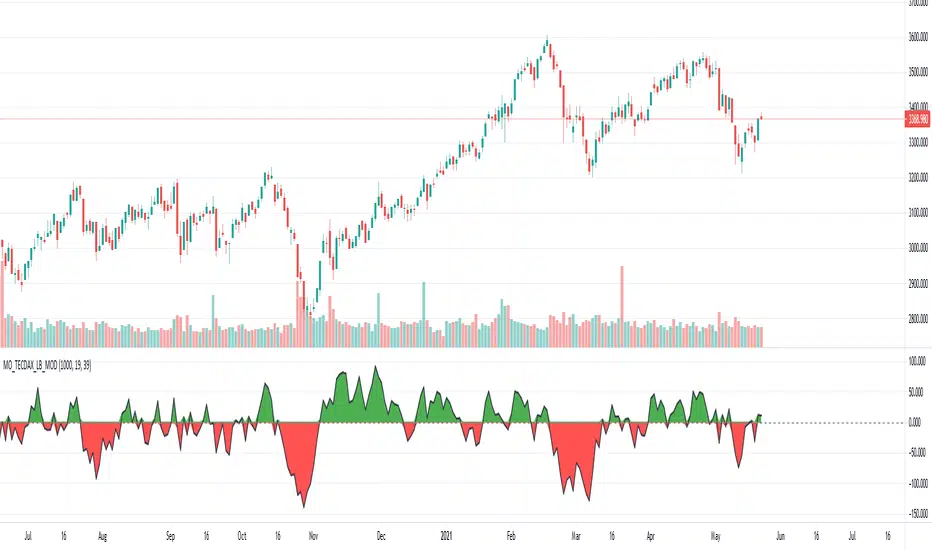
[Unxi]McClellan Oscillator for TECDAX [modified]This version is for use with the German TecDax index only!
About McClellan Oscillator
Developed by Sherman and Marian McClellan, the McClellan Oscillator is a breadth indicator derived from Net Advances, the number of advancing issues less the number of declining issues. Subtracting the 39-day exponential moving average of Net Advances from the 19-day exponential moving average of Net Advances forms the oscillator.
As the formula reveals, the McClellan Oscillator is a momentum indicator that works similar to MACD .
McClellan Oscillator signals can be generated with breadth thrusts, centerline crossovers, overall levels and divergences.
About my version
This version here is a modification, though:
- It can only be used on the German TECDAX index
- It only considers the TECDAX stocks
- The data window will provide a summary about rising and declining stocks
- The data window will output the last change for each of the 30 stocks
The script is pretty slow because it has to calculate the change for each bar individually (instead of receiving a complete calculation from the stock exchange).
This script will work on any time period. Just use whatever timeperiod you are comfortable with, the indicator will automatically adjust accordingly. It is recommended to use it with timeperiod = 1d, though.
DISCLAIMER
This script was mainly written for educational purposes (training myself how to write custom indicatotors).
As you can see, the code is really messy. Feel free to provide your feedback in the comments!
Credits
Based on the simple version of aftabmk
You can find the original version by searching for McClellan Oscillator for nifty 50.
Also got some inspiration from lazybear's version and from danarn's "Crypto McClellan Oscillator".
McClellan Oscillator for DAX (GER30) [aftabmk modified]About McClellan Oscillator
Developed by Sherman and Marian McClellan, the McClellan Oscillator is a breadth indicator derived from Net Advances, the number of advancing issues less the number of declining issues. Subtracting the 39-day exponential moving average of Net Advances from the 19-day exponential moving average of Net Advances forms the oscillator.
As the formula reveals, the McClellan Oscillator is a momentum indicator that works similar to MACD .
McClellan Oscillator signals can be generated with breadth thrusts, centerline crossovers, overall levels and divergences.
About my version
This version here is a modification, though:
- It can only be used on the DAX index (DAX 30 or GER 30)
- It only considers the DAX 30 stocks
- The data window will provide a summary about rising and declining stocks
- The data window will output the last change for each of the 30 stocks
BUG
I am only publishing this version because I am not sure if my current version is saved when I leave tradingview.com without publishing the script.
This version still contains a bug - the if/else clauses do not correctly recognize declining stocks. So the oscillator should not be used as it is.
Working on it these days. Feel free to provide feedback!
Stuff I am working on
- Coloring the area green/red according to the value
- Fixing this bug/making this script more efficient
DISCLAIMER
This script was mainly written for educational purposes (training myself how to write custom indicatotors).
As you can see, the code is really messy.
Credits
Based on the simple version of aftabmk
You can find the original version by searching for McClellan Oscillator for nifty 50.

McClellan Oscillator for nifty 50This is a indicator which indicates breath of the market.
If found relevant do let me know!!
Only handpicked relevant 20 stocks (20 +ve indicator+ 20 -ve indicator) from different sector .
As there is the limit of 40 script allowed only.
Further modifications might be there if the limit is increased to 100 (50 +50 indicator) .

Alpha & BetaHow to use Alpha(α)?
If Alpha is positive the stock outperforms, if the value is negative means the stock underperforms.
α < 0: The investment has earned too little for its risk (or, was too risky for the return)
α = 0: The investment has earned a return adequate for the risk taken
α > 0: The investment has a return in excess of the reward for the assumed risk
How to use Beta(β)?
β = 1: Exactly as volatile as the index
β > 1: More volatile than the index
β < 1 > 0: Less volatile than the index
β = 0: Uncorrelated to the index
β < 0: Negatively correlated to the index
β > 2: Trending stock
Higher the β higher risk/reward
Example: If the beta is 1.1, the share price is like to move by 10% more than the index
Trading Tip
Choose a stock with Alpha greater than 0 and Beta greater than 1.9 for intraday in 5min timeframe for long positions
Remember that such stocks will have high risk and high reward
Shortlist stocks with Beta greater than 1.9 for next day in 5min timeframe

MACD oscillator with EMA alert version 4HThis is the study/indicator alert version of the macd + ema strategy.
The strategy details are the following :
Is a simple, yet efficient strategy, which is made from a combination of an oscillator and a moving average.
Its setup for 4h candles with the current settings, however it can be adapted to other different timeframes.
It works nicely ,beating the buy and hold for both BTC and ETH over the last 3 years.
As well with some optimizations and modifications it can be adapted to futures market, indexes(NASDAQ, NIFTY etc), forex( GBPUSD ), stocks and so on.
Components:
MACD
EMA
Time condition
Long/short option
For long/exit short we enter when we are above the ema , histogram is positive and current candle is higher than previous.
For short /exit long , when close below ema , histo negative and current candles smaller than previous
If you have any questions please let me know !
