What's the current state on the DAX 30 index? Envelopes show a trendless situation (sideways) RSI shows a trendless situation, but has a very small upside tendency Custom self-written McClellan oscillator shows that there is a small upside momentum, with more index members (individual stocks) advancing; we might see the peak on this indicator soon, though ...
The mid-term chart shows signs of exaggeration: After an awesome rally, the Dow Jones might need a little break before picking up the race again In the mid-term chart with daily candles, the price has now reached the upper areas of the average oscillation corridor. This means, that the price will have a hard time to push even higher while it is more easy for...
At a first glance, Nividia's chart doesn't look very good. However, having the middle-term trend in mind, one could argue that the strong price slip could have found an end. The middle-term average oscillation corridor normally provides a huge level of confidence, and most of the time the price will not tend to leave this area of security. However, during the...
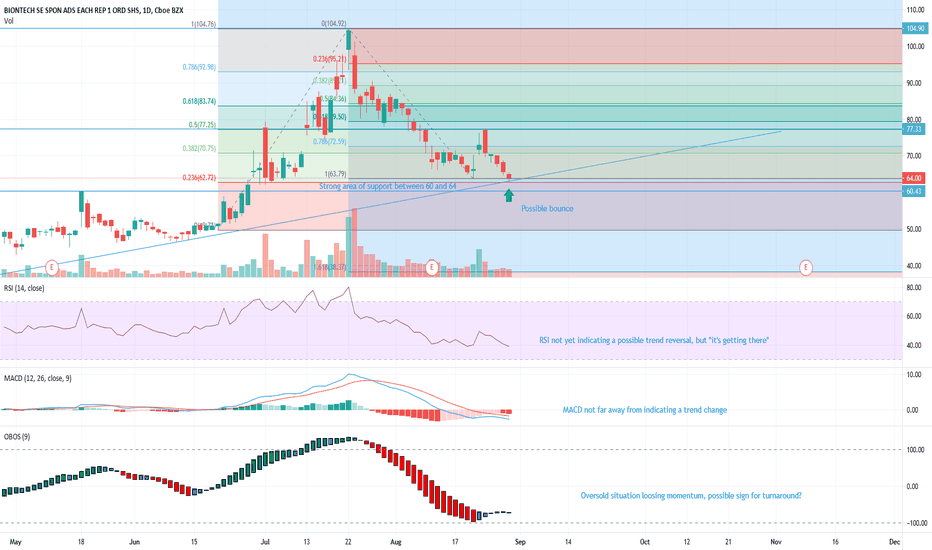
The current chart of the German biotech company BionTech might suggest that the price hits a stronger support zone, leading to a possible end of the ongoing downtrend. When viewing the trendline and Fibo retracement levels in the chart, a possible support zone between 60 and 64 USD emerges, giving a bit of confidence that we might see a switch into a sideways...
The current chart of Novavax (30-08-2020) suggests that the ongoing downtrend might find an end soon. Fibonacci retracements suggest that either the current or the next level (flagged in the chart) might provide a point of support. While the OBOS indicator gives an "oversold" signal, the MACD and RSI suggest to wait a little longer, it might be that the current...
![[DAX 30] [McClellan] Sideways/Long DAX: [DAX 30] [McClellan] Sideways/Long](https://s3.tradingview.com/i/isRhhxwQ_mid.png)


