Double SupertrendThis strategy is based on a custom indicator that was created based on the Supertrend indicator. At its core, there are always 2 super trend indicators with different factors to reduce market noise (false signals).
The strategy/indicator has some parameters to improve the signals and filters.
TECHNICAL ANALYSIS
☑ Show Indicators
This option will enable/disable the Supertrend indicators on the chart.
☑ Length
The length will be used on the Supertrend Indicator to calculate its values.
☑ Dev Fast
The fast deviation or factor from one of the super trend indicators. This will be the leading indicator for entry signals, as well as for the exit signals.
☑ Dev Slow
The slow deviation or factor from one of the super trend indicators. This will be the confirmation indicator for entry and exit signals.
☑ Exit Type
It's possible to select from 4 options for the exit signals. Exit signals always take profit target.
☑ ⥹ Reversals
This option will make the strategy/indicator calculate the exit signals based on the difference between the given period's highest and lowest candle value (see Period on this list). It's displayed on the chart with the cross. As it's possible to verify in the image below, there are multiple exit spots for every entry.
☑ ⥹ ATR
Using ATR as a base indicator for exit signals will make the strategy/indicator place limit/stop orders. Candle High + ATR for longs, Candle Low - ATR for shorts. The strategy will show the ATR level for take profit and stick with it until the next signal. This way, the take profit value remains based on the candle of the entry signal.
☑ ⥹ Fast Supertrend
With this option selected, the exit signals will be based on the Fast Supertsignal value, mirrored to make a profit.
☑ ⥹ Slow Supertrend
With this option selected, the exit signals will be based on the Slow Supertsignal value, which is mirrored to take profit.
☑ Period
This will represent the number of candles used on the exit signals when Reversals is selected as Exit Type. It's also used to calculate the gradient used on the Fills and Supertrend signals.
☑ Multiplier
It's used on the take profit when the ATR option is selected on the Exit Type.
STRATEGY
☑ Use The Strategy
This will enable/disable the strategy to show the trades calculations.
☑ Show Use Long/Short Entries
Option to make the strategy show/use Long or Short signals. Available only if Use The Strategy is enabled
☑ Show Use Exit Long/Short
Option to make the strategy show/use Exit Long or Short signals (valid when Reversals option is selected on the Exit Type). Available only if Use The Strategy is enabled
☑ Show Use Add Long/Short
Option to make the strategy show/use Add Long or Short signals. With this option enabled, the strategy will place multiple trades in the same direction, almost the same concept as a pyramiding parameter. It's based on the Fast Supersignal when the candle fails to cross and reverses. Available only if Use The Strategy is enabled
☑ Trades Date Start/End
The date range that the strategy will check the market data and make the trades
HOW TO USE
It's very straightforward. A long signal will appear as a green arrow with a text Long below it. A short signal will appear as a red arrow with a text Short above it. It's ideal to wait for the candle to finish to validate the signal.
The exit signals are optional but give a good idea of the configuration used when backtesting. Each market and timeframe will have its own configuration for the best results. On average, sticking to ATR as an exit signal will have less risk than the other options.
☑ Entry Signals
Follow the arrows with Long/Short texts on them. Wait for the signal candle to close to validate the entry.
☑ Exit Signals
Use them to close your position or to trail stop your orders and maximize profits. Select the exit type suitable for each timeframe and market
☑ Add Entries
It's possible to increase the position following the add margin/contracts based on the Add signals. Not mandatory, but may work as reentries or late entries using the same signal.
☑ What about Stop Loss?
The stop-loss levels were not included as a separated signal because it's already in the chart. There are some possible ideas for the stop loss:
☑⥹ Candle High/Low (2nd recommend option)
When it's a Long signal from the entry signal candle, the stop loss can be the Low value of the same candle. Very tight stop loss in some cases, depending on the candle range
☑⥹ Local Top/Bottom
Selecting the local top/bottom as stop loss will give the strategy more room for false breakouts or reversals, keeping the trade open and minimizing noises. Increases the risk
☑⥹ Fast Supertrend (1st recommend option)
The fast supertrend can be used as stop-loss as well. making it a moving level and working close to trail stop management
☑⥹ Fixed Percentage
It's possible to use a fixed risk percentage for the trades, making the risk easier to control and project. Since the market volatility is not fixed, this may affect the accuracy of the trades
☑⥹ Based on the ATR (3rd recommend option)
When the exit type option ATR is selected, it will display the take profit level for that entry. Just mirror that value and put it as stop-loss, or multiply that amount by 1.5 to have more room for market noise.
EXAMPLE CONFIGURATIONS
Here are some configuration ideas for some markets (all of them are from crypto, especially futures markets)
BTCUSDT 15min - Default configuration
BTCUSDT 1h - Length 10 | Dev Fast 3 | Dev Slow 4 | Exit Type ATR | Period 50 | Multiplier 1
BTCUSDT 4h - Length 10 | Dev Fast 2 | Dev Slow 4 | Exit Type ATR | Period 50 | Multiplier 1
ETHUSDT 15min - Length 20 | Dev Fast 1 | Dev Slow 3 | Exit Type Fast Supertrend | Period 50 | Multiplier 1
IOTAUSDT 15min - Length 10 | Dev Fast 1 | Dev Slow 2 | Exit Type Slow Supertrend | Period 50 | Multiplier 1
OMGUSDT 15min - Length 10 | Dev Fast 1 | Dev Slow 4 | Exit Type Slow Supertrend | Period 50 | Multiplier 1
VETUSDT 15min - Length 10 | Dev Fast 3 | Dev Slow 4 | Exit Type Slow Supertrend | Period 50 | Multiplier 1
HOW TO FIND OTHER CONFIGURATIONS
Here are some steps to find suitable configurations
select a market and time frame
enable the Use This Strategy option on the strategy
open the strategy tester panel and select the performance summary
open the strategy configuration and go to properties
change the balance to the same price of the symbol (example: BTCUSDT 60.000, use 60.000 as balance)
go back to the inputs tab and keep changing the parameters until you see the net profit be positive and bigger than the absolute value of the drawdown
in case you can't find a suitable configuration, try other timeframes
Since the tester reflects what happened in the past candles, it's not guaranteed to give the same results. However, this indicator/Strategy can be used with other indicators as a leading signal or confirmation signal.
Search in scripts for "order"

Forex Fractal EMA ScalperThis is a forex scalper designed for very short timeframes 1-5 min max.
At the same time due to the short timeframe, is recommend to re optimize it weekly .
Its components are
Fractals
Triple EMA with different lengths
Rules for entry:
For long : we have an up fractal and all 3 ema are in ascending order
For short: we have a down fractal and all 3 ema are in descending order.
Rules for exit
We exit when we either get a reverse order or when we hit the take profit or stop loss calculated in fixed pips.

Take Profit On Trend (by BHD_Trade_Bot)The purpose of strategy is to detect long-term uptrend and short-term downtrend so that you can easy to take profit.
The strategy also using BHD unit to detect how big you win and lose, so that you can use this strategy for all coins without worry about it have different percentage of price change.
ENTRY
The buy order is placed on assets that have long-term uptrend and short-term downtrend:
- Long-term uptrend condition: ema200 is going up (rsi200 greater than 51)
- Short-term downtrend condition: 2 last candles are down price (use candlestick for less delay)
CLOSE
The sell order is placed when take profit or stop loss:
- Take profit: price increase 1 BHD unit
- Stop loss: price decrease 2 BHD units
The strategy use $15 and trading fee is 0.1% for each order. So that, in the real-life, if you are using trade bot, it will need $1500 for trading 100 coins at the same time.
Pro tip : The 1-hour time frame for altcoin/USDT has the best results on average.

Webhook Starter Kit [HullBuster]
Introduction
This is an open source strategy which provides a framework for webhook enabled projects. It is designed to work out-of-the-box on any instrument triggering on an intraday bar interval. This is a full featured script with an emphasis on actual trading at a brokerage through the TradingView alert mechanism and without requiring browser plugins.
The source code is written in a self documenting style with clearly defined sections. The sections “communicate” with each other through state variables making it easy for the strategy to evolve and improve. This is an excellent place for Pine Language beginners to start their strategy building journey. The script exhibits many Pine Language features which will certainly ad power to your script building abilities.
This script employs a basic trend follow strategy utilizing a forward pyramiding technique. Trend detection is implemented through the use of two higher time frame series. The market entry setup is a Simple Moving Average crossover. Positions exit by passing through conditional take profit logic. The script creates ten indicators including a Zscore oscillator to measure support and resistance levels. The indicator parameters are exposed through 47 strategy inputs segregated into seven sections. All of the inputs are equipped with detailed tool tips to help you get started.
To improve the transition from simulation to execution, strategy.entry and strategy.exit calls show enhanced message text with embedded keywords that are combined with the TradingView placeholders at alert time. Thereby, enabling a single JSON message to generate multiple execution events. This is genius stuff from the Pine Language development team. Really excellent work!
This document provides a sample alert message that can be applied to this script with relatively little modification. Without altering the code, the strategy inputs can alter the behavior to generate thousands of orders or simply a few dozen. It can be applied to crypto, stocks or forex instruments. A good way to look at this script is as a webhook lab that can aid in the development of your own endpoint processor, impress your co-workers and have hours of fun.
By no means is a webhook required or even necessary to benefit from this script. The setups, exits, trend detection, pyramids and DCA algorithms can be easily replaced with more sophisticated versions. The modular design of the script logic allows you to incrementally learn and advance this script into a functional trading system that you can be proud of.
Design
This is a trend following strategy that enters long above the trend line and short below. There are five trend lines that are visible by default but can be turned off in Section 7. Identified, in frequency order, as follows:
1. - EMA in the chart time frame. Intended to track price pressure. Configured in Section 3.
2. - ALMA in the higher time frame specified in Section 2 Signal Line Period.
3. - Linear Regression in the higher time frame specified in Section 2 Signal Line Period.
4. - Linear Regression in the higher time frame specified in Section 2 Signal Line Period.
5. - DEMA in the higher time frame specified in Section 2 Trend Line Period.
The Blue, Green and Orange lines are signal lines are on the same time frame. The time frame selected should be at least five times greater than the chart time frame. The Purple line represents the trend line for which prices above the line suggest a rising market and prices below a falling market. The time frame selected for the trend should be at least five times greater than the signal lines.
Three oscillators are created as follows:
1. Stochastic - In the chart time frame. Used to enter forward pyramids.
2. Stochastic - In the Trend period. Used to detect exit conditions.
3. Zscore - In the Signal period. Used to detect exit conditions.
The Stochastics are configured identically other than the time frame. The period is set in Section 2.
Two Simple Moving Averages provide the trade entry conditions in the form of a crossover. Crossing up is a long entry and down is a short. This is in fact the same setup you get when you select a basic strategy from the Pine editor. The crossovers are configured in Section 3. You can see where the crosses are occurring by enabling Show Entry Regions in Section 7.
The script has the capacity for pyramids and DCA. Forward pyramids are enabled by setting the Pyramid properties tab with a non zero value. In this case add on trades will enter the market on dips above the position open price. This process will continue until the trade exits. Downward pyramids are available in Crypto and Range mode only. In this case add on trades are placed below the entry price in the drawdown space until the stop is hit. To enable downward pyramids set the Pyramid Minimum Span In Section 1 to a non zero value.
This implementation of Dollar Cost Averaging (DCA) triggers off consecutive losses. Each loss in a run increments a sequence number. The position size is increased as a multiple of this sequence. When the position eventually closes at a profit the sequence is reset. DCA is enabled by setting the Maximum DCA Increments In Section 1 to a non zero value.
It should be noted that the pyramid and DCA features are implemented using a rudimentary design and as such do not perform with the precision of my invite only scripts. They are intended as a feature to stress test your webhook endpoint. As is, you will need to buttress the logic for it to be part of an automated trading system. It is for this reason that I did not apply a Martingale algorithm to this pyramid implementation. But, hey, it’s an open source script so there is plenty of room for learning and your own experimentation.
How does it work
The overall behavior of the script is governed by the Trading Mode selection in Section 1. It is the very first input so you should think about what behavior you intend for this strategy at the onset of the configuration. As previously discussed, this script is designed to be a trend follower. The trend being defined as where the purple line is predominately heading. In BiDir mode, SMA crossovers above the purple line will open long positions and crosses below the line will open short. If pyramiding is enabled add on trades will accumulate on dips above the entry price. The value applied to the Minimum Profit input in Section 1 establishes the threshold for a profitable exit. This is not a hard number exit. The conditional exit logic must be satisfied in order to permit the trade to close. This is where the effort put into the indicator calibration is realized. There are four ways the trade can exit at a profit:
1. Natural exit. When the blue line crosses the green line the trade will close. For a long position the blue line must cross under the green line (downward). For a short the blue must cross over the green (upward).
2. Alma / Linear Regression event. The distance the blue line is from the green and the relative speed the cross is experiencing determines this event. The activation thresholds are set in Section 6 and relies on the period and length set in Section 2. A long position will exit on an upward thrust which exceeds the activation threshold. A short will exit on a downward thrust.
3. Exponential event. The distance the yellow line is from the blue and the relative speed the cross is experiencing determines this event. The activation thresholds are set in Section 3 and relies on the period and length set in the same section.
4. Stochastic event. The purple line stochastic is used to measure overbought and over sold levels with regard to position exits. Signal line positions combined with a reading over 80 signals a long profit exit. Similarly, readings below 20 signal a short profit exit.
Another, optional, way to exit a position is by Bale Out. You can enable this feature in Section 1. This is a handy way to reduce the risk when carrying a large pyramid stack. Instead of waiting for the entire position to recover we exit early (bale out) as soon as the profit value has doubled.
There are lots of ways to implement a bale out but the method I used here provides a succinct example. Feel free to improve on it if you like. To see where the Bale Outs occur, enable Show Bale Outs in Section 7. Red labels are rendered below each exit point on the chart.
There are seven selectable Trading Modes available from the drop down in Section 1:
1. Long - Uses the strategy.risk.allow_entry_in to execute long only trades. You will still see shorts on the chart.
2. Short - Uses the strategy.risk.allow_entry_in to execute short only trades. You will still see long trades on the chart.
3. BiDir - This mode is for margin trading with a stop. If a long position was initiated above the trend line and the price has now fallen below the trend, the position will be reversed after the stop is hit. Forward pyramiding is available in this mode if you set the Pyramiding value in the Properties tab. DCA can also be activated.
4. Flip Flop - This is a bidirectional trading mode that automatically reverses on a trend line crossover. This is distinctively different from BiDir since you will get a reversal even without a stop which is advantageous in non-margin trading.
5. Crypto - This mode is for crypto trading where you are buying the coins outright. In this case you likely want to accumulate coins on a crash. Especially, when all the news outlets are talking about the end of Bitcoin and you see nice deep valleys on the chart. Certainly, under these conditions, the market will be well below the purple line. No margin so you can’t go short. Downward pyramids are enabled for Crypto mode when two conditions are met. First the Pyramiding value in the Properties tab must be non zero. Second the Pyramid Minimum Span in Section 1 must be non zero.
6. Range - This is a counter trend trading mode. Longs are entered below the purple trend line and shorts above. Useful when you want to test your webhook in a market where the trend line is bisecting the signal line series. Remember that this strategy is a trend follower. It’s going to get chopped out in a range bound market. By turning on the Range mode you will at least see profitable trades while stuck in the range. However, when the market eventually picks a direction, this mode will sustain losses. This range trading mode is a rudimentary implementation that will need a lot of improvement if you want to create a reliable switch hitter (trend/range combo).
7. No Trade. Useful when setting up the trend lines and the entry and exit is not important.
Once in the trade, long or short, the script tests the exit condition on every bar. If not a profitable exit then it checks if a pyramid is required. As mentioned earlier, the entry setups are quite primitive. Although they can easily be replaced by more sophisticated algorithms, what I really wanted to show is the diminished role of the position entry in the overall life of the trade. Professional traders spend much more time on the management of the trade beyond the market entry. While your trade entry is important, you can get in almost anywhere and still land a profitable exit.
If DCA is enabled, the size of the position will increase in response to consecutive losses. The number of times the position can increase is limited by the number set in Maximum DCA Increments of Section 1. Once the position breaks the losing streak the trade size will return the default quantity set in the Properties tab. It should be noted that the Initial Capital amount set in the Properties tab does not affect the simulation in the same way as a real account. In reality, running out of money will certainly halt trading. In fact, your account would be frozen long before the last penny was committed to a trade. On the other hand, TradingView will keep running the simulation until the current bar even if your funds have been technically depleted.
Entry and exit use the strategy.entry and strategy.exit calls respectfully. The alert_message parameter has special keywords that the endpoint expects to properly calculate position size and message sequence. The alert message will embed these keywords in the JSON object through the {{strategy.order.alert_message}} placeholder. You should use whatever keywords are expected from the endpoint you intend to webhook in to.
Webhook Integration
The TradingView alerts dialog provides a way to connect your script to an external system which could actually execute your trade. This is a fantastic feature that enables you to separate the data feed and technical analysis from the execution and reporting systems. Using this feature it is possible to create a fully automated trading system entirely on the cloud. Of course, there is some work to get it all going in a reliable fashion. Being a strategy type script place holders such as {{strategy.position_size}} can be embedded in the alert message text. There are more than 10 variables which can write internal script values into the message for delivery to the specified endpoint.
Entry and exit use the strategy.entry and strategy.exit calls respectfully. The alert_message parameter has special keywords that my endpoint expects to properly calculate position size and message sequence. The alert message will embed these keywords in the JSON object through the {{strategy.order.alert_message}} placeholder. You should use whatever keywords are expected from the endpoint you intend to webhook in to.
Here is an excerpt of the fields I use in my webhook signal:
"broker_id": "kraken",
"account_id": "XXX XXXX XXXX XXXX",
"symbol_id": "XMRUSD",
"action": "{{strategy.order.action}}",
"strategy": "{{strategy.order.id}}",
"lots": "{{strategy.order.contracts}}",
"price": "{{strategy.order.price}}",
"comment": "{{strategy.order.alert_message}}",
"timestamp": "{{time}}"
Though TradingView does a great job in dispatching your alert this feature does come with a few idiosyncrasies. Namely, a single transaction call in your script may cause multiple transmissions to the endpoint. If you are using placeholders each message describes part of the transaction sequence. A good example is closing a pyramid stack. Although the script makes a single strategy.close() call, the endpoint actually receives a close message for each pyramid trade. The broker, on the other hand, only requires a single close. The incongruity of this situation is exacerbated by the possibility of messages being received out of sequence. Depending on the type of order designated in the message, a close or a reversal. This could have a disastrous effect on your live account. This broker simulator has no idea what is actually going on at your real account. Its just doing the job of running the simulation and sending out the computed results. If your TradingView simulation falls out of alignment with the actual trading account lots of really bad things could happen. Like your script thinks your are currently long but the account is actually short. Reversals from this point forward will always be wrong with no one the wiser. Human intervention will be required to restore congruence. But how does anyone find out this is occurring? In closed systems engineering this is known as entropy. In practice your webhook logic should be robust enough to detect these conditions. Be generous with the placeholder usage and give the webhook code plenty of information to compare states. Both issuer and receiver. Don’t blindly commit incoming signals without verifying system integrity.
Setup
The following steps provide a very brief set of instructions that will get you started on your first configuration. After you’ve gone through the process a couple of times, you won’t need these anymore. It’s really a simple script after all. I have several example configurations that I used to create the performance charts shown. I can share them with you if you like. Of course, if you’ve modified the code then these steps are probably obsolete.
There are 47 inputs divided into seven sections. For the most part, the configuration process is designed to flow from top to bottom. Handy, tool tips are available on every field to help get you through the initial setup.
Step 1. Input the Base Currency and Order Size in the Properties tab. Set the Pyramiding value to zero.
Step 2. Select the Trading Mode you intend to test with from the drop down in Section 1. I usually select No Trade until I’ve setup all of the trend lines, profit and stop levels.
Step 3. Put in your Minimum Profit and Stop Loss in the first section. This is in pips or currency basis points (chart right side scale). Remember that the profit is taken as a conditional exit not a fixed limit. The actual profit taken will almost always be greater than the amount specified. The stop loss, on the other hand, is indeed a hard number which is executed by the TradingView broker simulator when the threshold is breached.
Step 4. Apply the appropriate value to the Tick Scalar field in Section 1. This value is used to remove the pipette from the price. You can enable the Summary Report in Section 7 to see the TradingView minimum tick size of the current chart.
Step 5. Apply the appropriate Price Normalizer value in Section 1. This value is used to normalize the instrument price for differential calculations. Basically, we want to increase the magnitude to significant digits to make the numbers more meaningful in comparisons. Though I have used many normalization techniques, I have always found this method to provide a simple and lightweight solution for less demanding applications. Most of the time the default value will be sufficient. The Tick Scalar and Price Normalizer value work together within a single calculation so changing either will affect all delta result values.
Step 6. Turn on the trend line plots in Section 7. Then configure Section 2. Try to get the plots to show you what’s really happening not what you want to happen. The most important is the purple trend line. Select an interval and length that seem to identify where prices tend to go during non-consolidation periods. Remember that a natural exit is when the blue crosses the green line.
Step 7. Enable Show Event Regions in Section 7. Then adjust Section 6. Blue background fills are spikes and red fills are plunging prices. These measurements should be hard to come by so you should see relatively few fills on the chart if you’ve set this up as intended. Section 6 includes the Zscore oscillator the state of which combines with the signal lines to detect statistically significant price movement. The Zscore is a zero based calculation with positive and negative magnitude readings. You want to input a reasonably large number slightly below the maximum amplitude seen on the chart. Both rise and fall inputs are entered as a positive real number. You can easily use my code to create a separate indicator if you want to see it in action. The default value is sufficient for most configurations.
Step 8. Turn off Show Event Regions and enable Show Entry Regions in Section 7. Then adjust Section 3. This section contains two parts. The entry setup crossovers and EMA events. Adjust the crossovers first. That is the Fast Cross Length and Slow Cross Length. The frequency of your trades will be shown as blue and red fills. There should be a lot. Then turn off Show Event Regions and enable Display EMA Peaks. Adjust all the fields that have the word EMA. This is actually the yellow line on the chart. The blue and red fills should show much less than the crossovers but more than event fills shown in Step 7.
Step 9. Change the Trading Mode to BiDir if you selected No Trades previously. Look on the chart and see where the trades are occurring. Make adjustments to the Minimum Profit and Stop Offset in Section 1 if necessary. Wider profits and stops reduce the trade frequency.
Step 10. Go to Section 4 and 5 and make fine tuning adjustments to the long and short side.
Example Settings
To reproduce the performance shown on the chart please use the following configuration: (Bitcoin on the Kraken exchange)
1. Select XBTUSD Kraken as the chart symbol.
2. On the properties tab set the Order Size to: 0.01 Bitcoin
3. On the properties tab set the Pyramiding to: 12
4. In Section 1: Select “Crypto” for the Trading Model
5. In Section 1: Input 2000 for the Minimum Profit
6. In Section 1: Input 0 for the Stop Offset (No Stop)
7. In Section 1: Input 10 for the Tick Scalar
8. In Section 1: Input 1000 for the Price Normalizer
9. In Section 1: Input 2000 for the Pyramid Minimum Span
10. In Section 1: Check mark the Position Bale Out
11. In Section 2: Input 60 for the Signal Line Period
12. In Section 2: Input 1440 for the Trend Line Period
13. In Section 2: Input 5 for the Fast Alma Length
14. In Section 2: Input 22 for the Fast LinReg Length
15. In Section 2: Input 100 for the Slow LinReg Length
16. In Section 2: Input 90 for the Trend Line Length
17. In Section 2: Input 14 Stochastic Length
18. In Section 3: Input 9 Fast Cross Length
19. In Section 3: Input 24 Slow Cross Length
20. In Section 3: Input 8 Fast EMA Length
21. In Section 3: Input 10 Fast EMA Rise NetChg
22. In Section 3: Input 1 Fast EMA Rise ROC
23. In Section 3: Input 10 Fast EMA Fall NetChg
24. In Section 3: Input 1 Fast EMA Fall ROC
25. In Section 4: Check mark the Long Natural Exit
26. In Section 4: Check mark the Long Signal Exit
27. In Section 4: Check mark the Long Price Event Exit
28. In Section 4: Check mark the Long Stochastic Exit
29. In Section 5: Check mark the Short Natural Exit
30. In Section 5: Check mark the Short Signal Exit
31. In Section 5: Check mark the Short Price Event Exit
32. In Section 5: Check mark the Short Stochastic Exit
33. In Section 6: Input 120 Rise Event NetChg
34. In Section 6: Input 1 Rise Event ROC
35. In Section 6: Input 5 Min Above Zero ZScore
36. In Section 6: Input 120 Fall Event NetChg
37. In Section 6: Input 1 Fall Event ROC
38. In Section 6: Input 5 Min Below Zero ZScore
In this configuration we are trading in long only mode and have enabled downward pyramiding. The purple trend line is based on the day (1440) period. The length is set at 90 days so it’s going to take a while for the trend line to alter course should this symbol decide to node dive for a prolonged amount of time. Your trades will still go long under those circumstances. Since downward accumulation is enabled, your position size will grow on the way down.
The performance example is Bitcoin so we assume the trader is buying coins outright. That being the case we don’t need a stop since we will never receive a margin call. New buy signals will be generated when the price exceeds the magnitude and speed defined by the Event Net Change and Rate of Change.
Feel free to PM me with any questions related to this script. Thank you and happy trading!
CFTC RULE 4.41
These results are based on simulated or hypothetical performance results that have certain inherent limitations. Unlike the results shown in an actual performance record, these results do not represent actual trading. Also, because these trades have not actually been executed, these results may have under-or over-compensated for the impact, if any, of certain market factors, such as lack of liquidity. Simulated or hypothetical trading programs in general are also subject to the fact that they are designed with the benefit of hindsight. No representation is being made that any account will or is likely to achieve profits or losses similar to these being shown.

WEEKLY BTC TRADING SCRYPTWeekly BTC Trading Scrypt(WBTS)
This script is only suggested for cryptocurrencies and weekly buying strategy which is long term.Using it in another markets(e.g forex,stock,e.t.c) is not suggested. The thing makes it different than other strategies we try to understand bull and bear seasons and buying selected crypto currency as using formula if weekly closing value crossover eight weeks simple moving avarage buy,else if selected crypto currency's weekly closing value crossunder eight weeks simple avarage sell. Eight week moving avarage is also uses weekly closing prices but for being able to use this strategy ,trading pair must have more than eight candles in weekly chart otherwise the 8 weeks simple moving avarage value cannot be calculated and script does not work.
This script has a chart called WBTS and it has following features:
Strategy group consist of 3 inputs:
1)Source: Close by default. Our whole strategy uses close values. You can change it but not suggested.
2)Loss Ratio: Because of the cases like the circumstances that manipulates market or high volatility , sometimes graphic show wrong buying signals and this ratio saves user from big money looses(Note : This ratio will always work when selling condition occurs to make user take his profit or prevent him to loss more money because of a wrong positive comes from the indicator.)
3)Reward Ratio : When selling condition happens it will exit user with more profit(if price is already higher than buying point) otherwise it will dimunish loss a bit(if user is below of buying point) or prevents looses(if user is in buying point when selling condition happened.
MA group consist of 2 inputs:
COLOR:Specifies color of the moving avarage.It is equal to #FF3232by hex color code by default.
LINE WIDTH: Specifies linewidth of the moving avarage. It is 2 by default.
GRAPHIC group consist of 2 inputs:
COLOR: It specifies the color of the line which consist of weekly closing prices. It is equal to #6666FF hex color code by default.
LINE WIDTH: Specifies linewidth of the line which consist of weekly closing prices. It is 2 by default.
STRATEGY EXECUTION YEAR: It will show the orders,profits and looses done by script after the input year giving in it.It is 2020 by default.
The last feature is strategy equity,it is not in one of these groups. User should click on settings button on the WBTS indicator than chose Style section and there is a deactivated check box near in the plot section if user activate it, the equity line will show in indicator's graph.
Logic of This Strategy:The story of this strategy began when I studied BTC's price movement from 2020 to today with 8 weeks simple moving avarage (it takes weekly closes as source) and weekly clossing values. I understood that there was a perfect interest between bull and bear market and following conditions:
buy_condition=crossover(weekly_closing_values,8_week_simple_moving_avarage)
sell_condition=crossover(weekly_closing_values,8_week_simple_moving_avarage)
and I tried same thing on the same and bigger time frames("for example i studied how the strategy works from the beginning to today with bitcoin and what is our final equity") with bitcoin and other cryptocurrencies and this made me saw better the relation between giving conditions and general market psychology, however I also witnessed some wrong positives coming by script and used a risk reward ratio to save user and set risk reward ratio 1/3 after a research.
For both conditions(buy_condition and sell_condition),when they are realised,script will alert users and an order will be triggered.
Before finishing the description,from settings/properties/ user can set initial capital,base currency,order size and type,but it is 100000 for initial_amount and 1 contract for order size by default.
In backtesting I used the options like the following example :
Initial capital=1000
Base_curreny=USD
Order size=40 USD
Properties place must set different by every single user according to his or her capital and order size must not be higher than his total money because this script is not the best or a good script for derivatives. It is only written for long term-crypto spot trading and I strongly recommend to users that margin may cause bad results and please do not use it with any margin or any market different than crypto market.
Thank you very much for reading)

Qullamaggie Breakout V2After publishing the Qullamaggie Breakout script and seeing that it had some decent results, I wanted to explore it a bit further. There were a few things I didn't like about that methodology that didn't really jive with the way I like to trade. So what I did was combined the Breakout Trend Follower strategy I had been using for entries with the Qullamaggie strategy for trailing stops once in profit. The results seem pretty good to me and an approach that fits my personality and something I can actually trade. Typically better profit than the Breakout Trend Follower by giving more room for your winners to run, while still protecting your entries by moving up the trailing stop until you are in profit, all while taking less trades, so that's great.
Everything is done with stop orders. So you set your buy stop at the recent swing high point and wait for a breakout. Once in a position you set your sell stop at the recent swing low point. The most recent swing high and low are shown on the chart for easy reference with the blue and orange horizontal lines. Once in a trade, trail your sell stop after a new swing low is registered (shown by the thicker orange stop line). Once you are in profit, leave that hard stop level there (the orange line will stay there helping you). Now, you wait for price to cross a Moving Average of your choosing (default is Daily 10 MA). Once the bar crosses that moving average, you move your stop to the low of that candle (shown by the blue stop line) and trail your stop along every crossing of the moving average until the trend changes and takes out your stop. So managing this trade is pretty easy...just wait for the stop lines to move and move your stop with them. It's a great way to trade when you can't be at your computer all the time because the stop orders take care of execution on both buy and sell side. If you use a daily timeframe for your moving averages (the default), you really only need to move stops around about once a day, so is a good part time trader's strategy in my opinion.
The best opportunities will come by scanning for stocks in the longer term timeframe of your moving averages. Wait for a consolidation on that timeframe so the anticipated breakout has some room to run. Once you've identified a good candidate, zoom in to your lower timeframe where the swing highs/lows will act as your entry and exit points, all while keeping the moving averages consistent between timeframes.
Hope you guys find it useful.
A few options available:
- Choose any timeframe for your moving averages, while using swing high/low points on intraday charts.
- Choose one of two moving averages shown for your trailing stops (default 10 and 20 MA).
- Choose to use the third moving average as a filter for keeping you out of trades that are below it (trading with the trend).
- Use the charts resolution candle or the moving average resolution candle for the moving average trailing stop.
- Only take trades where your buy level minus stop level is below a % of the Average Daily Range (ADR). This allows you to potentially have better risk/reward. I added a little table that shows the ADR of the stock/ticker as well as the range between the recent buy and sell levels (shown by the orange and blue horizontal lines) for easy reference.

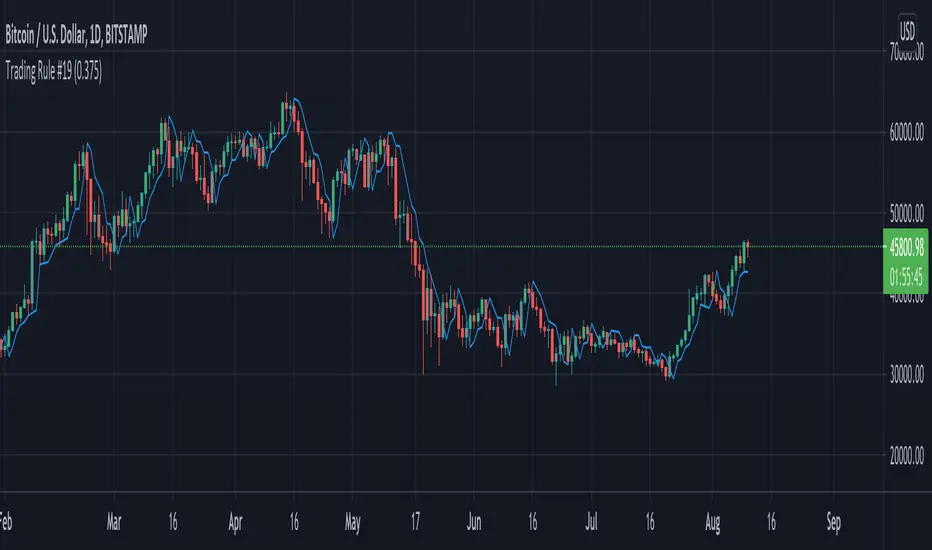
Trading Rule #19This script is based on Trading Rule #19 from Chester Keltner's book How To Make Money On Commodities. It is best applied to candlestick charts with longer time frames and plans with minimal losses (i.e. swing trades). The rule is based on "Key" trend days (this is applied to daily charts in the book).
An initial Key-Up day is established on the third day of 3 consecutive new highs. Subsequent key-up days are determined as follows:
1. The first day following an initial key-up day trades 0.375% above the previous key-up day
2. The second day or any following day trades 0.125% above the previous key-up day
An initial Key-Down day is established on the third day of 3 consecutive new lows. Subsequent key-down days are determined as follows:
1. The first day following an initial key-up day trades 0.375% below the previous key-down day
2. The second day or any following day trades 0.125% below the previous key-down day
Green candles are considered up-trend, red candles are down-trend. Gray candles are undecided - when there is a new high and low in the same time frame, when there is no new high or low in that time frame, or the order price was cleared.
Order prices are represented as a blue line, with some days being "na" when order prices remain unchanged. On key-up days, orders are placed 0.375% below the low of the previous key-up day or the day previous (whichever is lower). Order prices on key-down days are placed 0.375% above the high of the previous key-down day or the day previous (whichever is higher).
The tolerance setting mainly effects the plot point of order price, at a certain point key-trend rules will take priority over order price (meaning if tolerance is high enough, order price will have no effect on determining key-trends).
3 EMA Stochastik RSI ATR SL TP only LONGHey there!
Here i will show you the 3 EMA RSI Stochastic Crossover strategy with an ATR SL and TP.
The strategy works as follows:
For long positions, the EMA's must be in the following order:
The 8 E M A must be above the 14 E M A and the 14 E M A must be above the 50 E M A.
The buy signal is given to us by the Stochastic RSI indicators.
The K line must cross the D line above. The following candle must then close above all E M A's.
The stop loss is determined by three times the value of the ATR.
The take profit is determined by two times the value of the ATR.
In this strategy only long positions are traded.

[laoowai]BNB_USDT_3m_3Commas_Bollinger_MACD_RSI_StrategyBNB_USDT _3m
Release Notes:
Time: 3min
Pair: BNB_USDT
Use: {{strategy.order.alert_message}}
What's the difference with 3Commas Bollinger Strategy by tedwardd:
1. Initial capital: 1210 USDT (10$ Base order / 400$*3 Safety order), if you will change, please change JUST safety order volume or number of safety orders 2-3
2. Using just 2(3) safety order (original script 4)
3. More high-performance strategy for BNB_USDT
4. Using MACD to sell order (original script take profit by scale), thanks Drun30 .
5. Using RSI to analyze the market conditions.
Need to change:
bot_id = input(title="3Commas Bot ID", defval=" YOUR DATA ")
email_token = input(title="Bot Email Token", defval=" YOUR DATA ")
---------------------------------------------------------------------------------------------------------------------------------------------------------------------------------------------------
FAQ copy from tedwardd
---------------------------------------------------------------------------------------------------------------------------------------------------------------------------------------------------
This strategy is intended for use as a way of backtesting various parameters available on 3commas.
The primary inputs for the strategy are:
---------------------------------------------------------------------------------------------------------------------------------------------------------------------------------------------------
// USER INPUTS
Short MA Window - The length of the Short moving average
Long MA Window - The length of the Long moving average
Upper Band Offset - The offset to use for the upper bollinger offset
Lower Band Offset - The offset to use for the lower bollinger offset
Long Stop Loss % - The stop loss percentage to test
Long Take Profit % - The Take profit percentage to test
Initial SO Deviation % - The price deviation percentage required to place to first safety order
Safety Order Vol Step % - The volume scale to test
3Commas Bot ID - (self-explanatory)
Bot Email Token - Found in the deal start message for your bot (see link in the previous section for details)
3Commas Bot Trading Pair - The pair to include for composite bot start deals (should match the format of 3commas, not TradingView IE. USDT_BTC not BTCUSDT )
---------------------------------------------------------------------------------------------------------------------------------------------------------------------------------------------------
Start Date, Month, Year and End Date, Month, and Year all apply to the backtesting window. By default, it will use as much data as it can give the current period select (there is less historical data available for periods below 1H) back as far as 2016 (there appears to be no historical data on Trading view much before this). If you would like to test a different period of time, just change these values accordingly.
---------------------------------------------------------------------------------------------------------------------------------------------------------------------------------------------------
Composite bot using a Bollinger band type trading strategy. While its primary intention is to provide users a way of backtesting bot parameters, it can also be used to trigger a deal start by either using the {{strategy.order.alert_message}} field in your alert and providing the bot details in the configuration screen for the strategy or by including the usual deal start message provided by 3commas.
---------------------------------------------------------------------------------------------------------------------------------------------------------------------------------------------------
Original script:
1. 3Commas Bollinger Strategy by tedwardd
2. Momentum Strategy ( BTC /USDT; 1h) - MACD (with source code) by Drun30

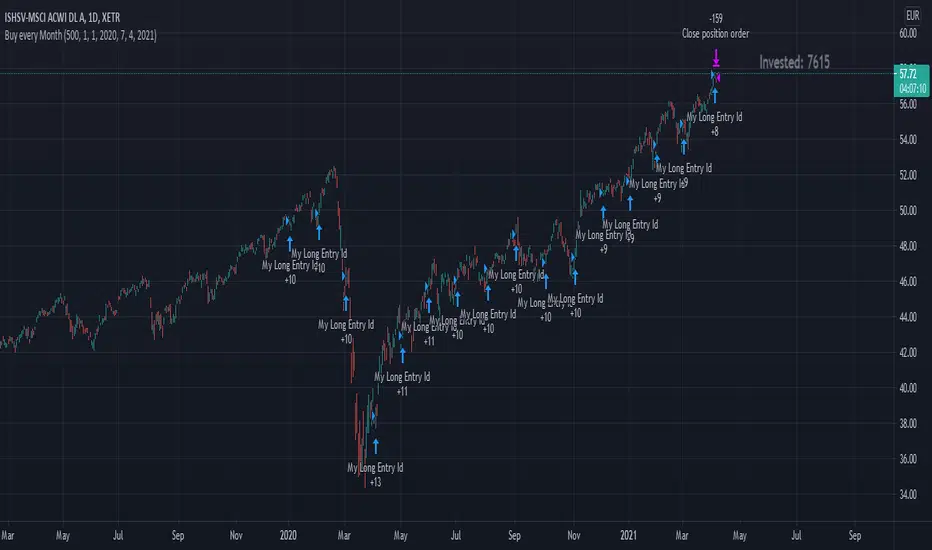
Buy every MonthThis strategy script simulates, if you invest every new month.
Features:
You can set a Date Range
You can set your Sparrate/how much you want to invest every month
In the Right Corner you can see, how much you invested so far
In the End of the Date Range, all positions get closed and you can see your performance.
Note: Please ignore the "Ordersize" Option from the Propeties Tab and use the "Ordersize / Sparrate" option from the Inputs Tab.
With best regards Embit0one.
Diese Strategie simuliert einen Sparplan der jeden Monat eine Summe x investiert.
Features:
Das Start und End Datum für den Sparplan ist frei wählbar
Die Sparrate pro Monat ist einstellbar
In der rechten oberen Ecke sieht man, wieviel bisher investiert wurde
Am End-Datum werden alle Positionen geschlossen und man kann sich das Ergebnis ansehen. Um zu sehen wieviel Prozent man gemacht hat, sollte man die investierte Summe im Feld "Initial Capital" eingeben und im Performance Tab der Strategy nachschauen.
Notiz: Bitte die Sparrate im Inputs Tab eingeben, der Wert im Propeties Tab wird nicht verwendet.
Mit freundlichen Grüßen Embit0one.
RSI+PA+DCA StrategyDear Tradingview community,
This RSI based trading strategy is created as a training exercise. I am not a professional trader, but a committed hobbyist. This not a finished trading strategy meant for trading, but more a combination of different trading ideas I liked to explore deeper. The aim with this exercise was to gain more knowledge and understanding about price averaging and dollar cost averaging strategies. Aside that I wanted to learn how to program a pyramiding strategy, how to plot different order entry layers and how to open positions on a specific time interval.
In this script I adapted code from a couple of strategy examples by Coinrule . Who wrote simple and powerful examples of RSI based strategies and pyramiding strategies.
Also the HOWTO scripts shared by vitvlkv were very helpful for this exercise. In the script description you can find all the sources to the code.
A PA strategy could be a helpful addition to ease the 'stress-management to buy when price drops and resolution in selling when the price is rising' (Coinrule).
The idea behind the strategy is fairly simple and is based on an RSI strategy of buying low. A position is entered when the RSI and moving average conditions are met. The position is closed when it reaches a specified take profit percentage. As soon as the first the position is openend multiple PA (price average) layers are setup based on a specified percentage of price drop. When the price crosses the layer another position with somewhat the same amount of assets is entered. This causes the average cost price (the red plot line) to decrease. If the price drops more, another similar amount of assets is bought with another price average decrease as result. When the price starts rising again the different positions are separately closed when each reaches its specified take profit. The positions can be re-openend when the price drops again. And so on. When the price rises more and crosses over the average price and reached the specified take profit on top of it, it closes all the positions at once and cancels all orders. From that moment on it waits for another price dip before it opens a new position.
Another option is to activate a DCA function that opens a position based on a fixed specified amount. It enters a position at the start of every week and only when there are already other positions openend and if the current price is below the average price of the position. Like this buying on a time interval can help lowering the average price in case the market is down.
I read in some articles that price averaging is also called dollar cost averaging as the result is somewhat the same. Although DCA is really based on buying on fixed time intervals. These strategies are both considered long term investment strategies that can be profitable in the long run and are not suitable for short term investment schemes. The downturn is that the postion size increases when the general market trend is going down and that you have to patiently wait until the market start rising again.
Another notable aspect is that the logic in this strategy works the way it does because the entries are exited based on the FIFO (first in first out) close entry rule. This means that the first exit is applied to the first entry position that is openend. In other words that when the third entry reaches its take profit level and exits, it actually exits the first entry. If you take a close look in the 'List of Trades' of your Strategy Tester panel, you can see that some 'Long1' entries are closed by an 'Exit 3' and not by an 'Exit 1'. This means that your trade partly loses, but causes a decrease in average price that is later balanced out by lower or repeated entering and closing other positions. You can change this logic to a real sequential way of closing your entries, but this changes the averaging logic considerably. In case you want to test this you need to change, in this line in the strategy call 'close_entries_rule = "FIFO"', the word FIFO to ANY.
In the settings you can specify the percentage of portfolio to use for each trade to spread the risk and for each order a trading fee of 0.075% is calculated.

Matrix Library (Linear Algebra, incl Multiple Linear Regression)What's this all about?
Ever since 1D arrays were added to Pine Script, many wonderful new opportunities have opened up. There has been a few implementations of matrices and matrix math (most notably by TradingView-user tbiktag in his recent Moving Regression script: ). However, so far, no comprehensive libraries for matrix math and linear algebra has been developed. This script aims to change that.
I'm not math expert, but I like learning new things, so I took it upon myself to relearn linear algebra these past few months, and create a matrix math library for Pine Script. The goal with the library was to make a comprehensive collection of functions that can be used to perform as many of the standard operations on matrices as possible, and to implement functions to solve systems of linear equations. The library implements matrices using arrays, and many standard functions to manipulate these matrices have been added as well.
The main purpose of the library is to give users the ability to solve systems of linear equations (useful for Multiple Linear Regression with K number of independent variables for example), but it can also be used to simulate 2D arrays for any purpose.
So how do I use this thing?
Personally, what I do with my private Pine Script libraries is I keep them stored as text-files in a Libraries folder, and I copy and paste them into my code when I need them. This library is quite large, so I have made sure to use brackets in comments to easily hide any part of the code. This helps with big libraries like this one.
The parts of this script that you need to copy are labeled "MathLib", "ArrayLib", and "MatrixLib". The matrix library is dependent on the functions from these other two libraries, but they are stripped down to only include the functions used by the MatrixLib library.
When you have the code in your script (pasted somewhere below the "study()" call), you can create a matrix by calling one of the constructor functions. All functions in this library start with "matrix_", and all constructors start with either "create" or "copy". I suggest you read through the code though. The functions have very descriptive names, and a short description of what each function does is included in a header comment directly above it. The functions generally come in the following order:
Constructors: These are used to create matrices (empy with no rows or columns, set shape filled with 0s, from a time series or an array, and so on).
Getters and setters: These are used to get data from a matrix (like the value of an element or a full row or column).
Matrix manipulations: These functions manipulate the matrix in some way (for example, functions to append columns or rows to a matrix).
Matrix operations: These are the matrix operations. They include things like basic math operations for two indices, to transposing a matrix.
Decompositions and solvers: Next up are functions to solve systems of linear equations. These include LU and QR decomposition and solvers, and functions for calculating the pseudo-inverse or inverse of a matrix.
Multiple Linear Regression: Lastly, we find an implementation of a multiple linear regression, including all the standard statistics one can expect to find in most statistical software packages.
Are there any working examples of how to use the library?
Yes, at the very end of the script, there is an example that plots the predictions from a multiple linear regression with two independent (explanatory) X variables, regressing the chart data (the Y variable) on these X variables. You can look at this code to see a real-world example of how to use the code in this library.
Are there any limitations?
There are no hard limiations, but the matrices uses arrays, so the number of elements can never exceed the number of elements supported by Pine Script (minus 2, since two elements are used internally by the library to store row and column count). Some of the operations do use a lot of resources though, and as a result, some things can not be done without timing out. This can vary from time to time as well, as this is primarily dependent on the available resources from the Pine Script servers. For instance, the multiple linear regression cannot be used with a lookback window above 10 or 12 most of the time, if the statistics are reported. If no statistics are reported (and therefore not calculated), the lookback window can usually be extended to around 60-80 bars before the servers time out the execution.
Hopefully the dev-team at TradingView sees this script and find ways to implement this functionality diretly into Pine Script, as that would speed up many of the operations and make things like MLR (multiple linear regression) possible on a bigger lookback window.
Some parting words
This library has taken a few months to write, and I have taken all the steps I can think of to test it for bugs. Some may have slipped through anyway, so please let me know if you find any, and I'll try my best to fix them when I have time to do so. This library is intended to help the community. Therefore, I am releasing the library as open source, in the hopes that people may improving on it, or using it in their own work. If you do make something cool with this, or if you find ways to improve the code, please let me know in the comments.

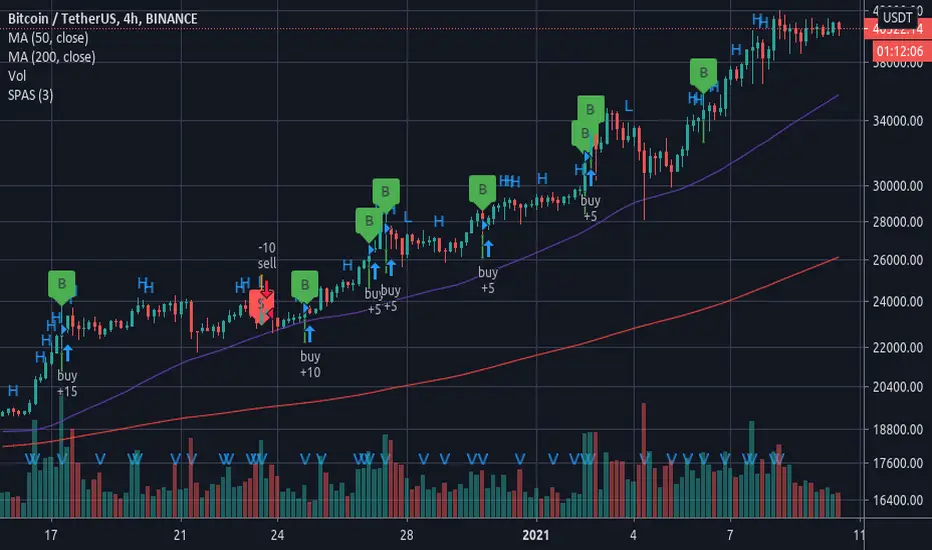
SPAS - Single Price Action StrategyThis strategy is based on a single price action analysis, where volume and price changes will trigger buy and sell orders. This strategy also can be used in combination with alerts to trigger orders in other exchanges or systems.
Best performance is currently achieved using 4H timeframe.
TTC: Triangular Trend ChannelTTC: Triangular Trend Channel is a script to dynamically create a trend channel on the move. It uses open, high, low, close, simple moving average inputs for it's plot lines.
Default color coded in top to bottom price order:
green = top
orange
blue
white = center (9sma)
purple
yellow
red = bottom
The base sma is 9, but all default settings can be changed to suit your needs in the dialogue box. Depending on the time frame chart, you can dial in the accuracy by adjusting the default settings.
Do your own due diligence, your risk is 100% your responsibility. You win some or you learn some. Consider being charitable with some of your profit to help humankind. Small incremental steps work : If you double a penny for a month it = $5,368,709. Good luck and happy trading friends...
*3x lucky 7s of trading*
7pt Trading compass:
Price action, entry/exit
Volume average/direction
Trend, patterns, momentum
Newsworthy current events
Revenue
Earnings
Balance sheet
7 Common mistakes:
+5% portfolio trades, risk management
Beware of analysts motives
Emotions & Opinions
FOMO : bad timing
Lack of planning & discipline
Forgetting restraint
Obdurate repetitive errors, no adaptation
7 Important tools:
Trading View app!, Brokerage UI
Accurate indicators & settings
Wide screen monitor/s
Trading log (pencil & graph paper)
Big organized desk
Reading books, playing chess
Sorted watch-list
Checkout my indicators:
Fibonacci VIP - volume
Fibonacci MA7 - price
pi RSI - trend momentum
TTC - trend channel
www.tradingview.com

VPoC per barThis study prints the current bar VPoC as an horizontal line.
It's aimed originally at BTCUSDT pair and 15m timeframe.
HOW IT WORKS
Zoom In mode: This is the default mode.
The study zooms in into the latest 15 1-minute bar candles in order to calculate the 15 minute candle VPoC.
Zoom Out mode: The VPoC from the last n bars from the current timeframe that match desired timeframe is shown on each bar.
In either case you are recommended to click on the '...' button associated to this study
and select 'Visual Order. Bring to Front.' so that it's properly shown in your chart.
HOW IT WORKS - Zoom In mode
Make sure that '(VP) Zoom into the VP timeframe' setting is set to true.
Choose the zoomed in timeframe where to calculate VPoC from thanks to the '(VP) Zoomed timeframe {1 minute}' setting.
Change '(VP) Zoomed in timeframe bars per current timeframe bar {15}' to its appropiated value. You just need to divide the current timeframe minutes per the zoomed in timeframe minutes per bar. E.g. If you are in 60 minute timeframe and you want to zoom in into 5 minute timeframe: 60 / 5 = 12 . You will write 12 here.
HOW IT WORKS - Zoom Out mode
Make sure that '(VP) Zoom into the VP timeframe' setting is set to false.
If you are using the Zoom out mode you might want to set '(VP) Print VPoC price as discrete lines {True}' to false.
Either choose the zoommed out timeframe where to calculate VPoC from thanks to the '(VP) Zoomed timeframe {1 minute}' setting or turn on the '(VP) Use number of bars (not VP timeframe)' setting in order to use '(VP) Number of bars {100}' as a custom number of bars.
WARNING - Zoom In mode last bar
The way that PineScript handles security function in last bar might result on the last bar not being accurate enough.
SETTINGS
__ SETTINGS - Volume Profile
(VP) Zoomed timeframe {1 minute}: Timeframe in which to zoom in or zoom out to calculate an accurate VPoC for the current timeframe.
(VP) Zoomed in timeframe bars per current timeframe bar {15}: Check 'HOW IT WORKS - Zoom In mode' above. Note : It is only used in 'Zoom in' mode.
(VP) Number of bars {100}: If 'Use number of bars (not VP timeframe)' is turned on this setting is used to calculate session VPoC. Note : It is only used in 'Zoom out' mode.
(VP) Price levels {24}: Price levels for calculating VPoC.
__ SETTINGS - MAIN TURN ON/OFF OPTIONS
(VP) Print VPoC price {True}: Show VPoC price
(VP) Zoom into the VP timeframe: When set to true the VPoC is calculated by zooming into the lower timeframe. When set to false a higher timeframe (or number of bars) is used.
(VP) Realtime Zoom in (Beta): Enable real time zoom for the last bar. It's beta because it would only work with zoomed in timeframe under 60 minutes. And when ratio between zoomout and zoomin is less than 60. Note : It is only used in 'Zoom in' mode.
(VP) Use number of bars (not VP timeframe): Uses 'Number of bars {100}' setting instead of 'Volume Profile timeframe' setting for calculating session VPoC. Note : It is only used in 'Zoom out' mode.
(VP) Print VPoC price as discrete lines {True}: When set to true the VPoC is shown as an small line in the center of each bar. When set to the false the VPoC line is printed as a normal line.
__ SETTINGS - EXTRA
(VP) VPoC color: Change the VPoC color
(VP) VPoC line width {1}: Change VPoC line width (in pixels).
(VP) Use number of bars (not VP timeframe): Uses 'Number of bars {100}' setting instead of 'Volume Profile timeframe' setting for calculating session VPoC. Note : It is only used in 'Zoom out' mode.
(VP) Print VPoC price as discrete lines {True}: When set to true the VPoC is shown as an small line in the center of each bar. When set to the false the VPoC line is printed as a normal line.
CREDITS
I have reused and adapted some code from
"Poor man's volume profile" study
which it's from TradingView IldarAkhmetgaleev user.

Super EMA PrismThis script implements the Binary Trade Logic (BTL) algorithm to calculate two distinct scores that range from 0 to 7. One score is calculated assigning a power of 2 weight to the positive sign of 3 Phi^3 distant Moving Average (MA) slopes. The other score is calculated assigning a power of 2 weight to the sign of the difference between the price and the value of 3 Phi^3 distant Moving Average (MA).
For the first score, hereafter called as the angle score (AS), the largest MA slope positive sign receives weight 4, the middle length MA slope positive sign receives weight 2 and the shortest MA slope positive sign receives weight 1. The positive sign of an MA is defined as 1 if the slope of the MA is positive and 0, otherwise. Therefore, for MAs 305, 72 and 17, if slope(MA305) > 0, slope(MA72) < 0 and slope(MA17) > 0, then score will be 4*1 + 2*0 + 1*1 = 5. Up to my knowledge, this score was first proposed by Bo Williams and named by him as Prisma.
For the second score, hereafter called as the value score (VS), if the price > largest MA, it receives weight 4. If the price > the middle length MA, it receives weight 2 and if the price > the the shortest MA, it receives weight 1. Therefore, for MAs 305, 72 and 17, if price < MA305, price > MA72 and price > MA17, then score will be 4*0 + 2*1 + 1*1 = 3. Up to my knowledge, this score was first proposed by Bo Williams and named by him as Prisma.
Both AS and VS are calculated for Phi^3 lengths (610, 144, 34) and for Phi^3/2 lengths (305, 72, 17). The scores of the same kind calculated for each set of length are combined multiplying the Phi^3 length score by 10 and adding with with the Phi^3/2 score, therefore providing a 2 digit score ranging from 0 to 77. For instance, if we have AS(610, 144, 34) = 7 and AS(305, 72, 17) = 5, we have AS=75. At the same time, if we have VS(610, 144, 34) = 6 and VS(305, 72, 17) = 4, we have VS=64.
VS score is plotted by default in black, but it can be on white for dark themes. AS is plotted with the color of the longest MA used.
Chart background is colored according to the range of values for AS and VS, checked in the following order:
if AS >= 13 and VS <= 13 then back color = red
if AS >= 13 or VS <= 13 then back color = orange
if AS >= 64 and VS >= 64 then back color = green
if AS >= 64 or VS >= 64 then back color = blue
otherwise back color = none (white o black)

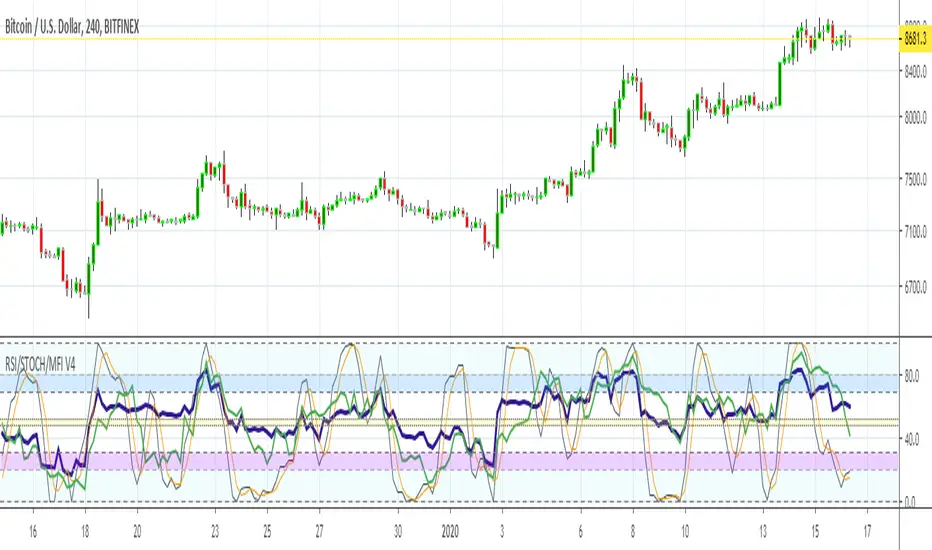
MFI RSI w STOCH OVERLAY V3Combines: Relative Strength (purple) and RSI Stoch (Orange/gray), Money Flow (green) all in one indicator window.
On screen indicator text identifier will read in this order: "RSI/STOCH/MFI V3"
// Changes from original version \\
It was important to bring forth the RSI indicator as the most visually important line and its relationship to the background.
A: Major visual changes from my first published one..as default now
1: Increased RSI line to size 3
2: Increased MFI line to size 2
3: Separated all Bar Line Fields in the background for custom editing, total of 5 now. Much easier to distinguish when the RSI enters these fields.
B: Other major changes as default now
1: Sped up the indicators from 14 to 11, for quicker response. (user can adjust back to 14 or another number)
2: Increased user friendly inputs to adjust colors, lines, data, etc.
3: (darken / lighten and change background colors, increase/decrease line strengths and colors, adjust field data inputs)
Enjoy and Good Luck Trading.
BEST Trailing Take Profit StrategyHello traders
Hope you enjoyed your weekend on my behalf. Was staying home working ... ^^
This is my first strategy educational post I'm doing ever
While I'm generally against posting strategies because it's very easy to fake performance numbers... I cannot prevent myself from sharing a few cool strategy snippets anyway.
So from now on, I'll be sharing a few strategies also - generally not to showcase performance but only to show what pinescript can do.
As once again strategy performance can be faked is so many ways... :)
What's on the menu?
We all know what a trailing-stop is. right? right? Ok... sharing the definition here :)
A trailing stop is designed to protect gains by enabling a trade to remain open and continue to profit as long as the price is moving in the investor's favor. The order closes the trade if the price changes direction by a specified percentage or dollar amount.
But...do you know what a trailing profit is?
Short definition : Well the same but with your profit limit order.
Long definition : A trailing profit is designed to increase your gains by enabling a trade to remain open and continue to profit as long as the price is moving in the investor's favor. The order closes the trade if the price hits the trailing profit level specified percentage or dollar amount.
Some trading strategies used both a trailing stop AND trailing profit. Not making any recommendation here - only sharing what's possible in the realm of trading and pinescripting
Trigger me I'm famous
I developed many trading strategies in my career and often I've been asked to trigger a trailing-stop or trailing-profit once a certain % move has been made.
I integrated here a Take Profit trigger - once hit, it will activate the trailing profit
On the screenshot below, the TP trigger is plotted in orange. Once the price goes past that level for the first time, I'll start trailing the profit level.
In other words, when we see a price makes an interesting move in percentage value - we decide to offset the profit as we concluded that once it reached such distance - then it leads often to more profit
Of course, using only a trailing profit without stop/trailing-stop/invalidation isn't smart and the surest way to kiss goodbye a trading capital and trading and your good mood
See you tomorrow for another strategy snippet
All the BEST
Dave

Bitcoin Price User Correlation [aamonkey]You can only use this for BTC.
Bitcoin over time tends to be priced at 7000 times the number of users (in terms of market cap).
Calculation:
Number of Wallets*7000/(Circulating Supply or 21,000,000)
Settings:
You can decide whether you want to use the Circulating Supply or 21,000,000 as a reference.
The default settings are using 21,000,000 because it seems to be more accurate.
You can easily switch between both versions by checking the box in the settings.
Interesting Findings:
Using circulating supply:
- Most of the time we are under the estimated ("PUC") line
- Once we break above the PUC line we are in the parabolic phase of the Bullrun
- In history, we broke only 4 times above the PUC
- Once we are above the PUC we see crazy growth (parabolic phase)
- We don't spend much time above the PUC
- From breaking the PUC to the new All-Time High of the cycle we took in order: 3 Days, 7 Days, 22 Days, 30 Days
- So the trend is increasing (We are taking more and more time until we see the ATH)
- Currently, we are about to break the PUC
- Then I expect the parabolic phase to begin
- I expect the run to last about 30 days

Oko's Trend MA'sFirstly, thanks to Dejabrew for his great video on finding trend viua MA's, it is his YT video which taught me which ma's to use for this, checkhim out: Dejabrewtrading on YT
200ma, 72ma, 12ma
Best with 1d and 4h
for a 100% confirmed bullish uptrend look for:-
a) price above all 3 ma's
b) from bottom to top in the order: 200, 72,12

Noro's SuperTrend Strategy v2.0 LimitThis strategy same as "Noro's SuperTrend Strategy v1.0". But it is used limit orders. The price for the limit orders is the price of closing of the previous bar. The color filter of a candle is used.

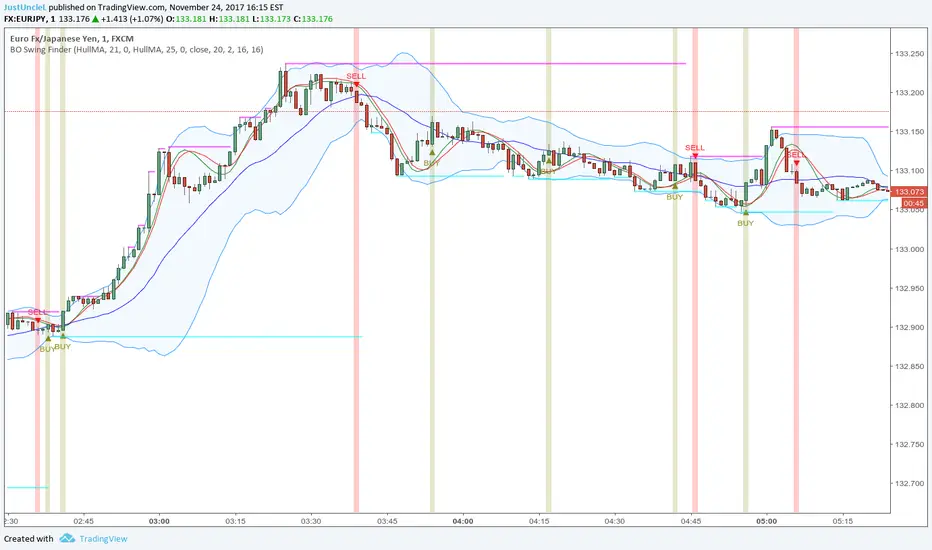
BO Swing Finder R0.6 by JustUncleLThis indicator alert study attempts to detect confirmed Swing points. It uses Bollinger Band centre line crosses as the main signal. The main detection occurs by looking for the first BB centre line cross that was initiated from outside the Bollinger Channel (alternatively KC channel can be used).
The optional HullMA (any any other MA pair) are used to confirm the swing direction. The indicator also plots the two KitKat Support and Resistance lines with optional High/Low labelling on KitKat1 lines.
This indicator tool is suitable for any time frame and can be traded with Binary Option (even 1min) orders (2-3 candle expiry) or as Forex trade orders. It is suitable for Currencies, Cryptocurrencies and Metals. May also be useful on other markets as well.
The MA filtering options, each MA line can be a different type, with an optional offset:
SMA = Simple Moving Average.
EMA = Exponential Moving Average.
WMA = Weighted Moving Average
VWMA = Volume Weighted Moving Average
SMMA = Smoothed Simple Moving Average.
DEMA = Double Exponential Moving Average
TEMA = Triple Exponential Moving Average.
HullMA = Hull Moving Average, fast moving MA.
SSMA = Ehlers Super Smoother Moving average, similar results to HullMA.
ZEMA = Near Zero Lag Exponential Moving Average.
TMA = Triangular (smoothed) Simple Moving Average.
NOTE: The signal calculations do occur on the current candle, so the state of the signal may re-build until the current candle is closed. I have designed the script to behave this way on purpose. This gives traders the option of
preparing their trade early or even taking the trade early if they want. Otherwise the trader can be more conservative and wait for signal candle to close, to give them a confirmed signal. (This is NOT re-painting as the historical signal states are fixed and will not change, unless you change some setup options.)
Hints:
1) As with all indicator and alerting tools, not all signals will yield a tradable successful swing. You need to apply you own analysis on each signal to determine the probability of success.
2) When using the MA to filter the signals you should use it for two types of filtering:
Supportive that confirm swing like fast moving MAs with fairly short lengths, eg HullMA(21,25).
Long Term Direction with smoother longer length MAs like SMMA(180,220) to show up swings back into direction of the longer term trends.
Inspiration: @Lyiness
References:
Momentum VMA KITKAT CROSS v2.1 by vdubus (- Vdubus_Channel www.vdubus.co.uk)
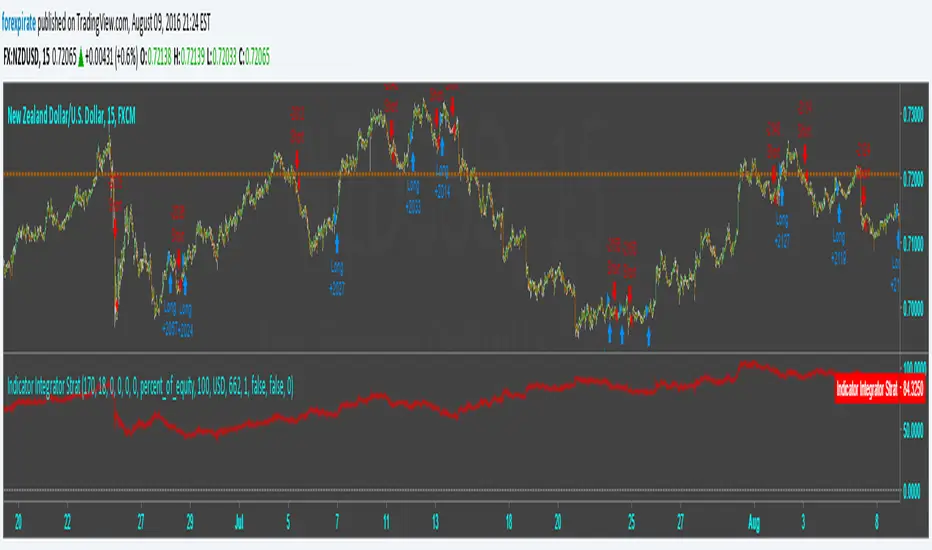
Indicator Integrator Strat <<<<<< Updated again, second2nd patch
Found an error in the orders. Script was making double orders at times. I fixed it. It is tuned as such:
NZDUSD
15 min chart
starting $USD to show 1000 contracts for minicontract with FXCM (start date 3-18 $633 ** see note)
Indicator plots Starting equity-trade gain and loses-number of trades time spread = net money
** with 1:50 leverage it requires $16 for one 1,000 contract.
$84 net vs $16 initial balance is 456% in 109 days.
* If you find errors please comment.