Oscillators Matrix[TheJackRabbit]Oscillators Matrix
The "Oscillators Matrix" is a powerful and intuitive indicator designed to display key oscillator values in a table format on your TradingView chart. This script provides a quick overview of three popular oscillators: RSI (Relative Strength Index), MACD (Moving Average Convergence Divergence), and Stochastic Oscillator.
Key Features:
1. RSI (Relative Strength Index):
Calculates the RSI using a user-defined period.
Detects Golden Cross (GC) and Death Cross (DC) between the RSI and its SMA (Simple Moving Average).
Highlights recent overbought (above 70) and oversold (below 30) conditions.
2. MACD (Moving Average Convergence Divergence):
- Calculates the MACD line and Signal line using user-defined short, long, and signal periods.
- Normalizes MACD values to a range of 1-100 for a clearer comparison.
- Detects GC and DC between the MACD line and Signal line.
3. Stochastic Oscillator:
- Computes the %K line using user-defined smoothing lengths.
- Detects GC and DC between %K and %D lines.
4. Visual Table Display:
Presents a clear and concise table showing oscillator values, recent changes, 5-bar moving averages, GC/DC status, and the number of bars since the last GC or DC event.
Dynamic color-coding provides instant visual feedback: green for GC, red for DC, lime for GCed (recent GC), fuchsia for DCed (recent DC), and white with transparency for neutral conditions.
5. Customizable Positioning:
- Choose from four table positions on your chart: Top Left, Top Right, Bottom Left, or Bottom Right. The table automatically adjusts for better visibility based on your selection.
How to Use:
Apply the Indicator: Add the "Oscillators Matrix" to your chart. Currently, this is an invite-only script, so DM me if you want access.
Customize Your Settings: Adjust the input parameters such as RSI length, MACD periods, and Stochastic smoothing lengths to match your trading strategy.
Analyze the Matrix: Utilize the visual matrix to monitor the oscillator conditions and detect potential trading opportunities quickly.
This indicator is designed for traders who want to efficiently monitor multiple oscillators and make informed trading decisions based on oscillator trends and crossovers.
Search in scripts for "oscillator"

Oscillator %bOscillator %b indicator apply Bollinger Bands on Oscillator Line, and calculate %b to define Buy and Sell signal with detail as below
===
1. Oscillator Type and Parameter
1.1 RSI (56) on H1 Timeframe
1.2 Stochastic (56,3,3) on H1 Timeframe
1.3 CCI (56) on H1 Timeframe
1.4 MACD (48,104,9)) on H1 Timeframe
1.5 AO (20,136) on H1 Timeframe
===
2. Signal
2.1 Buy Signal: at least 4 periods of %b moving betwween 0.0 and 0.2
2.2 Sell Signal: at least 4 periods of %b moving betwween 0.8 and 1.0

Oscillator Workbench — Chart [LucF]█ OVERVIEW
This indicator uses an on-chart visual framework to help traders with the interpretation of any oscillator's behavior. The advantage of using this tool is that you do not need to know all the ins and outs of a particular oscillator such as RSI, CCI, Stochastic, etc. Your choice of oscillator and settings in this indicator will change its visuals, which allows you to evaluate different configurations in the context of how the workbench models oscillator behavior. My hope is that by using the workbench, you may come up with an oscillator selection and settings that produce visual cues you find useful in your trading.
The workbench works on any symbol and timeframe. It uses the same presentation engine as my Delta Volume Channels indicator; those already familiar with it will feel right at home here.
█ CONCEPTS
Oscillators
An oscillator is any signal that moves up and down a centerline. The centerline value is often zero or 50. Because the range of oscillator values is different than that of the symbol prices we look at on our charts, it is usually impossible to display an oscillator on the chart, so we typically put oscillators in a separate pane where they live in their own space. Each oscillator has its own profile and properties that dictate its behavior and interpretation. Oscillators can be bounded , meaning their values oscillate between fixed values such as 0 to 100 or +1 to -1, or unbounded when their maximum and minimum values are undefined.
Oscillator weight
How do you display an oscillator's value on a chart showing prices when both values are not on the same scale? The method I use here converts the oscillator's value into a percentage that is used to weigh a reference line. The weight of the oscillator is calculated by maintaining its highest and lowest value above and below its centerline since the beginning of the chart's history. The oscillator's relative position in either of those spaces is then converted to a percentage, yielding a positive or negative value depending on whether the oscillator is above or below its centerline. This method works equally well with bounded and unbounded oscillators.
Oscillator Channel
The oscillator channel is the space between two moving averages: the reference line and a weighted version of that line. The reference line is a moving average of a type, source and length which you select. The weighted line uses the same settings, but it averages the oscillator-weighted price source.
The weight applied to the source of the reference line can also include the relative size of the bar's volume in relation to previous bars. The effect of this is that the oscillator's weight on bars with higher total volume will carry greater weight than those with lesser volume.
The oscillator channel can be in one of four states, each having its corresponding color:
• Bull (teal): The weighted line is above the reference line.
• Strong bull (lime): The bull condition is fulfilled and the bar's close is above the reference line and both the reference and the weighted lines are rising.
• Bear (maroon): The weighted line is below the reference line.
• Strong bear (pink): The bear condition is fulfilled and the bar's close is below the reference line and both the reference and the weighted lines are falling.
Divergences
In the context of this indicator, a divergence is any bar where the slope of the reference line does not match that of the weighted line. No directional bias is assigned to divergences when they occur. You can also choose to define divergences as differences in polarity between the oscillator's slope and the polarity of close-to-close values. This indicator's divergences are designed to identify transition levels. They have no polarity; their bullish/bearish bias is determined by the behavior of price relative to the divergence channel after the divergence channel is built.
Divergence Channel
The divergence channel is the space between two levels (by default, the bar's low and high ) saved when divergences occur. When price has breached a channel and a new divergence occurs, a new channel is created. Until that new channel is breached, bars where additional divergences occur will expand the channel's levels if the bar's price points are outside the channel.
Price breaches of the divergence channel will change its state. Divergence channels can be in one of five different states:
• Bull (teal): Price has breached the channel to the upside.
• Strong bull (lime): The bull condition is fulfilled and the oscillator channel is in the strong bull state.
• Bear (maroon): Price has breached the channel to the downside.
• Strong bear (pink): The bear condition is fulfilled and the oscillator channel is in the strong bear state.
• Neutral (gray): The channel has not been breached.
█ HOW TO USE THE INDICATOR
Load the indicator on an active chart (see here if you don't know how).
The default configuration displays:
• The Divergence channel's levels.
• Bar colors using the state of the oscillator channel.
The default settings use:
• RSI as the oscillator, using the close source and a length of 20 bars.
• An Arnaud-Legoux moving average on the close and a length of 20 bars as the reference line.
• The weighted version of the reference line uses only the oscillator's weight, i.e., without the relative volume's weight.
The weighted line is capped to three standard deviations of the reference.
• The divergence channel's levels are determined using the high and low of the bars where divergences occur.
Breaches of the channel require a bar's low to move above the top of the channel, and the bar's high to move below the channel's bottom.
No markers appear on the chart; if you want to create alerts from this script, you will need first to define the conditions that will trigger the markers, then create the alert, which will trigger on those same conditions.
To learn more about how to use this indicator, you must understand the concepts it uses and the information it displays, which requires reading this description. There are no videos to explain it.
█ FEATURES
The script's inputs are divided in five sections: "Oscillator", "Oscillator channel", "Divergence channel", "Bar Coloring" and "Marker/Alert Conditions".
Oscillator
This is where you configure the oscillator you want to study. Thirty oscillators are available to choose from, but you can also use an oscillator from another indicator that is on your chart, if you want. When you select an external indicator's plot as the oscillator, you must also specify the value of its centerline.
Oscillator Channel
Here, you control the visibility and colors of the reference line, its weighted version, and the oscillator channel between them.
You also specify what type of moving average you want to use as a reference line, its source and its length. This acts as the oscillator channel's baseline. The weighted line is also a moving average of the same type and length as the reference line, except that it will be calculated from the weighted version of the source used in the reference line. By default, the weighted line is capped to three standard deviations of the reference line. You can change that value, and also elect to cap using a multiple of ATR instead. The cap provides a mechanism to control how far the weighted line swings from the reference line. This section is also where you can enable the relative volume component of the weight.
Divergence Channel
This is where you control the appearance of the divergence channel and the key price values used in determining the channel's levels and breaching conditions. These choices have an impact on the behavior of the channel. More generous level prices like the default low and high selection will produce more conservative channels, as will the default choice for breach prices.
In this section, you can also enable a mode where an attempt is made to estimate the channel's bias before price breaches the channel. When it is enabled, successive increases/decreases of the channel's top and bottom levels are counted as new divergences occur. When one count is greater than the other, a bull/bear bias is inferred from it. You can also change the detection mode of divergences, and choose to display a mark above or below bars where divergences occur.
Bar Coloring
You specify here:
• The method used to color chart bars, if you choose to do so.
• If you want to hollow out the bodies of bars where volume has not increased since the last bar.
Marker/Alert Conditions
Here, you specify the conditions that will trigger up or down markers. The trigger conditions can include a combination of state transitions of the oscillator and the divergence channels. The triggering conditions can be filtered using a variety of conditions.
Configuring the marker conditions is necessary before creating an alert from this script, as the alert will use the marker conditions to trigger.
Realtime values will repaint, as is usually the case with oscillators, but markers only appear on bar closes, so they will not repaint. Keep in mind, when looking at markers on historical bars, that they are positioned on the bar when it closes — NOT when it opens.
Raw values
The raw values calculated by this script can be inspected using the Data Window, including the oscillator's value and the weights.
█ INTERPRETATION
Except when mentioned otherwise, this section's charts use the indicator's default settings, with different visual components turned on or off.
The aim of the oscillator channel is to provide a visual representation of an oscillator's general behavior. The simplest characteristic of the channel is its bull/bear state, determined by whether the weighted line is above or below the reference line. One can then distinguish between its bull and strong bull states, as transitions from strong bull to bull states will generally happen when trends are losing steam. While one should not infer a reversal from such transitions, they can be a good place to tighten stops. Only time will tell if a reversal will occur. One or more divergences will often occur before reversals. This shows the oscillator channel, with the reference line and the thicker, weighted line:
The nature of the divergence channel 's design makes it particularly adept at identifying consolidation areas if its settings are kept on the conservative side. The divergence channel will also reveal transition areas. A gray divergence channel should usually be considered a no-trade zone. More adventurous traders can use the oscillator channel to orient their trade entries if they accept the risk of trading in a neutral divergence channel, which by definition will not have been breached by price. This show only the divergence channels:
This chart shows divergence channels and their levels, and colors bars on divergences and on the state of the oscillator channel, which is not visible on the chart:
If your charts are already busy with other stuff you want to hold on to, you could consider using only the chart bar coloring component of this indicator. Here we only color bars using the combined state of the oscillator and divergence channel, and we do not color the bodies of bars where volume has not increased. Note that my chart's settings do not color the candle bodies:
At its simplest, one way to use this indicator would be to look for overlaps of the strong bull/bear colors in both the oscillator channel and a divergence channel, as these identify points where price is breaching the divergence channel when the oscillator's state is consistent with the direction of the breach.
Tip
One way to use the Workbench is to combine it with my Delta Volume Channels indicator. If both indicators use the same MA as a reference line, you can display its delta volume channel instead of the oscillator channel.
This chart shows such a setup. The Workbench displays its divergence levels, the weighted reference line using the default RSI oscillator, and colors bars on divergences. The DV Channels indicator only displays its delta volume channel, which uses the same MA as the workbench for its baseline. This way you can ascertain the volume delta situation in contrast with the visuals of the Workbench:
█ LIMITATIONS
• For some of the oscillators, assumptions are made concerning their different parameters when they are more complex than just a source and length.
See the `oscCalc()` function in this indicator's code for all the details, and ask me in a comment if you can't find the information you need.
• When an oscillator using volume is selected and no volume information is available for the chart's symbol, an error will occur.
• The method I use to convert an oscillator's value into a percentage is fragile in the early history of datasets
because of the nascent expression of the oscillator's range during those early bars.
█ NOTES
Working with this workbench
This indicator is called a workbench for a reason; it is designed for traders interested in exploring its behavior with different oscillators and settings, in the hope they can come up with a setup that suits their trading methodology. I cannot tell you which setup is the best because its setup should be compatible with your trading methodology, which may require faster or slower transitions, thus different configurations of the settings affecting the calculations of the divergence channels.
For Pine Script™ Coders
• This script uses the new overload of the fill() function which now makes it possible to do vertical gradients in Pine. I use it for both channels displayed by this script.
• I use the new arguments for plot() 's `display` parameter to control where the script plots some of its values,
namely those I only want to appear in the script's status line and in the Data Window.
• I used my ta library for some of the oscillator calculations and helper functions.
• I also used TradingView's ta library for other oscillator calculations.
• I wrote my script using the revised recommendations in the Style Guide from the Pine v5 User Manual.

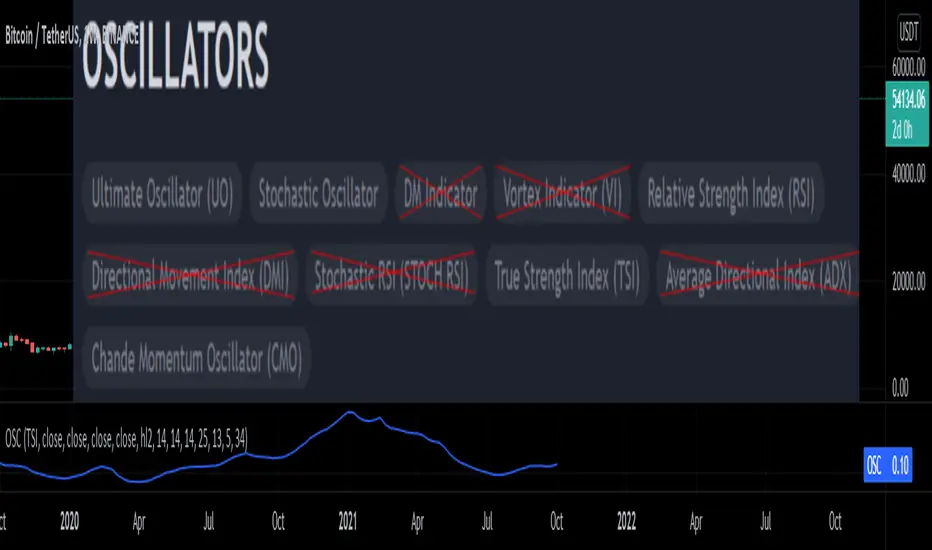
Oscillators SwitchSwitch for common oscillator. Uses built-in function from Pine Script v5 such as Chande Momentum Oscillator (CMO), Relative Strength Index (RSI), Stochastic (STO), True Strength Index (TSI) and Ultimate Oscillator (UO).
Oscillator available as below :
Input displayed individually :
Oscillator2OverlayThis experimental study "normalizes" a series into a consistent range such that it can be "overlayed" against an oscillator that's typically plotted independently.
It then "denormalizes" the oscillator's signal into the series' original domain, such that important thresholds can _also_ be denormalized into the series' original domain.
The normalization/denormalization performed using a long-window bollinger band to define a domain for mapping between-chart space and oscillator-space.
This example maps "rsi" into the chart-domain.
(!!) Inspired by

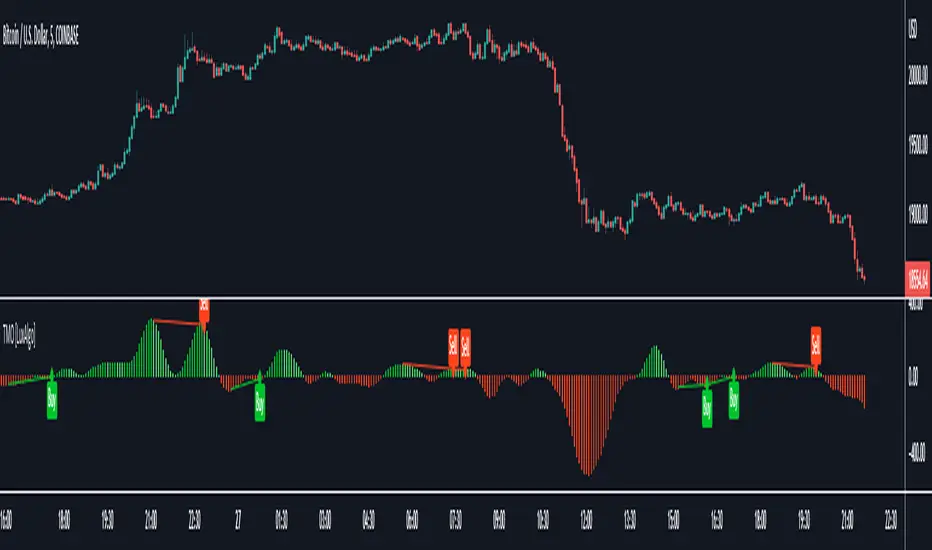
TICK OscillatorOscillator that makes it easy to see when TICK is hitting extreme readings or establishing a bullish/bearish divergence vs the indices.
- Green coloration means a reading of >+400
- Red coloration means a reading of <-400
- Orange means a reading in between -400 and +400
This was inspired by John F Carter's book "Mastering The Trade", where I first learned about utilizing TICK in my trading.

RS4r OscillatorOscillator based on Garofallou's RS4r indicator. It has been modified to compare the Relative Strength of any asset against QQQ . SPY , IWM , VGK , EWJ , DBC , GLD , HYG , LQD , TLT ETFs.
Readings above 80 points suggest great relative strength against these ETFs.

Oscillator Volume Profile [Trendoscope®]The Oscillator Volume Profile indicator is designed to construct a volume profile based on predefined oscillator levels. It integrates volume data with oscillator readings to offer a unique perspective on market dynamics.
🎲 Selectable Oscillators:
Users can select from an array of oscillator options for the basis of the volume profile, including:
Relative Strength Index (RSI)
Chande Momentum Oscillator (CMO)
Center of Gravity (COG)
Money Flow Index (MFI)
Rate of Change (ROC)
Commodity Channel Index (CCI)
Stochastic Oscillator (Stoch)
True Strength Index (TSI)
Williams %R (WPR)
The length parameters - Length, Fast Length, Slow Length allows users to define the period over which the chosen oscillator is calculated, tailoring the sensitivity of the indicator to their trading strategy.
🎲 Dynamic Overbought/Oversold Ranges:
This indicator enhances traditional concepts by introducing dynamic overbought and oversold levels. These adaptable thresholds are calculated using various methods, including:
🎯 Highest/Lowest Range Method : This method establishes the range based on the highest and lowest values of the oscillator within the last N bars.
🎯 Moving Average Range Method : The range is derived from a moving average of the oscillator, providing a smoothed threshold that reflects more recent market conditions.
In addition to these methods, the indicator incorporates a unique 'Sticky Border' feature:
🎯 Sticky Border: With this option enabled, the dynamic ranges maintain their levels until the oscillator breaks out of the range. Once a breakout occurs, the levels are recalculated and updated. This mechanism ensures that the borders remain consistent and relevant, only adjusting to significant market movements that warrant a recalculation.
Users can select their preferred method for determining dynamic ranges, allowing for a customized approach that aligns with their analysis and trading strategy. The sticky border feature further refines this functionality, offering continuity until a decisive market move occurs.
🎲 Volume Profile Calculation Parameters:
🎯 Trend Filter: The indicator provides a versatile trend filter with four selectable options:
Uptrend: The volume profile is calculated when the oscillator indicates an uptrend.
Downtrend: The volume profile is calculated when the oscillator indicates a downtrend.
Any: The volume profile is calculated regardless of the trend.
External: Users can input values from an external indicator. The volume profile is then calculated only when the external indicator's value is non-zero, integrating external analysis into the volume profile construction.
🎯 Precision: Users have the option to define the precision for calculating the volume profile, which is crucial due to the varying scales of different oscillators (e.g., some oscillators range from 0 to 100, while others from -1 to 1). Selecting an appropriate precision ensures that the volume profile is accurately aligned with the minimal price range significant to the chosen oscillator. This setting requires user intervention for optimal configuration, as automatic calculation is not feasible due to the diverse nature of oscillator ranges.
🎯 Number of Bars: Users can select a specific number of bars for volume profile calculation, or opt to include all available historical bars for a comprehensive profile.
🎲 Selecting the right precision:
Users must select the right precision based on their choice of indicator. For example, RSI values range from 0-100. Hence, the default precision of 1 work fine on RSI as the volume profiles are plotted from 0 to 100 at the interval of 0.1
But, the default precision of 1 will not be ok on TSI because TSI values range from -1 to 1. Hence, using 1 as precision will result in very less volume profile lines as shown below.
Due to this, it is necessary to increase the precision for oscillators such as TSI where the range between highest and lowest value is far less. Once we set the precision to 2, we can see more appropriate volume profile division.
🎲 Note of thanks:
This publication uses polyline feature for drawing volume profiles. The advantage of using polyline is that we can overcome max 500 lines issue that we face by using the regular line objects. More details of polyline can be found in the tradingview blog post
Further, using polyline for display of volume profiles is inspired by the publications of fikira and KioseffTrading

Oscillator Matrix [Alpha Extract]A comprehensive multi-oscillator system that combines volume-weighted money flow analysis with enhanced momentum detection, providing traders with a unified framework for identifying high-probability market opportunities across all timeframes. By integrating two powerful oscillators with advanced confluence analysis, this indicator delivers precise entry and exit signals while filtering out market noise through sophisticated threshold-based regime detection.
🔶 Volume-Weighted Money Flow Analysis
Utilizes an advanced money flow calculation that tracks volume-weighted price movements to identify institutional activity and smart money flow. This approach provides superior signal quality by emphasizing high-volume price movements while filtering out low-volume market noise.
// Volume-weighted flows
up_volume = price_up ? volume : 0
down_volume = price_down ? volume : 0
// Money Flow calculation
up_vol_sum = ta.sma(up_volume, mf_length)
down_vol_sum = ta.sma(down_volume, mf_length)
total_volume = up_vol_sum + down_vol_sum
money_flow_ratio = total_volume > 0 ? (up_vol_sum - down_vol_sum) / total_volume : 0
🔶 Enhanced Hyper Wave Oscillator
Features a sophisticated MACD-based momentum oscillator with advanced normalization techniques that adapt to different price ranges and market volatility. The system uses percentage-based calculations to ensure consistent performance across various instruments and timeframes.
// Enhanced MACD-based oscillator
fast_ma = ta.ema(src, hw_fast)
slow_ma = ta.ema(src, hw_slow)
macd_line = fast_ma - slow_ma
signal_line = ta.ema(macd_line, hw_signal)
// Proper normalization using percentage of price
price_base = ta.sma(close, 50)
macd_normalized = macd_line / price_base
hyper_wave = macd_range > 0 ? macd_normalized / macd_range : 0
🔶 Multi-Factor Confluence System
Implements an intelligent confluence scoring mechanism that combines signals from both oscillators to identify high-probability trading opportunities. The system assigns strength scores based on multiple confirmation factors, significantly reducing false signals.
🔶 Fixed Threshold Levels
Uses predefined threshold levels optimized for standard oscillator ranges to distinguish between normal market fluctuations and significant momentum shifts. The dual-threshold system provides clear visual cues for overbought/oversold conditions while maintaining consistent signal criteria across different market conditions.
🔶 Overflow Detection Technology
Advanced overflow indicators identify extreme market conditions that often precede major reversals or continuation patterns. These signals highlight moments when market momentum reaches critical levels, providing early warning for potential turning points.
🔶 Dual Oscillator Integration
The indicator simultaneously tracks volume-weighted money flow and momentum-based price action through two independent oscillators. This dual approach ensures comprehensive market analysis by capturing both institutional activity and technical momentum patterns.
// Multi-factor confluence scoring
confluence_bull = (mf_bullish ? 1 : 0) + (hw_bullish ? 1 : 0) +
(mf_overflow_bull ? 1 : 0) + (hw_overflow_bull ? 1 : 0)
confluence_bear = (mf_bearish ? 1 : 0) + (hw_bearish ? 1 : 0) +
(mf_overflow_bear ? 1 : 0) + (hw_overflow_bear ? 1 : 0)
confluence_strength = confluence_bull > confluence_bear ? confluence_bull / 4 : -confluence_bear / 4
🔶 Intelligent Signal Generation
The system generates two tiers of reversal signals: strong signals that require multiple confirmations across both oscillators, and weak signals that identify early momentum shifts. This hierarchical approach allows traders to adjust position sizing based on signal strength.
🔶 Visual Confluence Zones
Background coloring dynamically adjusts based on confluence strength, creating visual zones that immediately communicate market sentiment. The intensity of background shading corresponds to the strength of the confluent signals, making pattern recognition effortless.
🔶 Threshold Visualization
Color-coded threshold zones provide instant visual feedback about oscillator positions relative to key levels. The fill areas between thresholds create clear overbought and oversold regions with graduated color intensity.
🔶 Candle Color Integration
Optional candle coloring applies confluence-based color logic directly to price bars, creating a unified visual framework that helps traders correlate indicator signals with actual price movements for enhanced decision-making.
🔶 Overflow Alert System
Specialized circular markers highlight extreme overflow conditions on both oscillators, drawing attention to potential climax moves that often precede significant reversals or accelerated trend continuation.
🔶 Customizable Display Options
Comprehensive display controls allow traders to toggle individual components on or off, enabling focused analysis on specific aspects of the indicator. This modularity ensures the indicator adapts to different trading styles and analytical preferences.
1 Week
1 Day
15 Min
This indicator provides a complete analytical framework by combining volume analysis with momentum detection in a single, coherent system. By offering multiple confirmation layers and clear visual hierarchies, it empowers traders to identify high-probability opportunities while maintaining precise risk management across all market conditions and timeframes. The sophisticated confluence system ensures that signals are both timely and reliable, making it an essential tool for serious technical analysts.

Triangular Momentum Oscillator & Real Time Divergences [LuxAlgo]Oscillators are widely used in technical analysis and can return a large amount of information to the trader depending on their design. It is common to use oscillators to detect divergences with the price, divergences occur when the tops/bottoms made by the oscillator and price are negatively correlated.
The following oscillator is based on the momentum of a triangular moving average, hence the name "triangular momentum" because of the very smooth property of the triangular moving average, we aimed at a real-time detection of divergences instead of using more common methods such as relying on pivot high/low detection which are suitable for more noisy oscillators.
The oscillator can also be colored based on a gradient derived from the correlation between its output and the price which can be useful to detect when the oscillator is out of phase (significantly lagging or leading the price).
Settings
length : Period of the oscillator, higher values return a smoother output.
src : Input source of the indicator.
Show Lines : Show lines connecting the current top/bottom with the previous one made by the oscillator when a divergence is detected. True by default.
Color Based On Price/Oscillator Correlation : Allows the color of the oscillator to change based on its correlation with the price, with red colors suggesting a negative correlation.
Usages
The advantage of having a smoother oscillator for divergences detection is that it can be done in real-time since a top or bottom is present when the oscillator first difference cross 0. Smoother oscillators are also easier to interpret, however, they will still suffer from lag.
The divergences detected by the oscillator are regular divergences, where the oscillator leads price variations.
Using higher values of length allows the oscillator to filter out longer-term variations thus being smoother as a result.
By using the color mode based on the price/oscillator correlation we can see where the oscillator leads or lag the price, and since divergences are based on the price and oscillator going in the opposite direction we can have information where price might reverse.
It is also possible to interpret the oscillator without relying on the divergence detection, with a decreasing value of the oscillator indicating a downtrend and an increasing value indicating an uptrend.
Oscillator pack [Tcs] | OSCThese oscillators are a reinterpretation of some of the most famous indicators for traders, with the scope to provide higher accuracy and better readability.
The improvements are based on both calculation and visual impact, with calculations incorporating not only price but also tick volume to enhance signal accuracy.
All oscillators can be applied to different timeframes than the chart being analyzed.
This indicator includes three different oscillators: TCS Stochastic, TCS MACD, and TCS Momentum.
• TCS STOCHASTIC
The TCS STOCHASTIC removes the noise from the standard RSI Stochastic and significantly reduces the number of anticipated signals (line crosses) that the RSI Stochastic provides. Similarly, the divergences are less frequent but more accurate.
The indicator plots overbought conditions (plotted as green waves) and oversold conditions (plotted as purple waves) in a clear way.
The Stochastic channel marks the power of buyers or sellers with white (bullish) and gray (bearish) shades.
The dots on the Stochastic line indicate when buyers or sellers are in control. This helps both in trend following conditions and reversal points.
The tinier the channel, defined by the Stochastic line and signal line, the stronger the trend is likely to be.
• TCS MACD
The TCS MACD removes noise from the standard MACD and often anticipates good entry points for standard MACD crosses, while delaying bad ones.
Additionally, the indicator's performance for divergences has been improved, as it takes into account both price action and on balance volume.
It has also been developed to provide better performance at the 0 line level, which can be a good entry point when the baseline is crossed.
The histogram helps to identify divergences and the strength of the trend.
• TCS MOMENTUM
The TCS MOMENTUM WAVES indicate the trend direction based on the strength of momentum and moments of accumulation/distribution, which are highlighted with a red background.
Bullish trends are represented with white waves, while bearish trends are shown in gray.
Crosses symbol on the 0 line indicate a possible trend reversal, with green for bullish and purple for bearish.
The best entry point for a reversal is when the momentum line changes to the trend direction color after a reversal point is detected.
The momentum line and its signal line can also be used to identify entry points for a strategy, as well as the crosses of the waves.
Please note that this indicator is for educational purposes only and should not be used for trading without further testing and analysis.

Oscillator Divergence HistogramIdentify Divergences on 6 oscillators simultaneously.
From the bottom up.
0 to 1 (black): MACD
1 to 2 (green): Elders Force Index
2 to 3 (blue): RSI
3 to 4 (purple): Awesome Oscillator
4 to 5 (red): Commodity channel index
5 to 6 (orange): Stochastic
You can change the identification of the divergence in the settings and use the Oscillator Divergences indicator to visually see them when testing.
This detects the following divergences between price and the oscillator.
Regular Bullish Divergence: Price lower low | Oscillator higher low
Regular Bearish Divergence: Price higher high | Oscillator lower high
Hidden Bullish Divergence: Price higher low | Oscillator lower low
Hidden Bearish Divergence: Price lower high | Oscillator higher high
Early warning alert system. This identifies a developing divergence and can be used to set alerts.
Colors
Bearish: Maroon
Bullish: Green
Hidden Bearish: Light brown
Hidden Bullish: Light green
Developing early warning are lighter shades of the above.

Oscillator & SentimentThis script is a custom TradingView indicator that calculates an oscillator and sentiment line based on various input parameters. The oscillator is based on a modified version of My Oscillator, which is a measure of price deviation from its exponential moving average ( EMA ). The sentiment line is a smoothed average of the oscillator values. The script also uses a unique color-coding system to represent the trends in the oscillator and sentiment line, making it visually appealing and easier for traders to identify market movements.
Parameters:
Fast Length: fast EMA length.
Slow Length: slow EMA length.
SMA Length: simple moving average length .
Sentiment Length: The length for calculating the sentiment line.
LengthInputRoR: A constant value used for the highest and lowest calculations.
Calculations:
Highest and Lowest: The highest and lowest values of the Simple Moving Average of high and low prices over the LengthInputRoR period.
Price Calculation (HLC2): The average of the high, low, and close prices divided by ...
My Oscillator ( SMO ): A measure of price deviation from the EMA5. It is calculated with HLC2 , EMA5, STDDEVS
Sentiment: A Simple Moving Average of My Oscillator over the sentiment_length period.
Colors:
Sentiment Color: Changes based on the current sentiment value relative to the previous value. It can have three different color variations to represent increasing, decreasing, or steady sentiment.
Candle Color: Adjusts according to the close price relative to the highest and lowest values. It helps traders to quickly identify if the price is in a strong or weak position.
Key Features:
Unique Oscillator and Sentiment Combination:
The script integrates My Oscillator and a sentiment line calculation, providing a comprehensive view of the market. The oscillator is a deviation-based indicator that is responsive to market trends, while the sentiment line offers a smoothed representation of the oscillator values.
Intuitive Color-Coding System:
Bullish state Confirmed: The oscillator is green and the sentiment is above 0 and below the oscillator.
Bearish state Confirmed: The oscillator is red and the sentiment line is below 0 and above the oscillator.
Neutral state: The oscillator is yellow above or below 0, normally a risk off area and wait for direction confirmation, doesn't mean that there can't be a Long or Short possibility.
Neutral state often also gives Long or Short Setup's when the oscillator is 1 for Long and -1 for Short, but in the Neutral state there will be more chance of moves up or down.
The Script will also color the candles in the main-chart the same as the oscillator colors
Enhanced Market Analysis:
The combination of the oscillator, sentiment line, and color-coding system provides traders with valuable insights into the market's direction, strength, and momentum, ultimately helping them make more informed trading decisions.
** This script is a great to use together with my other script: "Long & Short / Bullish & Bearish & Neutral / Sentiment" ( it will color the bars so if you use them together turn off barcolor in this one if you like that system: "Long & Short / Bullish & Bearish & Neutral / Sentiment")
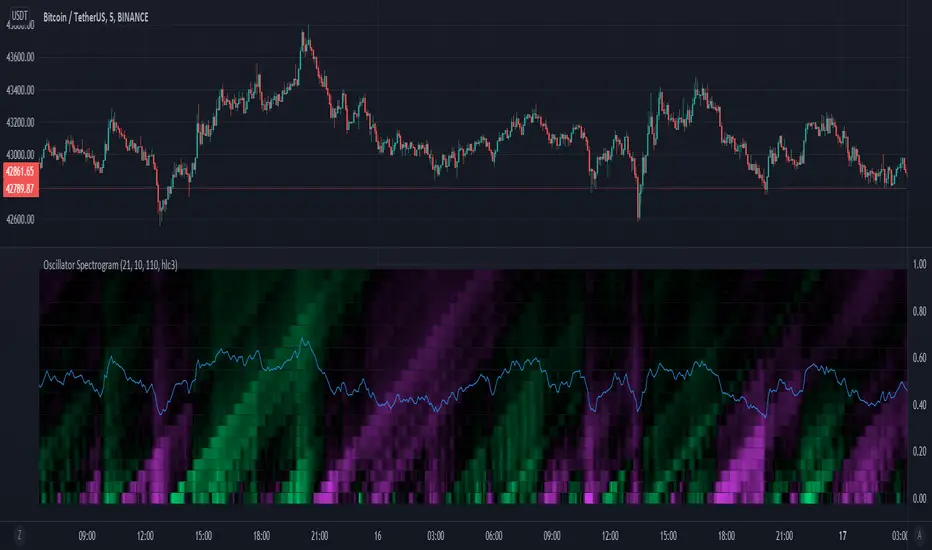
Oscillator SpectrogramA spectrogram of simple oscillators over varying periods.
Oscillator periods increase from bottom to top.
Color indicates the value of the oscillator, with fuchsia indicating a negative value, black indicating a value around 0, and lime green indicating a value greater than 0.
The oscillators are simply the percentage of positive movement within a lookback period, with 50 percent centered at 0.
Vertical lines along the spectrogram indicate that multiple oscillators of different periods are changing values, indicating a shift in market character.
LuxAlgo® - Oscillator Matrix™Oscillator Matrix™ is an all-in-one indicator that incorporates 6+ unique components designed for interoperability & confluence with one another to provide a powerful trend following & reversal detection experience.
Users can create various ways to utilize the indicator's features together such as looking for excess money flowing into the market alongside strong reversal signals appearing or getting real-time divergence signals alongside a lack of money flowing into the market to predict upcoming trends.
This indicator is described as an 'Oscillator Matrix' as it's made up of many different components that can create a systematic approach to analyzing markets alone, however, the indicator also can serve as a great secondary piece to a user's primary analysis with or without our other LuxAlgo Premium indicators.
🔶 FEATURES
Below we describe each component of Oscillator Matrix™ in order of each's significance for the most confluent analysis possible.
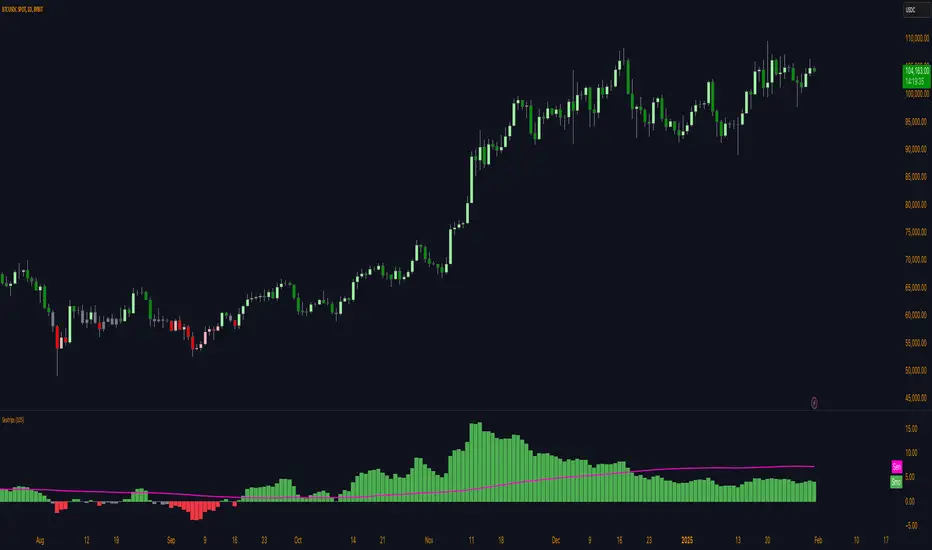
Money Flow - Easily see the amount of buying or selling liquidity entering the market by analyzing the green & red waves and how they react with their thresholds to achieve further insight. Best to analyze first before considering any signals the indicator can generate.
Thresholds - Dynamic levels that align above/below the Money Flow to show at which level significant buying or selling is actually taking place.
Overflow - Small lighter waves that occur within the Money Flow's display when excess buying or selling activity is occurring to accurately predict upcoming reversals.
Hyper Wave - An oscillator ribbon in green/grey that provides highly reactive trend following signals & powerful divergence detection.
Real-Time Divergences - Real-time divergence labels that appear on the Hyper Wave oscillator's adaptive ribbon. A highly effective approach to a concept that's not typically done for oscillators. Users can also increase the sensitivity of divergences within the settings.
Reversal Signals - Small dots on the upper or lower boundaries represent high frequency points that indicate possible reversals or a warning signal to upcoming larger reversal signals which are indicated separately by the large triangular arrows on the top & bottom of the indicator's panel.
Confluence Zones - Allows the Money Flow & Hyper Wave oscillator to be used together to display easily interpretable shades of bullish & bearish activity. Brighter, more vibrant colors indicate strong bullish or bearish confluence between these 2 features.
Confluence Meter - An optional display at the current bar to easily find the current level of confluence between all features within Oscillator Matrix™ indicated by the arrow pointing to bullish or bearish levels. (Disabled by default)
Generally, we recommend using these features in order from first to last, whereas analyzing components of the Smart Money Flow category prior to considering other features in your analysis is most productive to ensure you find proper confluence alongside any signal that is generated.
🔶 USAGE
In the image below, we can see 5 points of interest to a user analyzing Oscillator Matrix™ based on various different behaviors.
Point 1 : Here we can see a large reversal signal arrow at the bottom of the panel. These signals, like all signals in LuxAlgo Premium & any indicator in general are not meant to be used as buy/sell signals themselves.
What makes this signal particularly more of interest opposed to other reversal signals that may not play out right away is the Money Flow that corresponding as weak. We can tell the Money Flow is weak because it is not near the red threshold level.
This indicates to us that there is not real selling pressure occurring and that the market could easily reverse in these conditions.
Point 2 : In this specific area we can notice the Money Flow in green is moving upwards alongside the green threshold level. This combination indicates a high probability there is a lot of real buying volume coming into the market, opposed to the previous example (point 1) where the Money Flow was not near the threshold level.
We can also notice the Hyper Wave Oscillator is printing a green dot while above the 50 value on Oscillator Matrix™ panel, further indicating a likely bullish impulse to come.
Point 3 : There are multiple indications here showing us the market may potentially be reversing. The most notable being the larger red reversal arrow, however, as we mentioned previously these cannot be used by themselves.
A further indication is that on the Money Flow we can see Overflow has occurred by the lighter small wave that has appeared & is now turning downwards. This indicates that an excess of buyers have come into the market & are likely to be washed out with a move to the downside.
We can see this happen once again about 8 candles later paired with a high frequency reversal signal (red dot) which marked a local high before the larger impulse down.
Point 4 : You can notice during the recent 25 or so candles the high frequency reversal points (green & red dots) have been highly effective for indicating potential local highs & lows in real-time.
There was a previous real-time bullish divergence detected while Money Flow was strongly in the red and this did indicate a small move upwards, however, with the Money Flow still holding in the red, another high frequency reversal dot, and then as the Money Flow begins to decrease further, we see a clean local top detected here at point 4.
Point 5 : As the lower Confluence Zone moved into the bright red, we saw a large move to the downside and a large bullish reversal signal printed in real-time as well.
Just like point 1, we have a very clear indication the selling has stopped as we further analyze the Money Flow is nowhere near it's true Activity Line.
This analysis combined gave us a further indication of a larger reversal which played out with no lag at all as all reversal signals are fully predictive separate from the Hyper Wave oscillator itself, which can be used as a further trend following approach alongside signals & money flow.
🔶 NAVIGATING MARKET CONDITIONS
In the image above we can see another example with 6 new points of interest marked in green & red shaded areas, all accompanied by a list of possible interpretations of the indicator.
The importance of this usage example is to demonstrate the ability to focus on certain components of the indicator during specific market conditions. For any indicator attempting to catch reversals, trending market conditions will be a detriment to its usability.
The same amount of the components within Oscillator Matrix™ will support trending market conditions as there are components to support ranging market conditions. The indicator further aims to provide clear abilities to detect when the market is likely trending or ranging.
With an understanding of the components within the Smart Money Flow section particularly such as the Overflow & Thresholds, it's possible to develop a more significant understanding of when to consider the market is trending vs when to consider the market may be ranging.
By doing this, we can potentially determine at certain points when to 'filter out' reversal signals or to just consider them merely indications of local tops/bottoms opposed to significant tops/bottoms.
Analyzing a significant Overflow particularly is useful to consider a trend potentially coming to an end. For example, at point 5 in the image above we had a clear downtrend only until there was a very considerable amount of Overflow that begun a real reversal.
We recommend studying the outlined chart above & the list of indications at each shaded area to develop a deep understanding of how to navigate varying market conditions & spot various points of confluence during reversals.
🔶 CONCLUSION & ACCESS
This indicator is an extremely comprehensive approach to an oscillator that allows users to further develop a systematic approach to trading and can be paired great alongside other forms of technical analysis such as our LuxAlgo Signals & Overlays indicator.
Although we believe this indicator to be useful, it's critical to understand that past performance is not necessarily indicative of future results and there are many more factors that go into being a profitable trader.
You can see the Author's instructions below to get instant access to Oscillator Matrix™ & our LuxAlgo Premium suite.

Oscillator OB/OS BarsChoose between 3 different oscillators (RSI, MFI, and StochRSI) to show bars when the oscillator is oversold/overbought.
Green = oversold
Red = overbought
Orange = Bearish "Reversal"
Aqua = Bullish "Reversal"
I created this to help determine patterns with other stuff I'm building. Thought others may find it useful for the same purpose, not to trade based off of this.
Used those 3 oscillators cause their OB/OS levels are clear enough (though I put no effort into the stochrsi like I should've but welp)
enjoy zzzzzz

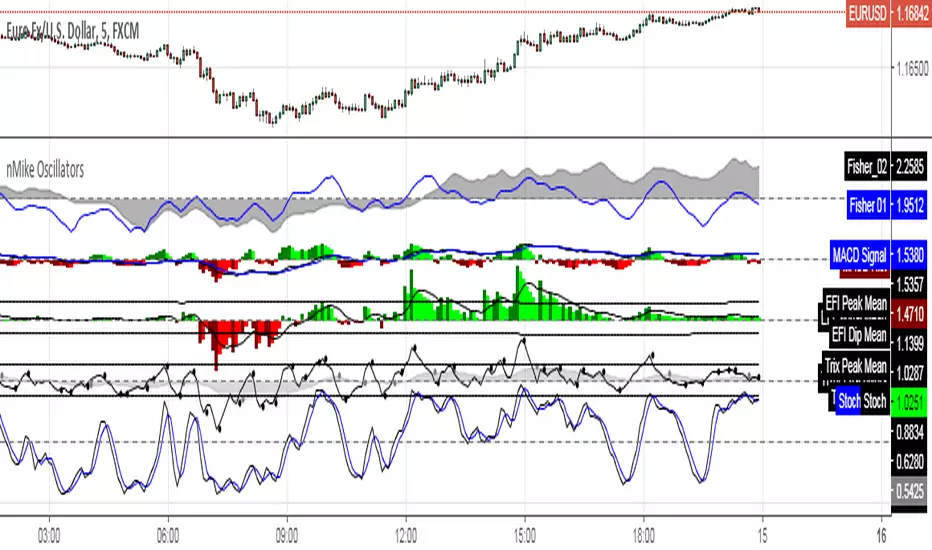
[RS]nMikes Divergence OscillatorsOscillator Package used for nMike's trading system.
Note: this is still in development, so use at your own discretion.
Oscillator Scatterplot Analysis [Trendoscope®]In this indicator, we demonstrate how to plot oscillator behavior of oversold-overbought against price movements in the form of scatterplots and perform analysis. Scatterplots are drawn on a graph containing x and y-axis, where x represent one measure whereas y represents another. We use the library Graph to collect the data and plot it as scatterplot.
Pictorial explanation of components is defined in the chart below.
🎲 This indicator performs following tasks
Calculate and plot oscillator
Identify oversold and overbought areas based on various methods
Measure the price and bar movement from overbought to oversold and vice versa and plot them on the chart.
In our example,
The x-axis represents price movement. The plots found on the right side of the graph has positive price movements, whereas the plots found on the left side of the graph has negative price movements.
The y-axis represents the number of bars it took for reaching overbought to oversold and/or oversold to overbought. Positive bars mean we are measuring oversold to overbought, whereas negative bars are a measure of overbought to oversold.
🎲 Graph is divided into 4 equal quadrants
Quadrant 1 is the top right portion of the graph. Plots in this quadrant represent the instances where positive price movement is observed when the oscillator moved from oversold to overbought
Quadrant 2 is the top left portion of the graph. Plots in this quadrant represent the instances where negative price movement is observed when the oscillator moved from oversold to overbought.
Quadrant 3 is the bottom left portion of the chart. Plots in this quadrant represent the instances where negative price movement is observed when the oscillator moved from overbought to oversold.
Quadrant 4 is the bottom right portion of the chart. Plots in this quadrant represent the instances where positive price movement is observed when the oscillator moved from overbought to oversold.
🎲 Indicator components in Detail
Let's dive deep into the indicator.
🎯 Oscillator Selection
Select the Oscillator and define the overbought oversold conditions through input settings
Indicator - Oscillator base used for performing analysis
Length - Loopback length on which the oscillator is calculated
OB/OS Method - We use Bollinger Bands, Keltener Channel and Donchian channel to calculate dynamic overbought and oversold levels instead of static 80-10. This is also useful as other type of indicators may not be within 0-100 range.
Length and Multiplier are used for the bands for calculating Overbought/Oversold boundaries.
🎯 Define Graph Properties
Select different graph properties from the input settings that will instruct how to display the scatterplot.
Type - this can be either scatterplot or heatmap. Scatterplot will display plots with specific transparency to indicate the data, whereas heatmap will display background with different transparencies.
Plot Color - this is the color in which the scatterplot or heatmap is drawn
Plot Size - applicable mainly for scatterplot. Since the character we use for scatterplot is very tiny, the large at present looks optimal. But, based on the user's screen size, we may need to select different sizes so that it will render properly.
Rows and Columns - Number of rows and columns allocated per quadrant. This means, the total size of the chart is 2X rows and 2X columns. Data sets are divided into buckets based on the number of available rows and columns. Hence, changing this can change the appearance of the overall chart, even though they are representing the same data. Also, please note that tables can have max 10000 cells. If we increase the rows and columns by too much, we may get runtime errors.
Outliers - this is used to exclude the extreme data. 20% outlier means, the chart will ignore bottom 20% and top 20% when defining the chart boundaries. However, the extreme data is still added to the boundaries.

Volume Zone OscillatorOscillator is build on Walid Khalil's and David Steckler's concept for leading volume oscillator
All indicators core's dynamics is fully explained it two articles bellow , written by concepts fathers
Stocks & Commodities V. 29:5 (16-23, 28): In The Volume Zone by Walid Khalil and David Steckler
edmond.mires.co/GES816/14-In%20The%20Volume%20Zone.pdf
2008-IFTA journal-Volume Zone Oscillator (VZO) ~by Waleed Aly Khalil
capitalsynergy.com/resources/IFTA09VZO.pdf
//
Extreme conditions are visually intuitive
Momentum shift alerts
Candle printer for H/R Divergence pockets and confirmed divergences
Ehlers white noise indicator "branch" have wonderful confluences with VZO so its included as optional feature, its toggle button and settings are market with ⚠️to remind that its still heavily experimental
Every visual object group in script can be turned off separately from each other for customization freedom
V0.5


Cunupia Capital DMI OscillatorOscillator for DMI, it allows you to see the difference in percentage with the different DMI lines, positive and negative and it's strength.

Assassin OscillatorOscillator use for judgement trend high or low.
Have some lag for calculation.
mainly use keltner channels.
Have some lag , But you can modify it.

DiNapoli Oscillator PredictorOscillator Predictor is a useful indicator that paints dynamic OverBought and OverSold levels which are unknown to most of traders.
This version of the indicator includes the following options:
Ability to show/hide OB/OS levels independently
Ability to show/hide preceding OB/OS clouds
Option to declutter the chart and draw the line only during last candles
Allows custom setting of the oscillation period
Allows customization of OB/OS trigger levels
Displays safe suggestion to place Stop Loss levels
Show/hide line tags
This indicator is meant to be used by a private group of traders.
If you would like to subscribe, send me a private message.
